Running tab of macro indicators: 15 out of 20
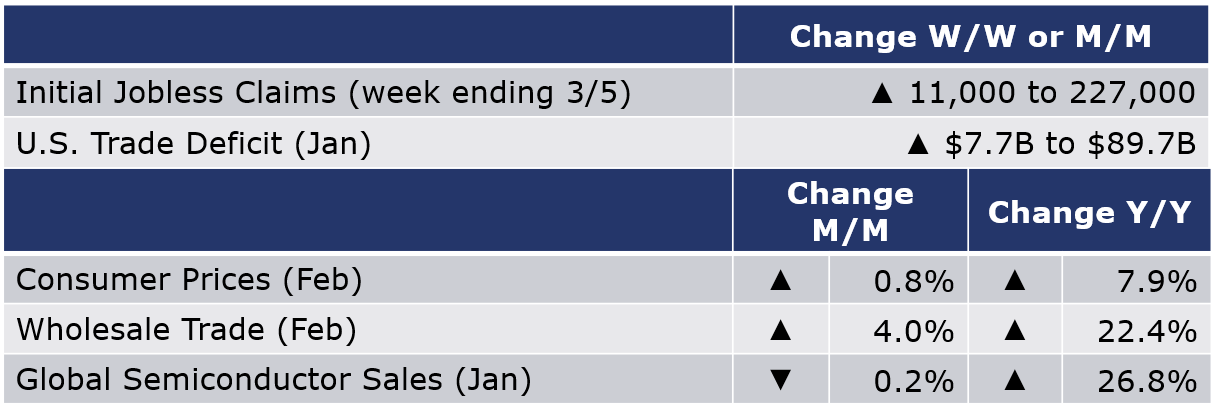
The number of new jobless claims rose by 11,000 to 227,000 during the week ending 5 March. Continuing claims increased slightly to 1.5 million, and the insured unemployment rate for the week ending 26 February remained unchanged at 1.1%.
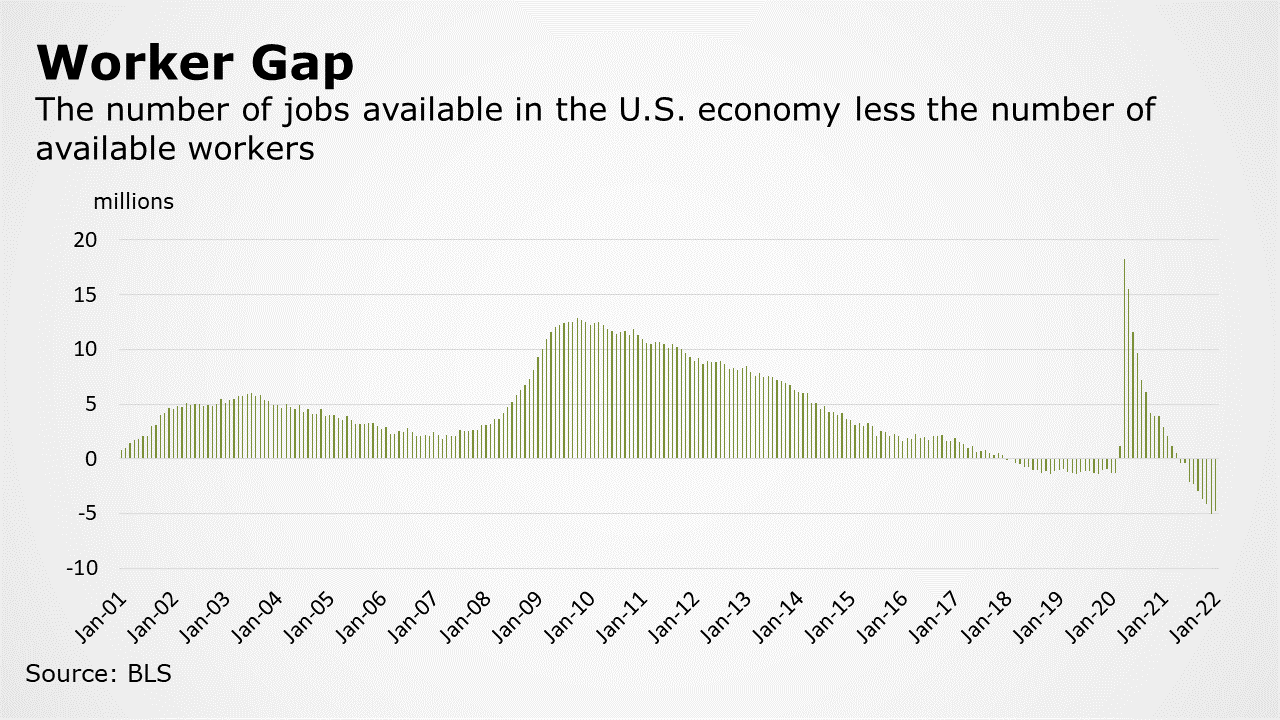
The JOLTS report on job openings and quits from the labor department continues to show a very tight labor market with near-record job openings in January (11.3 million). The number of people quitting their jobs eased for a second month but remained 23% higher than pre-pandemic levels. When job openings are added to the number of people currently employed (to estimate the total number of jobs available in the economy) and compared to the labor force, the U.S. economy had 4.5 million more jobs than willing workers to fill them.
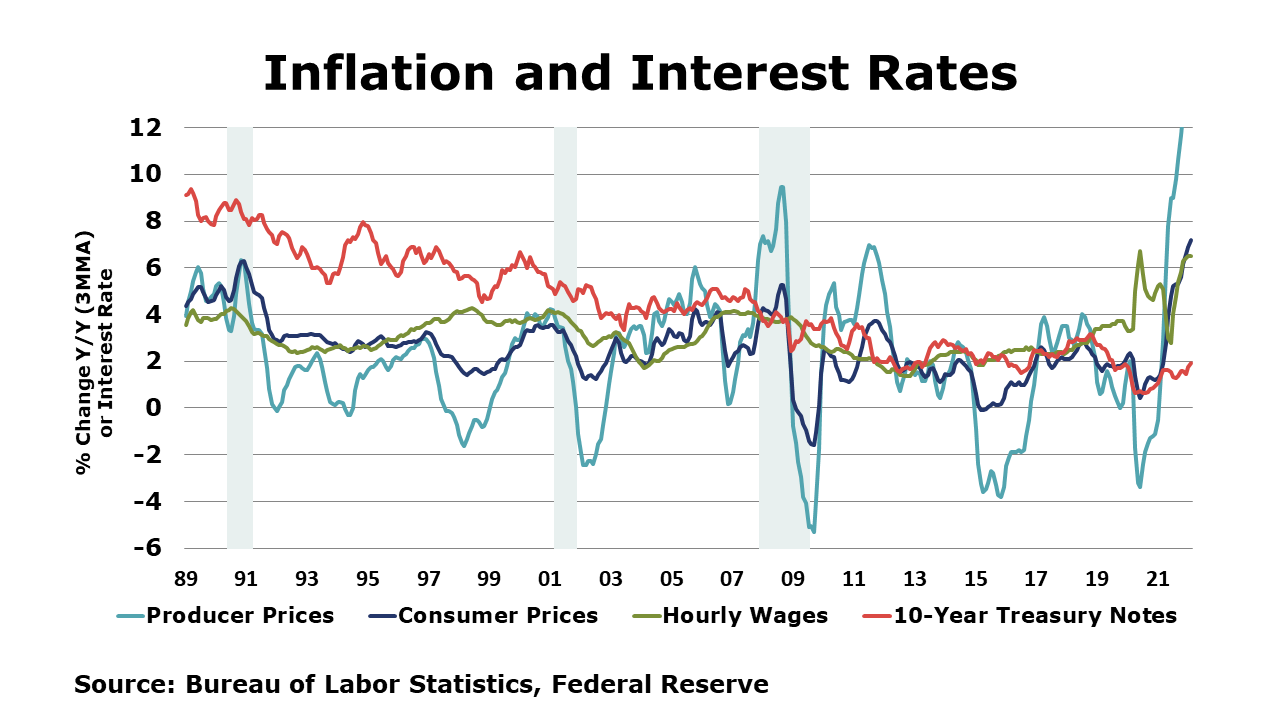
Headline consumer prices rose by 0.8% in January and were up 7.9% Y/Y. The gasoline index rose 6.6% percent in February and accounted for almost a third of all items; there were also large increases in shelter and food. The index for all items less food and energy (core CPI) rose 0.5% in January, the shelter index was by far the biggest factor in the increase; there were also increases in recreation, household furnishings and operations, motor vehicle insurance, personal care, and airline fares.
Wholesale inventories rose 0.8% by the end of January and were 18.1% higher than levels in January 2021. Wholesale sales were up 4.0% in January and were 22.4% higher than a year earlier. The inventories-to-sales ratio fell to 1.20 in January, down from 1.24 in December and lower than the January 2021 level of 1.25. At 1.20, the inventories-to-sales ratio was at its lowest level since 2014 as sales growth outpaced growth in inventories.
The U.S. trade deficit in goods and services widened by $7.7 billion to $89.7 billion in January as exports declined by 1.7% and imports increased 1.2%. Exports of goods fell in January reflecting a decline in pharmaceutical preparations that offset smaller gains in civilian aircraft and telecommunications equipment. Exports of services fell in January as well reflecting declines in travel and transport. Goods imports rose with higher auto and auto parts imports. Imports of crude oil, natural gas and copper, foods and meat products, telecommunications equipment and other industrial machinery were also higher.
Global semiconductor sales slipped in January with gains in Europe and other Asia offset by weaker sales in the Americas, Japan and China. Compared to year ago, global semiconductor sales were up 26.8% Y/Y with the largest gains in the Americas and Europe.
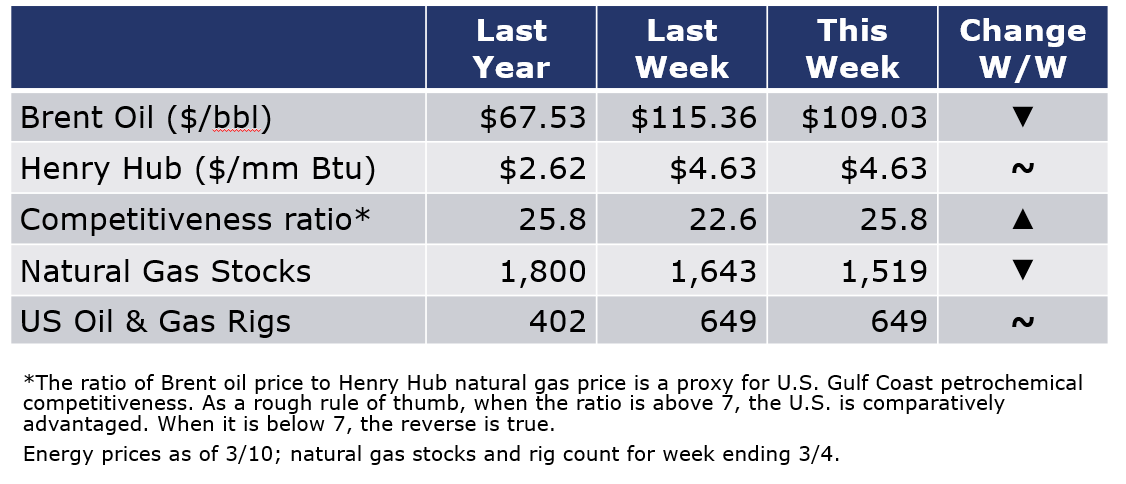
Oil prices surged on the news that the U.S. joined other nations in banning imports of Russian oil in addition to additional sanctions affecting energy production in the region. Oil prices briefly flirted with $140/bbl on Monday before easing below $110 Thursday evening, down from the previous week. U.S. natural gas prices remained steady. The combined oil and gas rig count remained steady at 649 during the week ending 4 March.
For the business of chemistry, the indicators still bring to mind a green banner for basic and specialty chemicals.
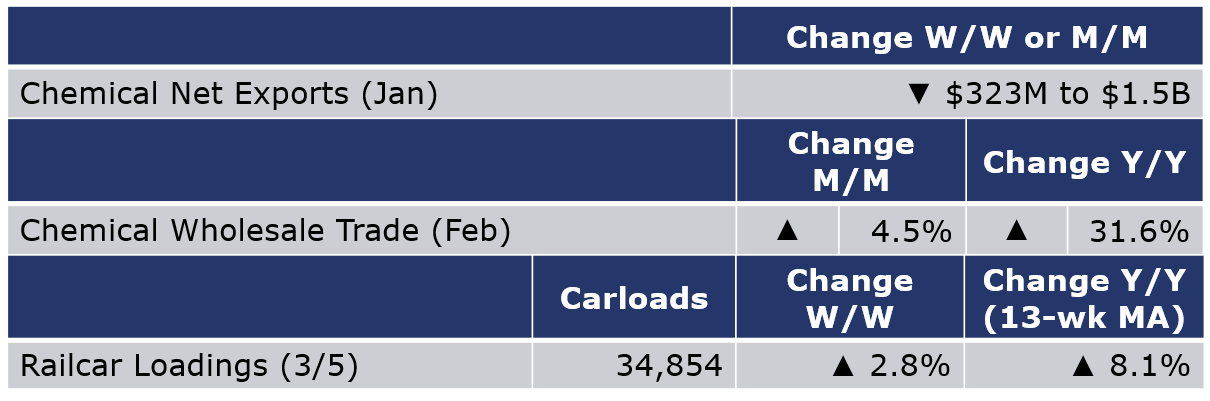
According to data released by the Association of American Railroads, chemical railcar loadings were up 2.8% to 34,854 for the week ending 5 March (week 9). On a Y/Y basis, loadings were up 17.8%, still reflecting weather-related production impacts this time last year. Loadings were up 8.1% Y/Y (13-week MA), up 9.1% YTD/YTD and have been on the rise for 7 of the last 13 weeks.
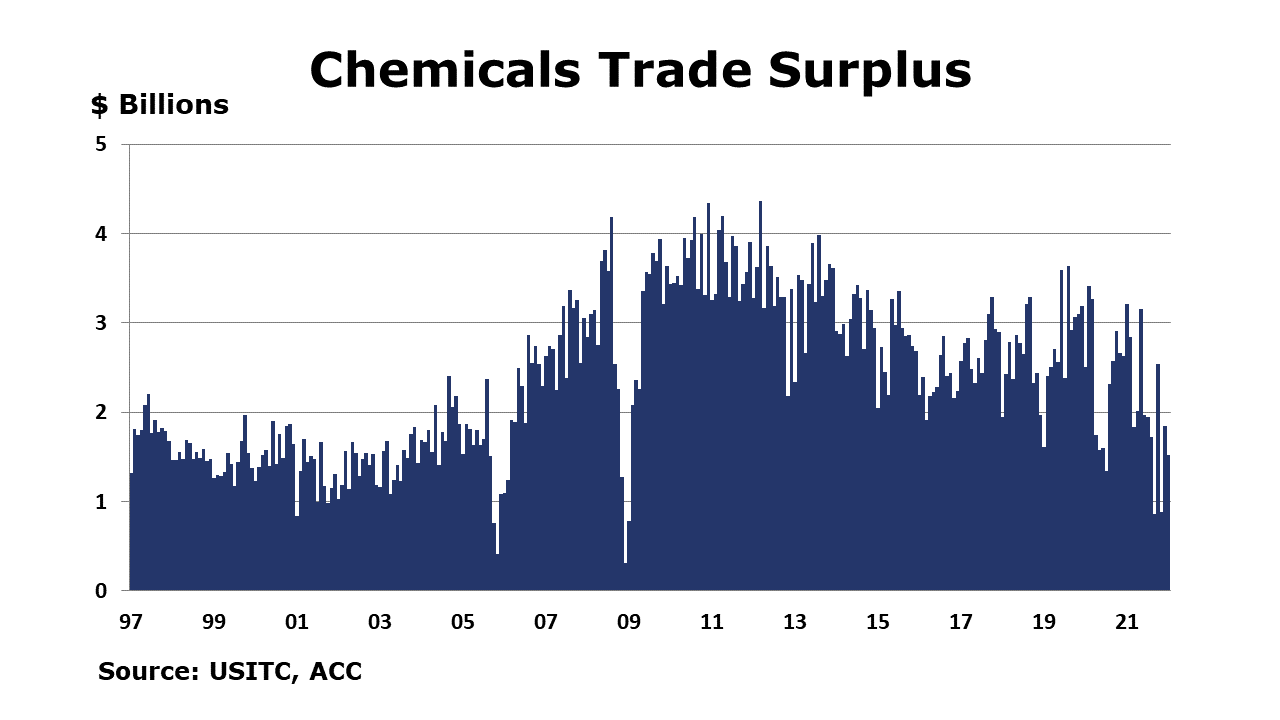
Chemicals exports were up 2.0% in January and up 16.8% Y/Y driven by a rise in petrochemicals exports. Chemical imports were up 5.1% in January and were up 43.2% Y/Y driven by gains in all major categories except consumer products. The monthly trade surplus was lower at $1.5 billion given imports growth outpacing exports.
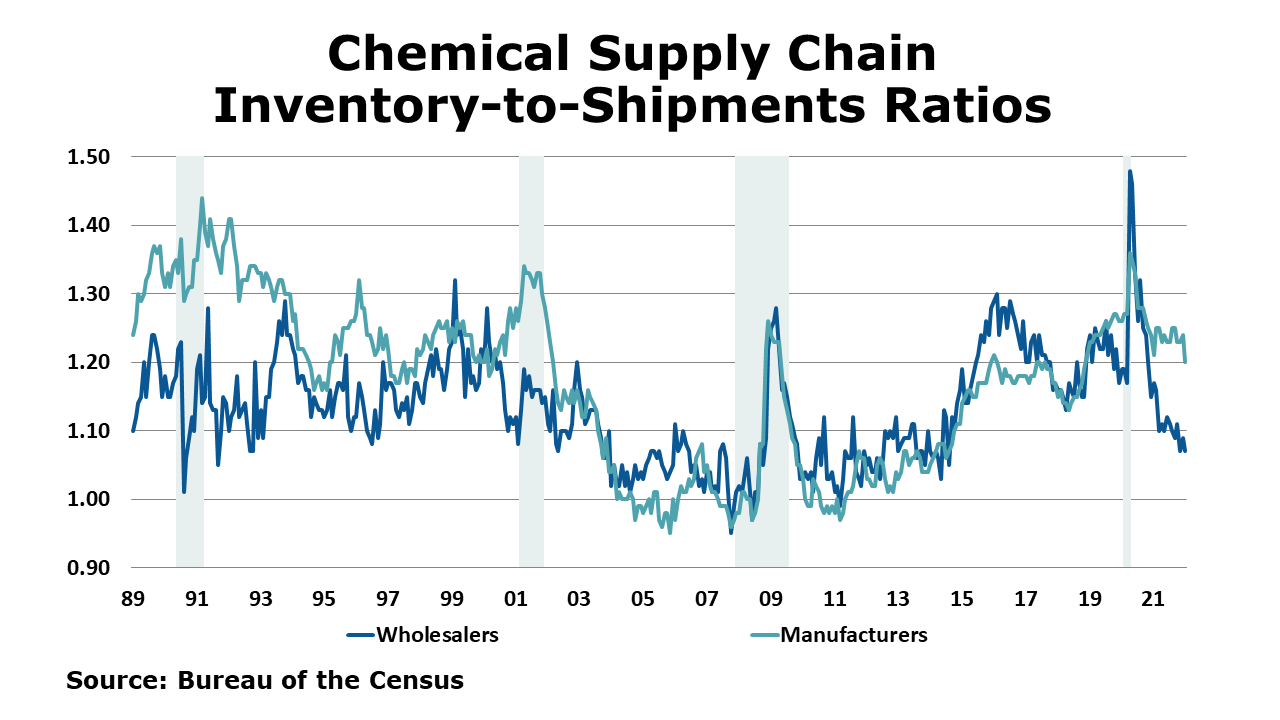
Wholesale chemical inventories rose 2.7% by the end of January to $14.3 billion, a level up 20.8% Y/Y. Wholesale sales were up 4.5% in January to $13.4 billion, a level 31.6% higher than a year before. The inventories-to-sales ratio decreased to 1.07 in January from 1.09 in December and was down from 1.16 a year earlier.
Note On the Color Codes
The banner colors represent observations about the current conditions in the overall economy and the business chemistry. For the overall economy we keep a running tab of 20 indicators. The banner color for the macroeconomic section is determined as follows:
Green – 13 or more positives
Yellow – between 8 and 12 positives
Red – 7 or fewer positives
For the chemical industry there are fewer indicators available. As a result we rely upon judgment whether production in the industry (defined as chemicals excluding pharmaceuticals) has increased or decreased three consecutive months.
For More Information
ACC members can access additional data, economic analyses, presentations, outlooks, and weekly economic updates through MemberExchange.
In addition to this weekly report, ACC offers numerous other economic data that cover worldwide production, trade, shipments, inventories, price indices, energy, employment, investment, R&D, EH&S, financial performance measures, macroeconomic data, plus much more. To order, visit https://store.americanchemistry.com/.
Every effort has been made in the preparation of this weekly report to provide the best available information and analysis. However, neither the American Chemistry Council, nor any of its employees, agents or other assigns makes any warranty, expressed or implied, or assumes any liability or responsibility for any use, or the results of such use, of any information or data disclosed in this material.
Contact us at ACC_EconomicsDepartment@americanchemistry.com


