Running tab of macro indicators: 8 out of 20
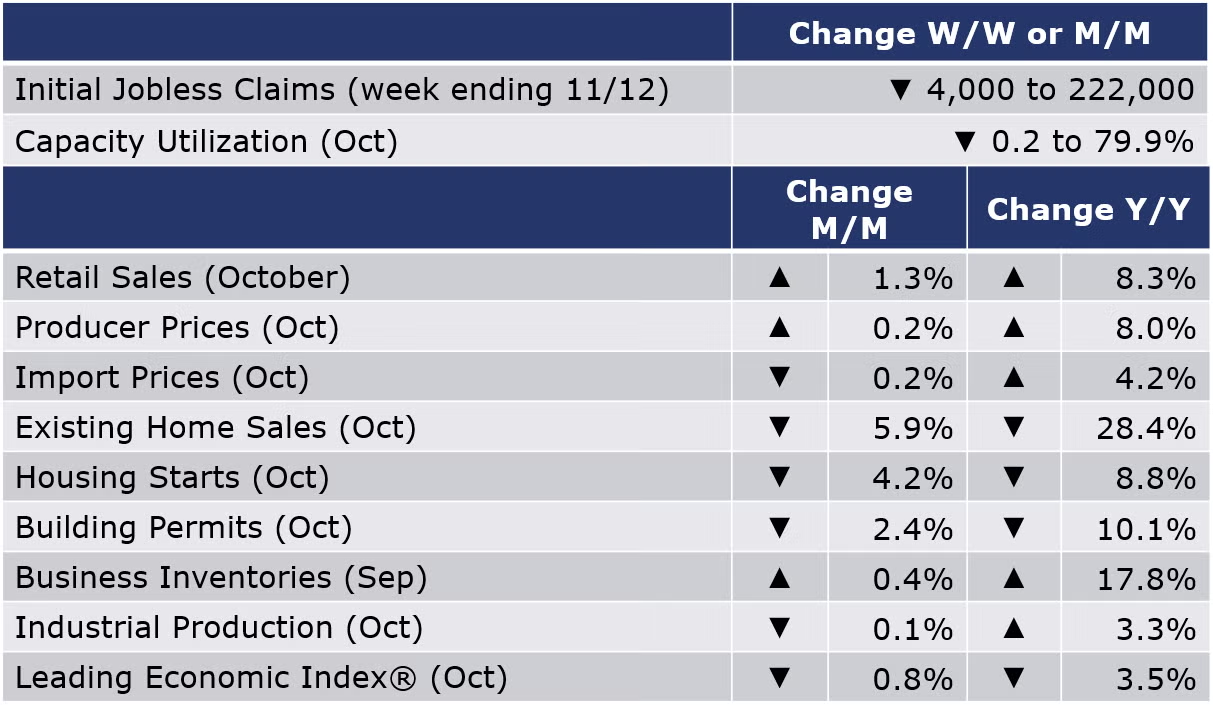
The number of new jobless claims was fell by 4,000 to 222,000 during the week ending 12 November. Continuing claims increased by 13,000 to 1.5 million, and the insured unemployment rate for the week ending 5 November was unchanged at 1.0%.
Retail and food service sales rose by 1.3% in October, following flat growth in September. Sales growth, which isn’t adjusted for inflation, reflected gains across most sectors. The strongest gains were in sales at restaurants, motor vehicle dealers, grocery stores, online platforms, building materials & garden centers, and furniture & furnishing stores. Sales were up 8.3% Y/Y.
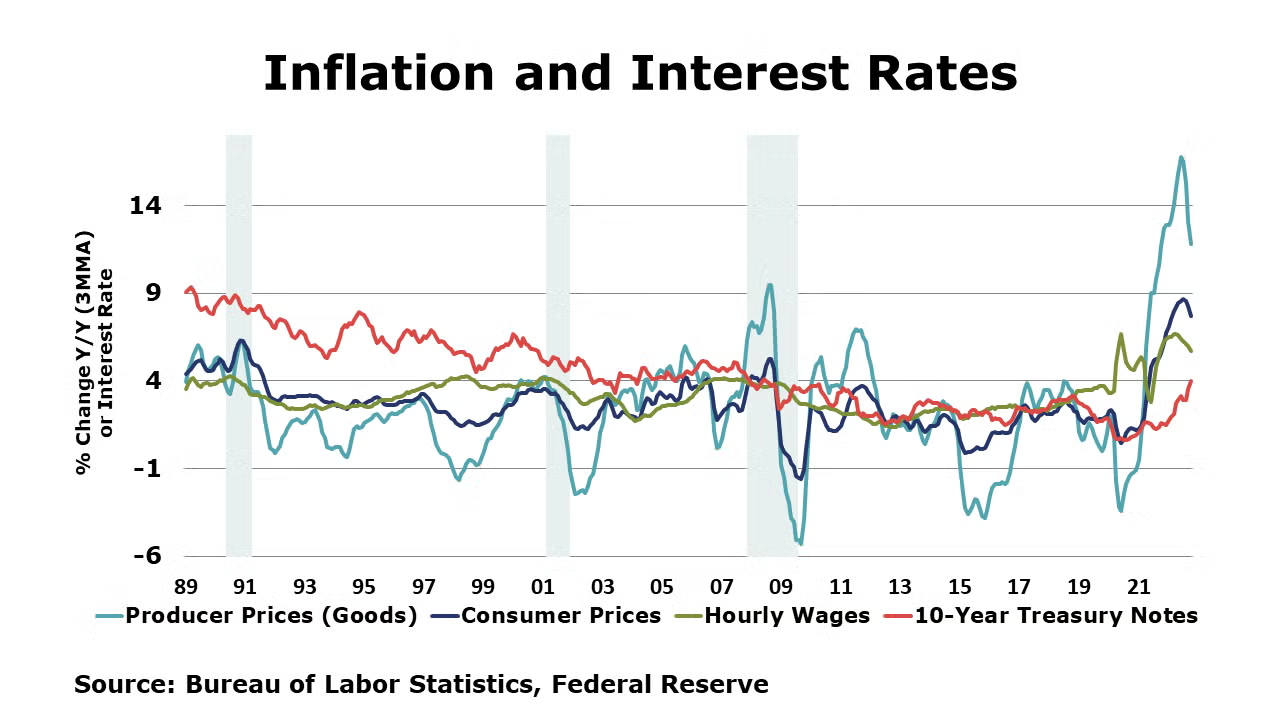
Coming in lower than expected, producer prices rose 0.2% in October, following a similar gain in September and flat growth in August. Producer prices for final demand goods accelerated by 0.6%, the largest gain since June. The gain in goods prices was led by higher energy prices (gasoline and diesel). Core goods prices edged lower by 0.1%, the first monthly decline since the 2020 pandemic lockdowns. Compared to a year ago, headline producer prices were up 8.0% Y/Y while core prices were up 5.4% Y/Y. Both measures were the lowest annual comparisons since mid-2021. Import prices fell by 0.2% in October, the fourth consecutive decline. The decline was led by lower prices for imported fuels, but prices for nonfuel imports also edged lower. The BLS notes that prices were mixed for the major finished goods categories with higher prices for automotive vehicles and parts. A modest decline in prices for nonfuel industrial supplies and materials came from lower prices for selected building materials that more than offset higher unfinished metal prices. Prices for U.S. exports fell 0.3% with declines in both agricultural and nonagricultural exports. Compared to a year ago, import prices were up 4.2% Y/Y while export prices were up 6.9% Y/Y.
Existing home sales continued to tumble in October, down 5.9% to a 4.43 million annual pace, the lowest level since the pandemic lockdowns. The inventory of unsold homes slipped for a third month and now represent a 3.3-month supply (up from 3.1 months in September). At $379,100, the median sales price was up 6.6% compared to a year ago, but prices have declined in recent months in response to higher mortgage rates which have negatively impacted affordability.
Homebuilder confidence fell for an 11th straight month, down 5 points to 33, according to the National Association of Homebuilders. This is reflective of the 4.2% decline in total housing starts following the 1.3% decline in September. The level remains below the cycle peak in December 2021 and 8.8% below the October 2021 level. Most regions posted declines this month with the exception of the South region, where housing starts increased. Forward-looking building permits were also down by 2.4% to 1.56 million units on a seasonally adjusted at annual rate basis with all regions recording losses except the South. Single-family units showed a decline that was more than made up by multi-family units. Rising mortgage rates will continue to exert downward pressure on construction activities going forward.
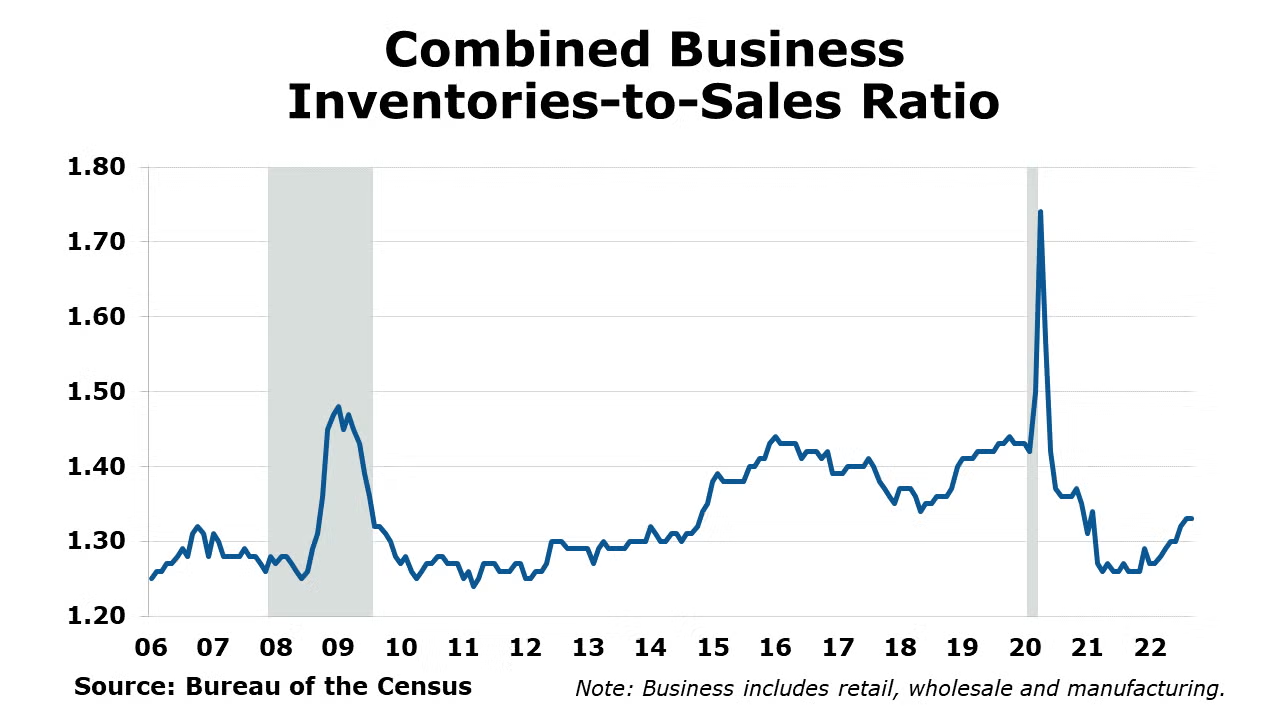
The nominal value of combined business inventories continued to expand in September, up 0.4% with gains across all major segments of the supply chain. The largest gains were in merchant wholesalers. Combined business sales increased (0.2%). Sales increased in manufacturing and in merchant wholesale but dropped slightly (by 0.1%) in retail. Compared to a year ago, business inventories were up 17.8% Y/Y while sales were up by 11.5% Y/Y. The inventories-to-sales ratio held steady at 1.33 in September. A year ago, the ratio was 1.26.
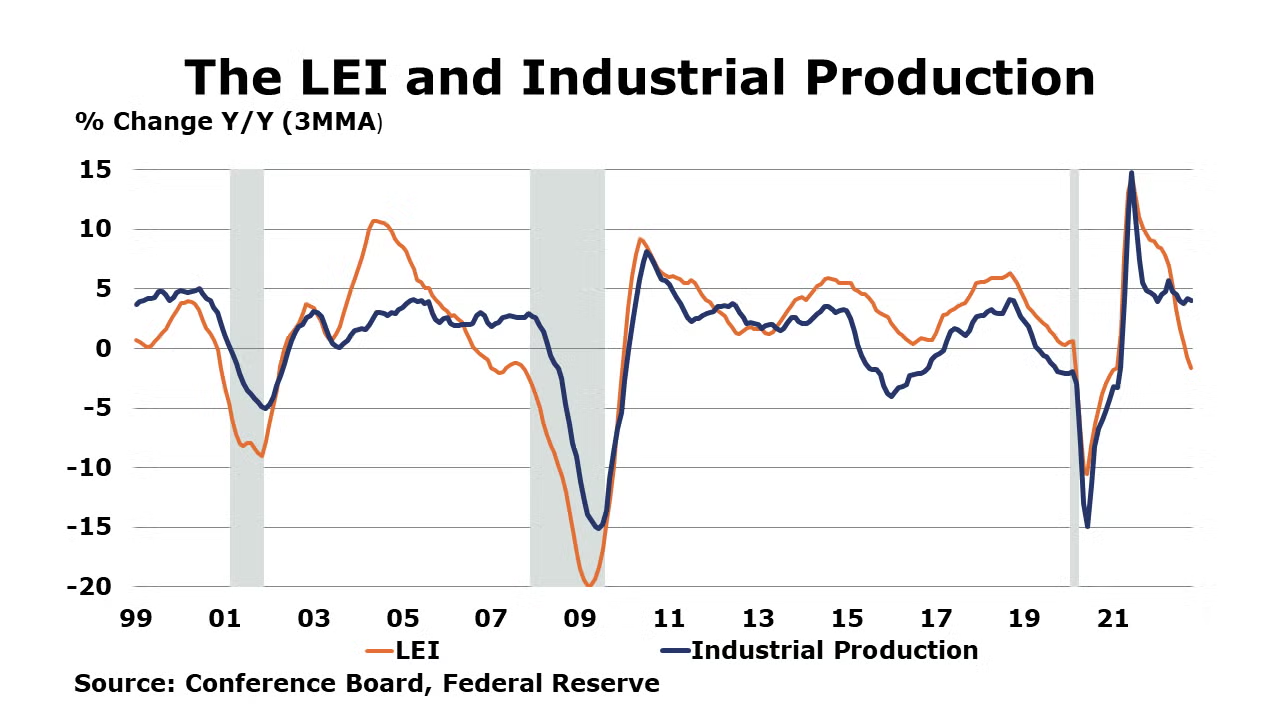
Following a 0.1% gain in September, industrial production edged lower by 0.1% in October. Declines in mining and utility output were offset by modestly higher manufacturing output. Within manufacturing, results were mixed with the largest gains in the output of machinery, electrical equipment, motor vehicles, aerospace, and printing. The largest declines were in the output of wood products, nonmetallic mineral products, petroleum products, paper and textiles. Compared to a year ago, industrial production was up by 3.3% Y/Y. Capacity utilization edged lower by 0.2 percentage points to 79.9%. A year ago, capacity utilization was running at 78.6%. Over the past year, overall industrial capacity was 1.6% higher.
The Conference Board’s Leading Economic Index® fell for an eight consecutive month, off by 0.8 percentage points in October and was 3.5% lower than a year ago. The decline was more than expected and the reading suggests that a recession is near. The Conference board notes that the “downturn in the LEI reflects consumers' worsening outlook amid high inflation and rising interest rates, as well as declining prospects for housing construction and manufacturing.”
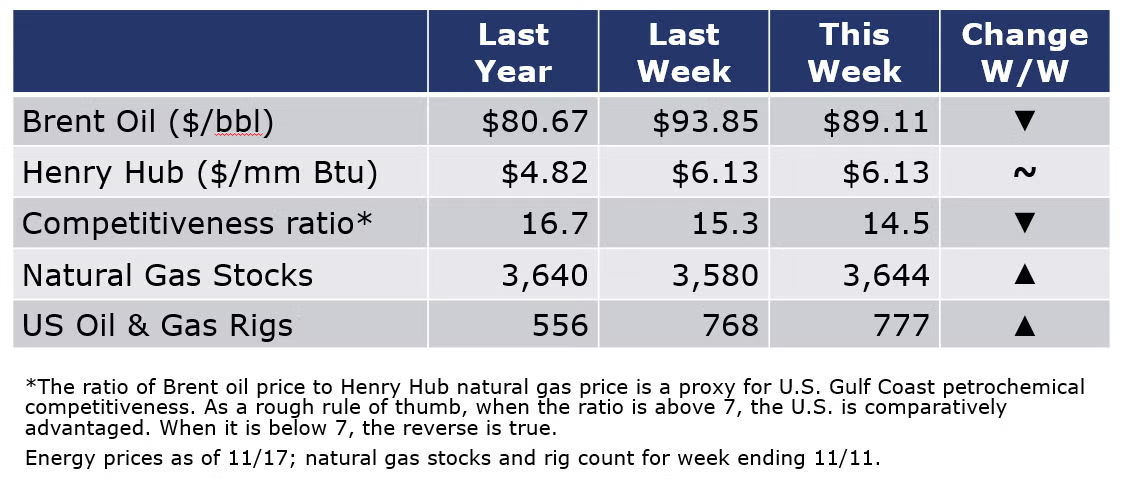
Oil prices were lower this week on news that several Chinese cities have reported record infections leading to more restrictions. In addition, the Druzhba pipeline from Russia into Hungary has restarted deliveries following a disruption. Looking ahead, upcoming sanctions on Russian oil take effect on December 5th, however discussions continue among the G7 countries on key details. Natural gas prices were unchanged from a week ago. With continued warmer temperatures across much of the U.S. last week, natural gas inventories continued to build and were slightly ahead of last year’s levels and only 0.2% below average. The combined oil and gas rig count rose by nine to 777 during the week ending November 11th.
For the business of chemistry, the indicators still bring to mind a yellow banner for basic and specialty chemicals.
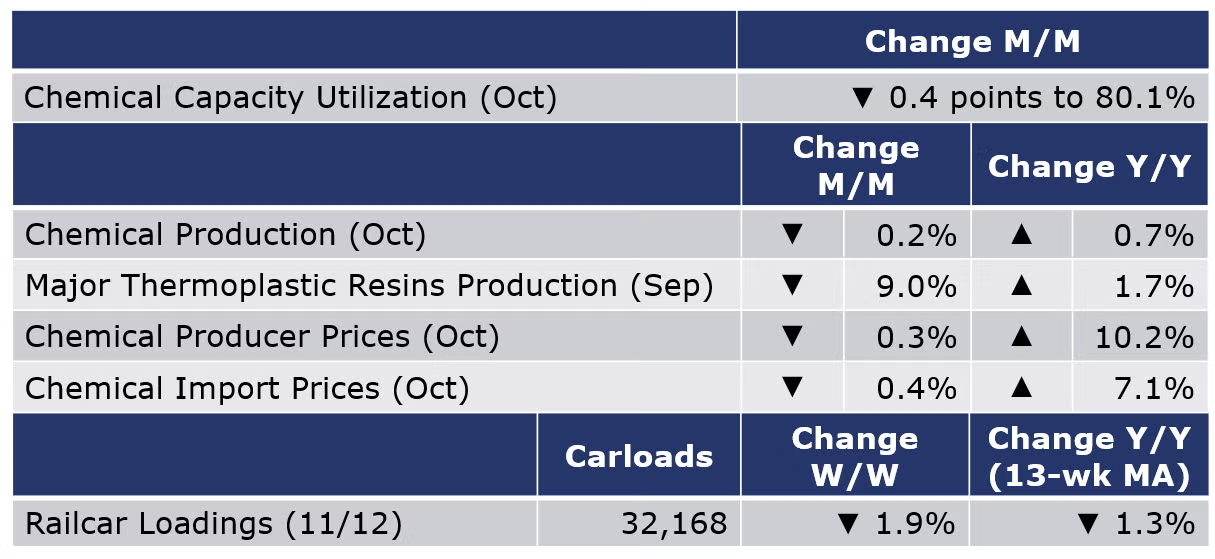
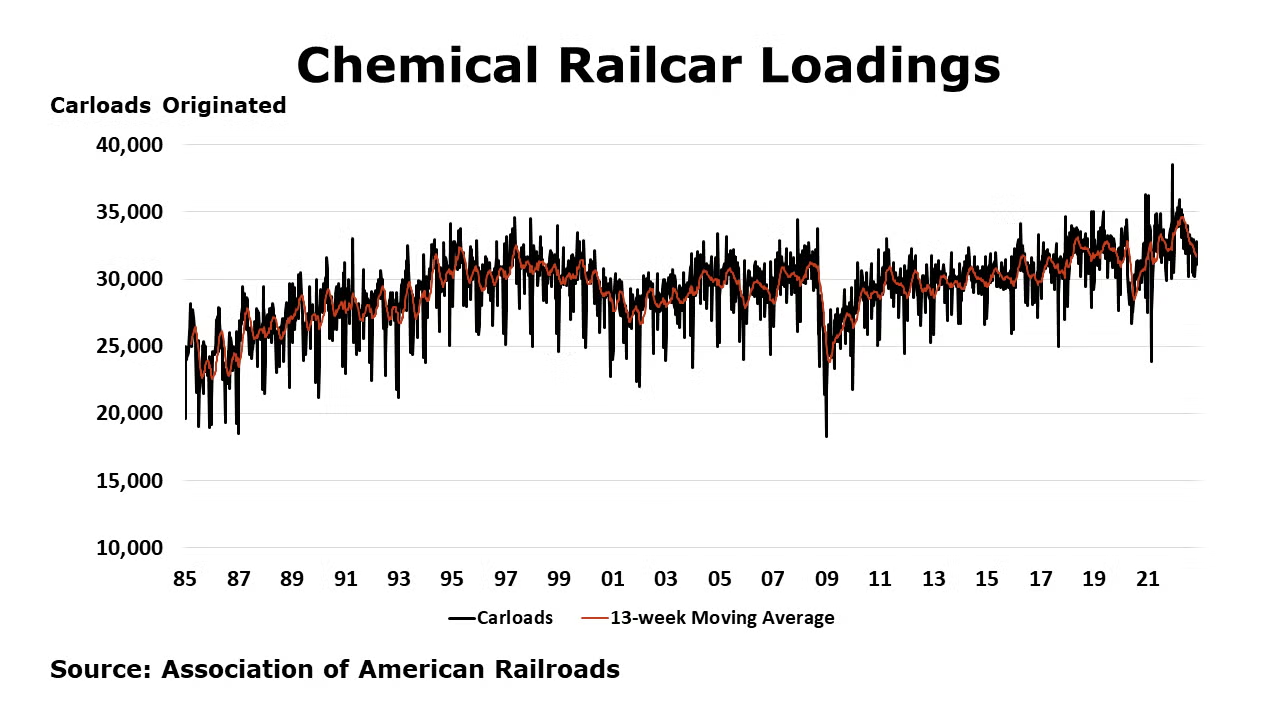
According to data released by the Association of American Railroads, chemical railcar loadings were down 635 for the week ending 12 November. Loadings were down 1.3% Y/Y (13-week MA), up (2.1%) YTD/YTD and have been on the rise for 7 of the last 13 weeks.
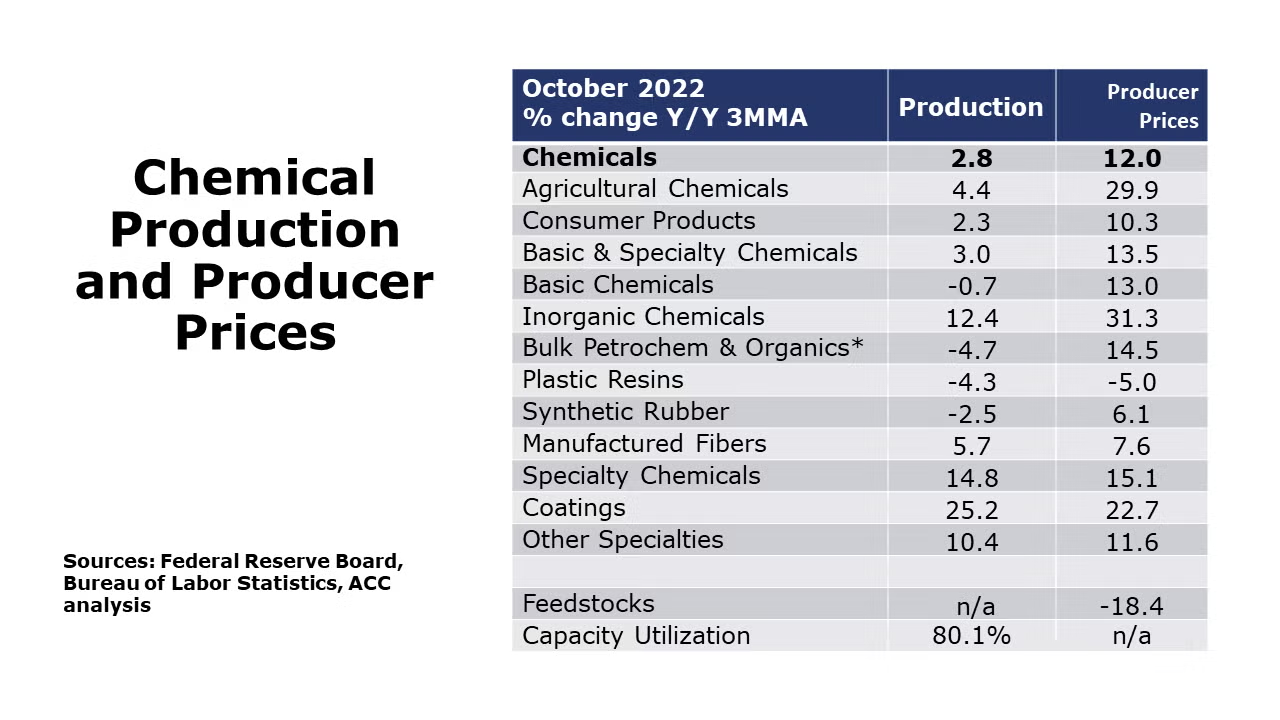
Chemical producer prices fell for a fourth consecutive month in October, down by 0.3%. Gains in the prices of agricultural chemicals, inorganic chemicals, bulk petrochemicals, coatings, and manufactured fibers were more than offset by declining prices for plastic resins, synthetic rubber, other specialty chemicals, and consumer products. Chemical producer prices remained ahead by 10.2% Y/Y. Chemical import prices fell for a fifth consecutive month in October, off by 0.4%. Export prices also continued to fall, down 2.9% during the month. Compared to a year ago, chemical import prices were up 7.1% Y/Y, while export prices were off 1.6% Y/Y, the first negative annual comparison since September 2020.
Chemical production moved lower for a second month in October, down 0.2%. Declines in the production of organic chemicals, resins, synthetic rubber, manufactured fibers, fertilizers, and crop protection chemicals were offset by production gains in inorganic chemicals, coatings, other specialties, and consumer products. Capacity utilization fell by 0.4 percentage points to 80.1%.
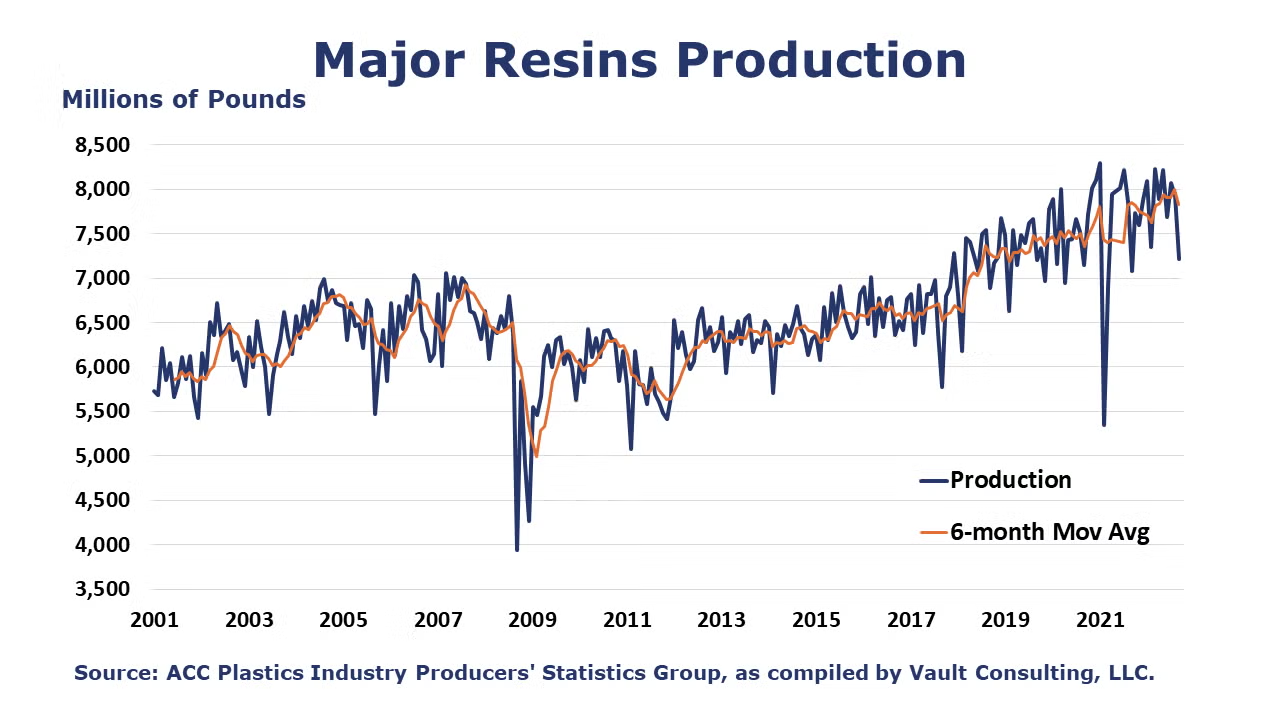
According to data from ACC’s Plastics Industry Producers Statistics group, U.S. production of major plasticresins totaled 7.2 billion pounds during September 2022, down 9.0% M/M and up 1.7% Y/Y. Year-to-date production was 70.8 billion pounds, up 4.5% as compared to the same period in 2021.Sales and captive (internal) use of major plastic resins totaled 7.7 billion pounds, down 4.1% M/M and up 7.5% Y/Y. Year-to-date sales and captive use were 70.3 billion pounds, up 5.3% as compared to the same period in 2021.
The U.S. Geological Survey reported that monthly production of soda ash in August was 947 thousand tons, down 4.5% compared to the previous month and up 7.9% Y/Y. Stocks fell 23.1% over July to 237 thousand tons at the end of the month, an 8-day supply. Ending stocks were down 2.1% Y/Y.
Note On the Color Codes
The banner colors represent observations about the current conditions in the overall economy and the business chemistry. For the overall economy we keep a running tab of 20 indicators. The banner color for the macroeconomic section is determined as follows:
Green – 13 or more positives
Yellow – between 8 and 12 positives
Red – 7 or fewer positives
For the chemical industry there are fewer indicators available. As a result we rely upon judgment whether production in the industry (defined as chemicals excluding pharmaceuticals) has increased or decreased three consecutive months.
For More Information
ACC members can access additional data, economic analyses, presentations, outlooks, and weekly economic updates through MemberExchange.
In addition to this weekly report, ACC offers numerous other economic data that cover worldwide production, trade, shipments, inventories, price indices, energy, employment, investment, R&D, EH&S, financial performance measures, macroeconomic data, plus much more. To order, visit http://store.americanchemistry.com/.
Every effort has been made in the preparation of this weekly report to provide the best available information and analysis. However, neither the American Chemistry Council, nor any of its employees, agents or other assigns makes any warranty, expressed or implied, or assumes any liability or responsibility for any use, or the results of such use, of any information or data disclosed in this material.
Contact us at ACC_EconomicsDepartment@americanchemistry.com

