Running tab of macro indicators: 9 out of 20
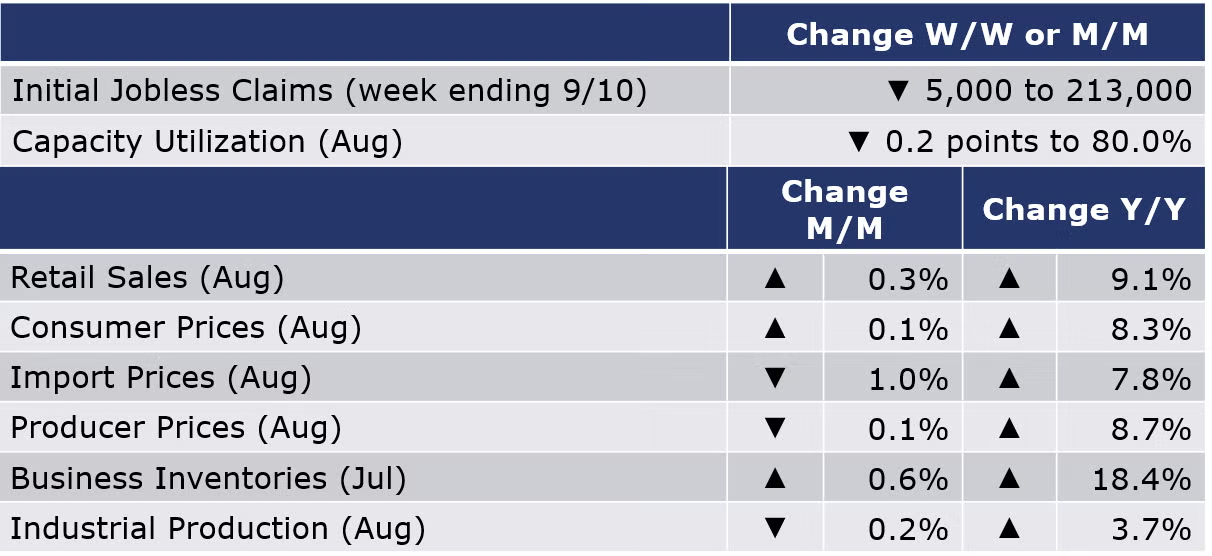
The number of new jobless claims fell by 5,000 during the week ending 10 September to 213,000 – declining for the 6th week in a row. Continued claims edged up to 1,403,000, or 2,000 from the previous week’s level. Both new jobless claims and continued claims last week have been revised downwards, reflecting a strong labor market. The insured unemployment rate for the week ending September 3 was unchanged at 1.0.
Headline retail and food services sales rose 0.3% in August compared to July and up 9.1% compared to August 2021. Excluding motor vehicles, however, sales were down 0.3% with mixed results among segments during the month. On a Y/Y basis, the largest gains were in gasoline stations (38.8%), non-store retailers (12.7%), and miscellaneous store retailers (16.3%); the largest decline was in electronics & appliance stores (-9.1%).
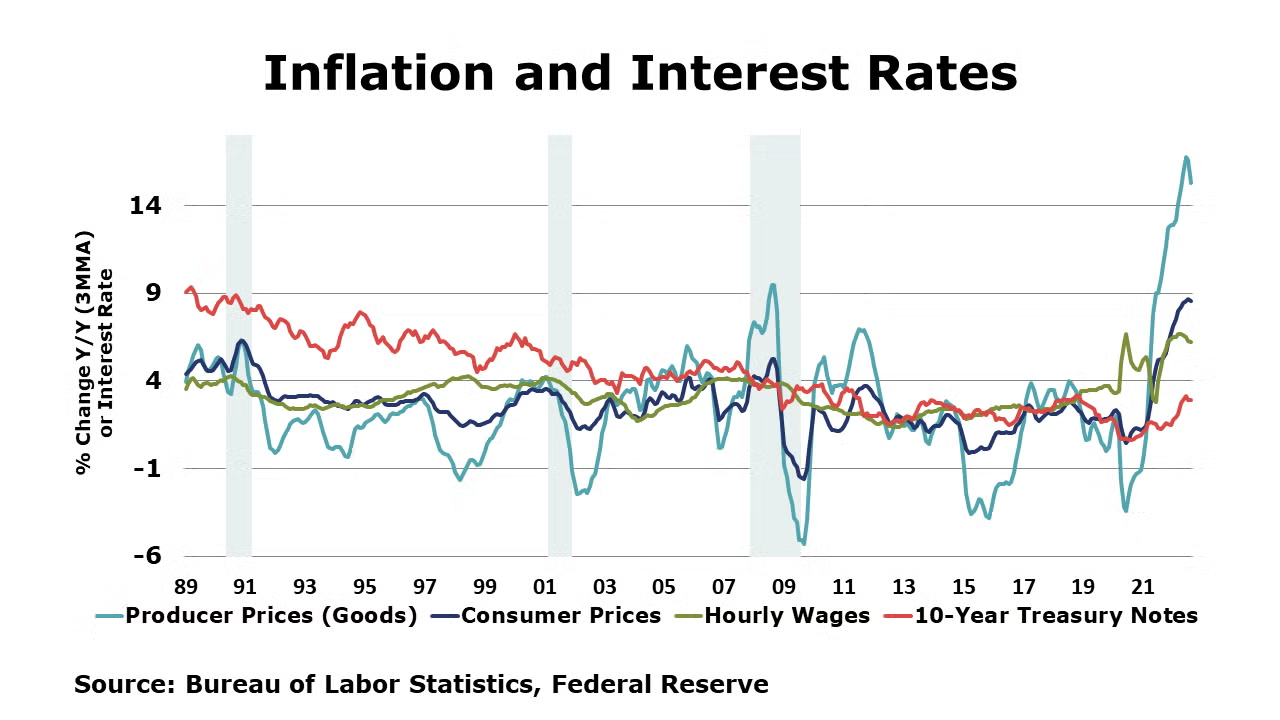
Consumer prices rose by 0.1% in August and have risen 8.3% over the last 12 months. While gasoline prices declined notably, it wasn’t enough to offset gains in other areas including shelter, food, and medical care expenses. The measure of core-CPI which excludes energy and food prices was up 0.6% in August and has risen 6.3% over the past 12 months.
Producer prices eased for a second month in August, down by a modest 0.1%. The decline was led by a 6.0% fall in the price of energy goods. That decline was offset, however, by continued gains in prices of core goods. Compared to a year ago, headline producer prices were up 8.7% Y/Y (the lowest in a year) while core prices were up 5.6% Y/Y, both measures lower than in July. While in line with expectations and moving in the right direction, producer prices remain concerningly high.
Import prices fell 1.0% in August following a 1.5% loss in July. This was the first consecutive month drop since February-April 2020. Both fuel and nonfuel prices contributed to the decline in U.S. import prices in August. U.S. import prices rose 7.8% over the past 12 months, the smallest over-the-year increase since the index advanced 7.1% from March 2020 to March 2021.
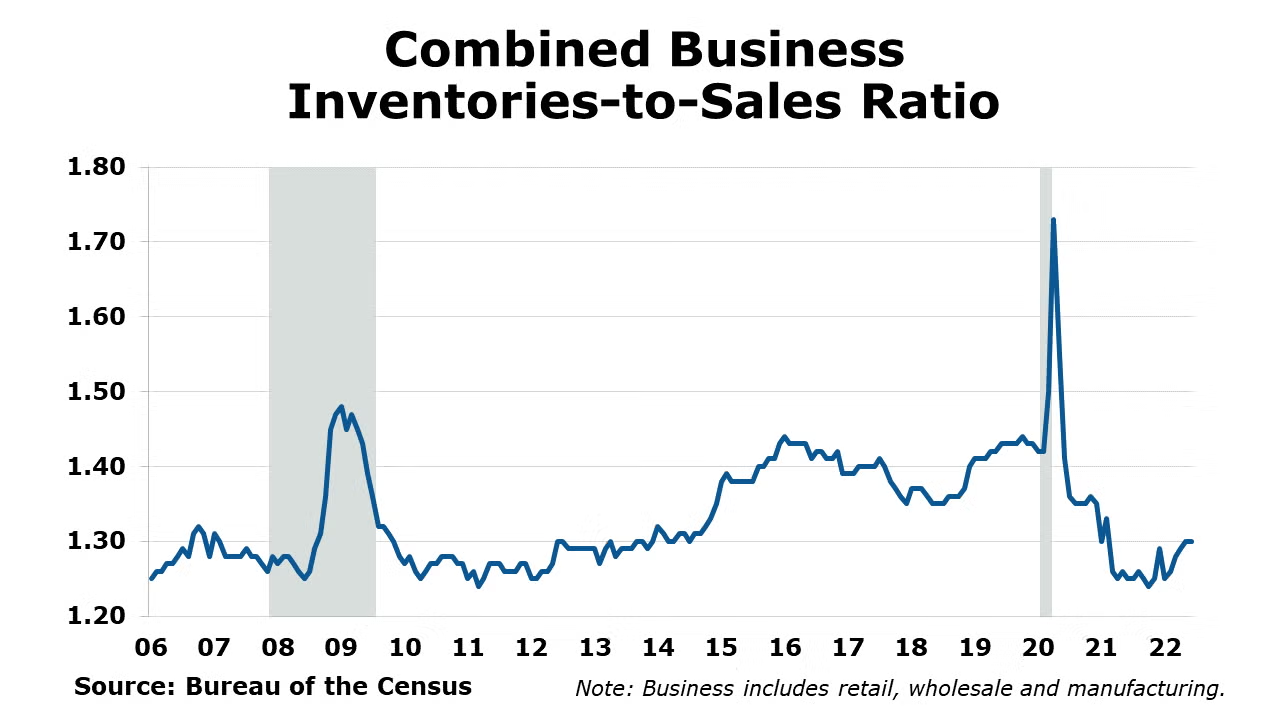
The nominal value of combined business inventories continued to expand in July, up 0.6% with gains across all major segments of the supply chain. Continuing the trend in the past months, the largest gains were in retail. Combined business sales decreased (0.9%) for the first time since December last year. Sales decreased across all segments but was more pronounced in the merchant wholesaler’s category. Compared to a year ago, business inventories were up 18.4% Y/Y while sales were up by 12.5% Y/Y. The inventories-to-sales ratio edged up to 1.32 in July. A year ago, the ratio was 1.26.
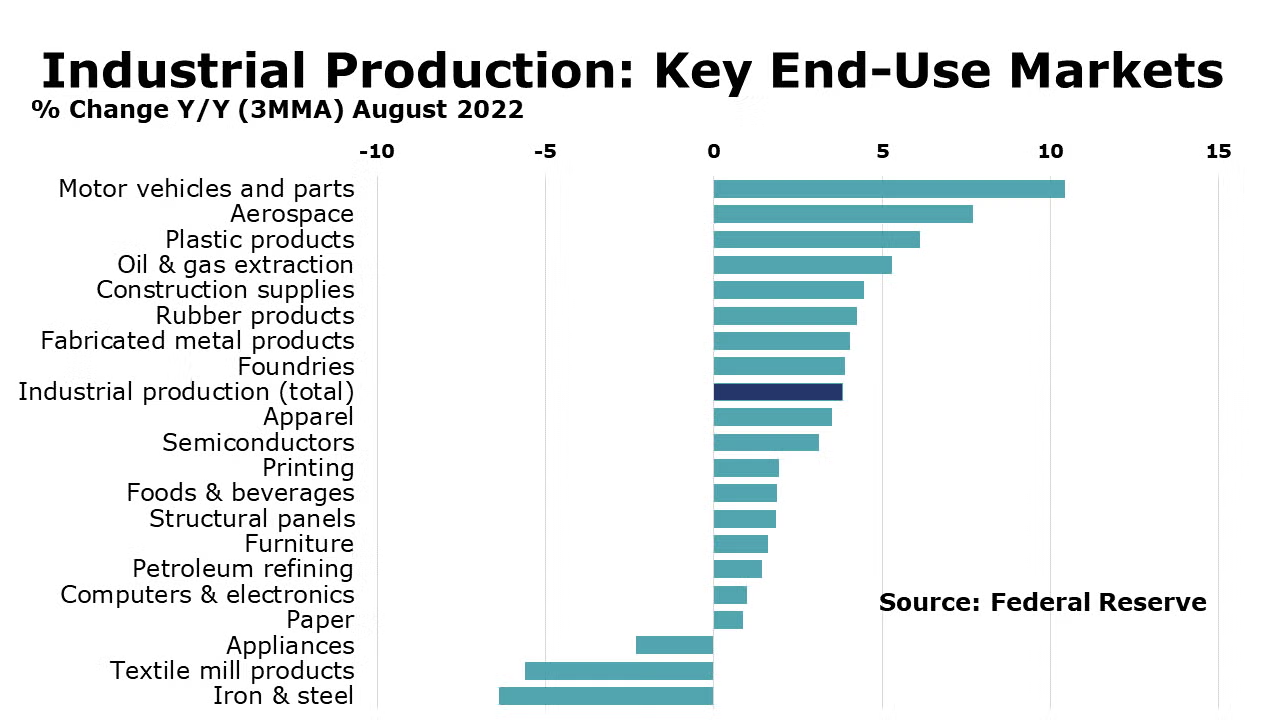
Following a 0.5% gain in July, industrial production fell 0.2% in August. Lower utility output and flat growth in mining output were offset by a modest gain in manufacturing. Large declines in the output of housing-related manufacturing, (i.e., wood products, furniture, textile products) and motor vehicles were offset by gains in aerospace, machinery, computers & electronics, and petroleum products. Compared to a year ago, industrial production was up 3.7% Y/Y. The capacity utilization rate eased by 0.2 points to 80.0%. A year ago, capacity utilization was 78.2%. Industrial capacity was up 1.4% Y/Y.
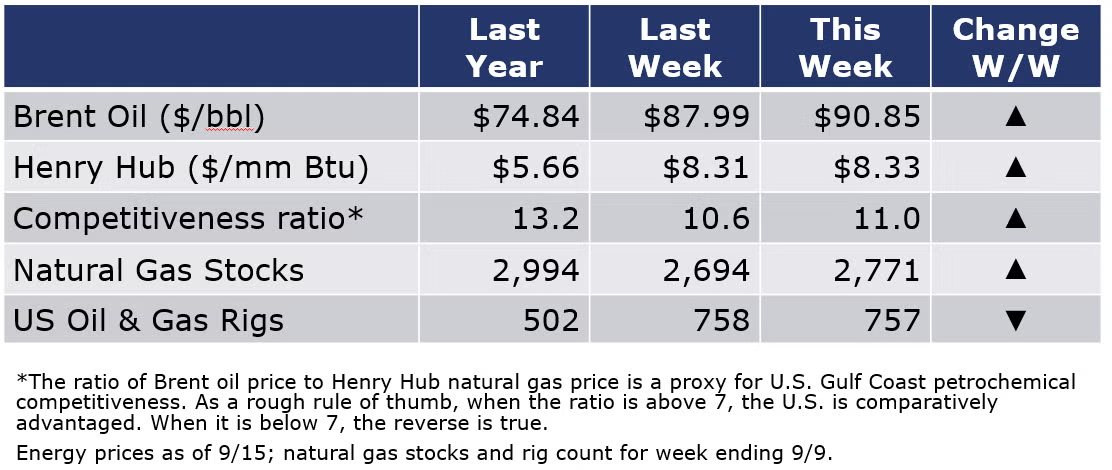
Energy prices ended up higher than a week ago, but both oil and natural gas prices had been higher earlier in the week. Oil prices moved lower today following an announcement by the Energy Department that its plan to refill the Strategic Petroleum Reserve likely won’t begin until after fiscal year 2023 and a lower oil demand forecast from IEA. And natural gas prices, which had jumped earlier in the week as the potential rail strike threatened deliveries of coal to power plants, also eased later in the week. The combined oil and rig count edged lower by one to 757 during the week ending 9/9, but at 166, the number of active natural gas rigs returned to pre-pandemic levels.
For the business of chemistry, the indicators still bring to mind a yellow banner for basic and specialty chemicals.
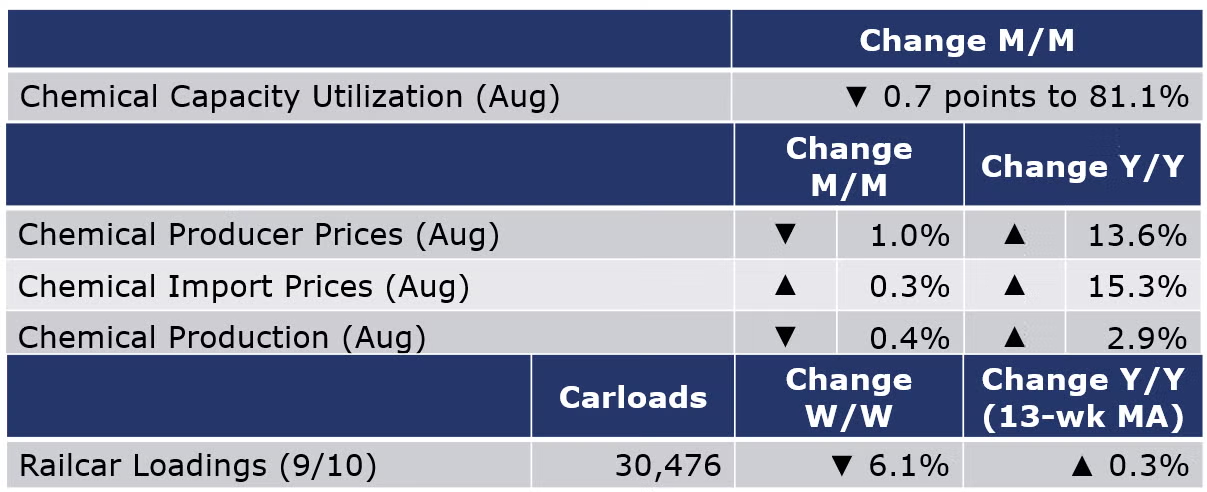
According to data released by the Association of American Railroads, chemical railcar loadings were down 6.1% to 30,476 during the week ending 10 September, in anticipation of a potential rail strike. Loadings were up 0.3% Y/Y (13-week MA). Loadings were up 3.6% YTD/YTD and have been on the rise for six of the last 13 weeks.
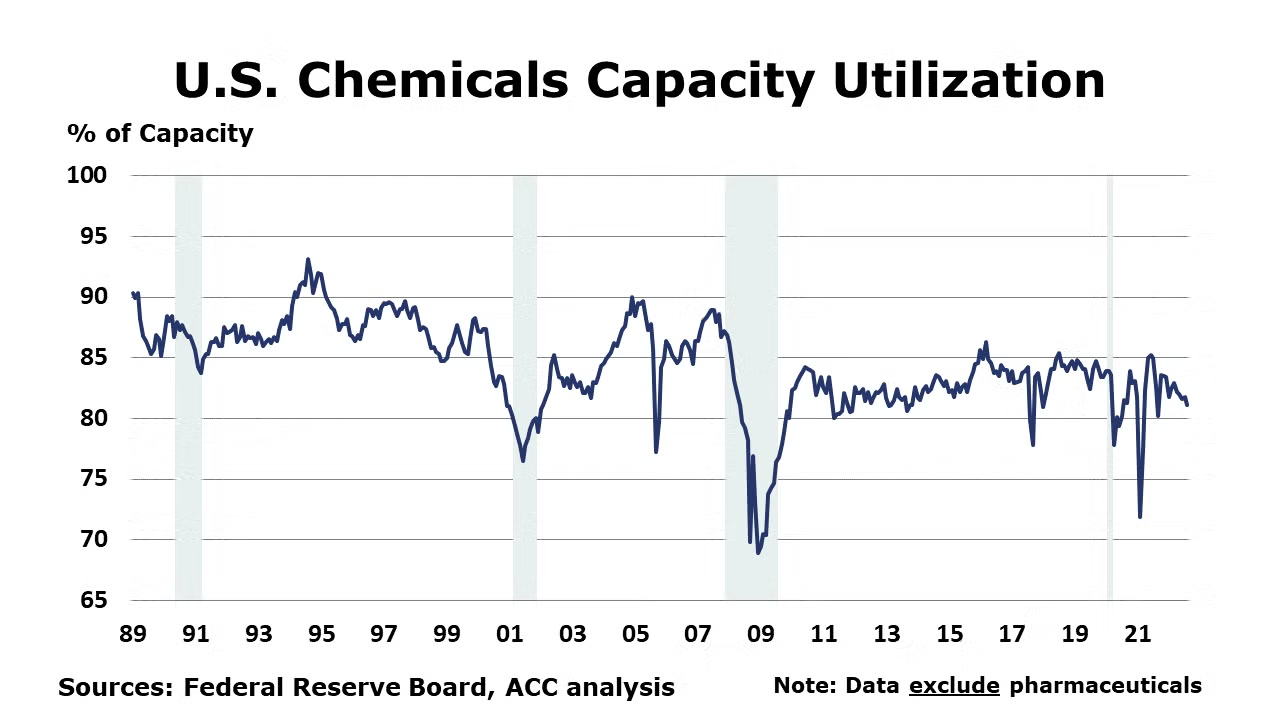
Following a 0.6% gain in July, chemical production fell 0.4% in August. Performance was mixed with gains in the output of consumer products, coatings, adhesives, and other specialty chemicals that were offset by declines in organic and inorganic chemicals, plastic resins, synthetic rubber, manufactured fibers, fertilizers and crop protection chemicals. Compared to a year ago, production remained ahead by 2.9% Y/Y. Chemical capacity utilization fell 0.7 percentage points to 81.1%, lower than a year ago when capacity utilization was 82.6%.
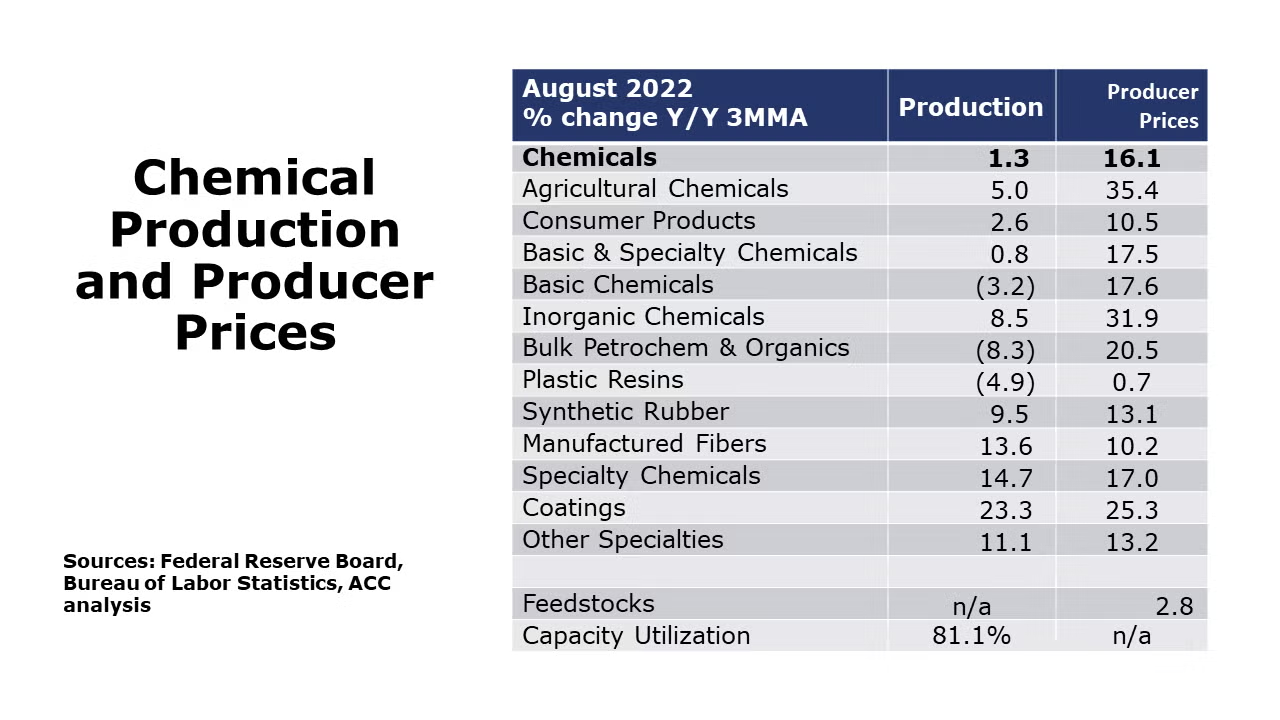
Following more than two years of consecutive gains, producer prices for chemicals fell for a second month, down 1.0%. Gains in prices for consumer products, coatings, other specialty chemicals, inorganic chemicals, and synthetic rubber were more than offset by declines in prices for plastic resins, organic chemicals, agricultural chemicals and manufactured fibers. Compared to a year ago, chemical prices were up 13.6% Y/Y.
Chemical import prices rose 0.3% in August and were up 15.3% Y/Y. Chemical export prices fell 3.4% and were up 4.6% Y/Y.
Note On the Color Codes
The banner colors represent observations about the current conditions in the overall economy and the business chemistry. For the overall economy we keep a running tab of 20 indicators. The banner color for the macroeconomic section is determined as follows:
Green – 13 or more positives
Yellow – between 8 and 12 positives
Red – 7 or fewer positives
For the chemical industry there are fewer indicators available. As a result we rely upon judgment whether production in the industry (defined as chemicals excluding pharmaceuticals) has increased or decreased three consecutive months.
For More Information
ACC members can access additional data, economic analyses, presentations, outlooks, and weekly economic updates through MemberExchange.
In addition to this weekly report, ACC offers numerous other economic data that cover worldwide production, trade, shipments, inventories, price indices, energy, employment, investment, R&D, EH&S, financial performance measures, macroeconomic data, plus much more. To order, visit https://store.americanchemistry.com/.
Every effort has been made in the preparation of this weekly report to provide the best available information and analysis. However, neither the American Chemistry Council, nor any of its employees, agents or other assigns makes any warranty, expressed or implied, or assumes any liability or responsibility for any use, or the results of such use, of any information or data disclosed in this material.
Contact us at ACC_EconomicsDepartment@americanchemistry.com

