Running tab of macro indicators: 11 out of 20
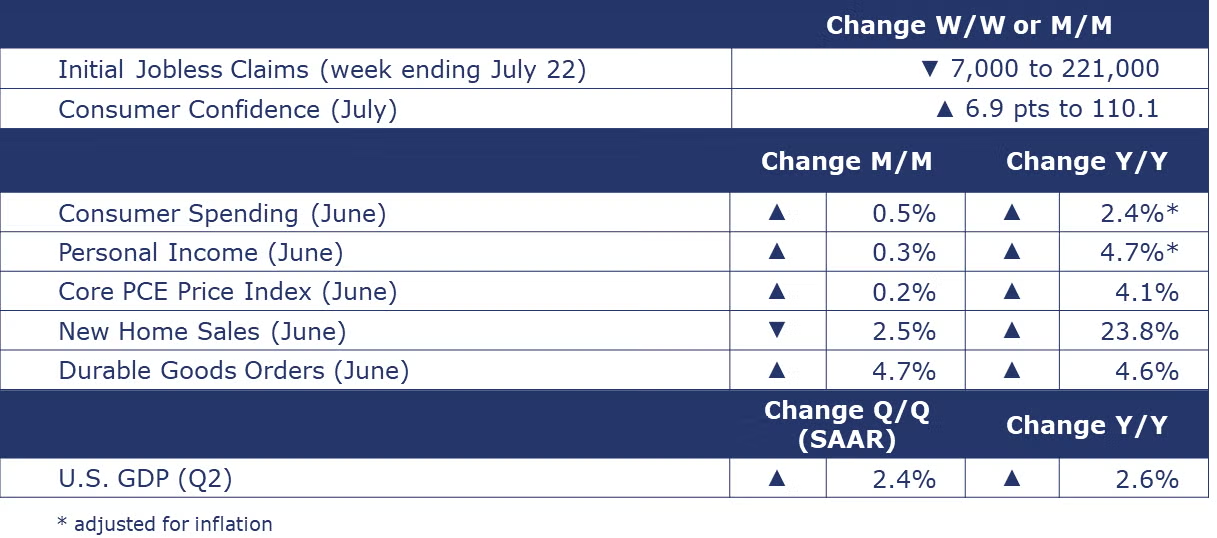
The number of new jobless claims fell by 7,000 to 221,000 during the week ending July 22. Continuing claims fell by 59,000 to 1.69 million, and the insured unemployment rate declined by 0.1 percentage point to 1.1% for the week ending July 15.
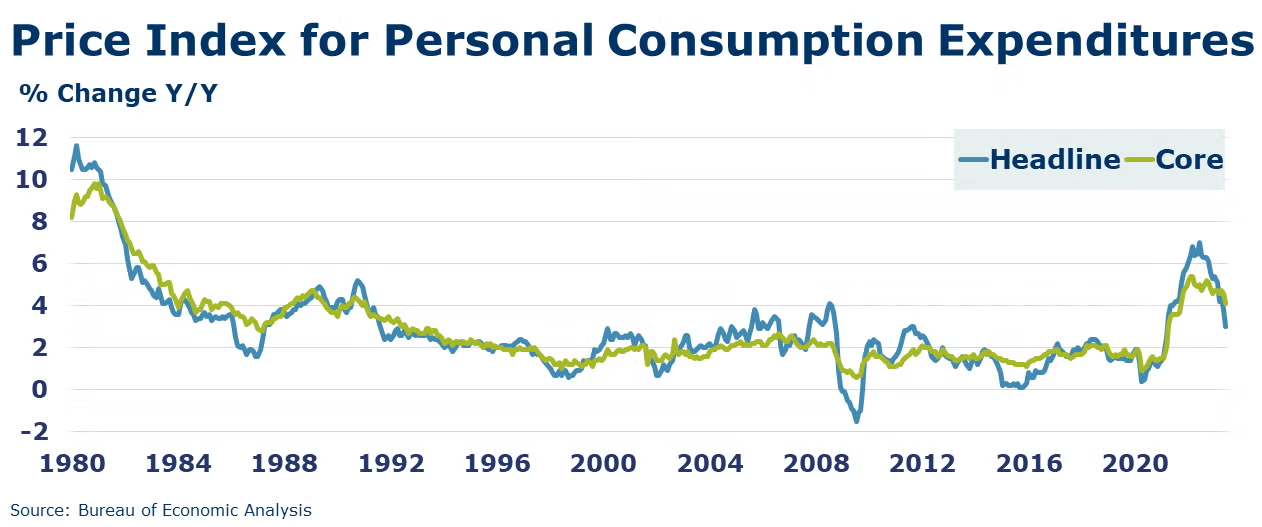
Consumer spending accelerated in June, up by 0.5%. Even after adjusting for inflation, consumer spending rose at the fastest pace since January. Spending on goods rose, but the largest contributor was spending on services. Aggregate personal income (the spending power in the economy) rose 0.3%. Recent gains in income have exceeded the pace of inflation, yielding real income growth that continues to support spending. The price index for personal consumption expenditures (PCE) continued to edge higher month-on-month, but the year earlier comparisons continued to improve. The headline PCE index rose 3.0% Y/Y and the core index (excluding food & energy) was 4.1% higher than a year ago. The core PCE price index is the inflation measure that the Fed is targeting. It’s looking for the PCE price index to be running at about 2% per year, well below the current pace of inflation.
The Conference Board Consumer Confidence Index® rose to 117.0 in July, up from 110.1 in June. Consumers’ assessment of present economic and labor market conditions increased, as did their expectations for the short-term outlook. The Expectations Index—based on consumers’ short-term outlook for income, business, and labor market conditions—improved to 88.3 (1985=100) from 80.0 in June. Importantly, Expectations climbed well above 80—the level that historically signals a recession within the next year. Considering their family’s current financial situation, 31.6% of consumers say it’s “good,” while 17.6% say it’s “bad”. Looking ahead six months, 31.1% of consumers expect their family finances to be better, while 13.6% expect their situation to be worse. Their outlook on the labor market improved, but expectations for short-term income prospects worsened. Consumers’ “Perceived Likelihood of a US Recession over the Next 12 Months” ticked up in July but remained below the recent peak earlier in the year. Plans for travel and vacation spending slowed but increased for healthcare and streaming services.
After three months of positive growth, new home sales in June declined by 2.5%. Sales activity rose in the Northeast and South but declined in the Midwest and West. Inventories of new homes available for sale declined. New home inventories rose from a 7.2-month supply in May to a 7.4-month supply in June. With extremely low inventories of existing homes due to homeowners’ reluctance to give up low mortgage rates, interest in new homes remained strong. New home sales were up 23.8% Y/Y.
New orders for manufactured durable goods rose 4.7% to $302.5 billion in June, marking a fourth consecutive month in gains. Transportation equipment, specifically nondefense aircraft and parts led the increase. Core business orders (nondefense capital goods excluding aircraft) rose by a more modest 0.2%.
The Kansas City Fed’s July survey of manufacturing activity in the upper Midwest remained negative, with overall activity changing little since June. All indexes remained negative except for the number of employees and prices paid for raw materials. The six-month outlook remained flat and near zero. Compared to one year ago, most respondents see supply chain issues slightly or much better.
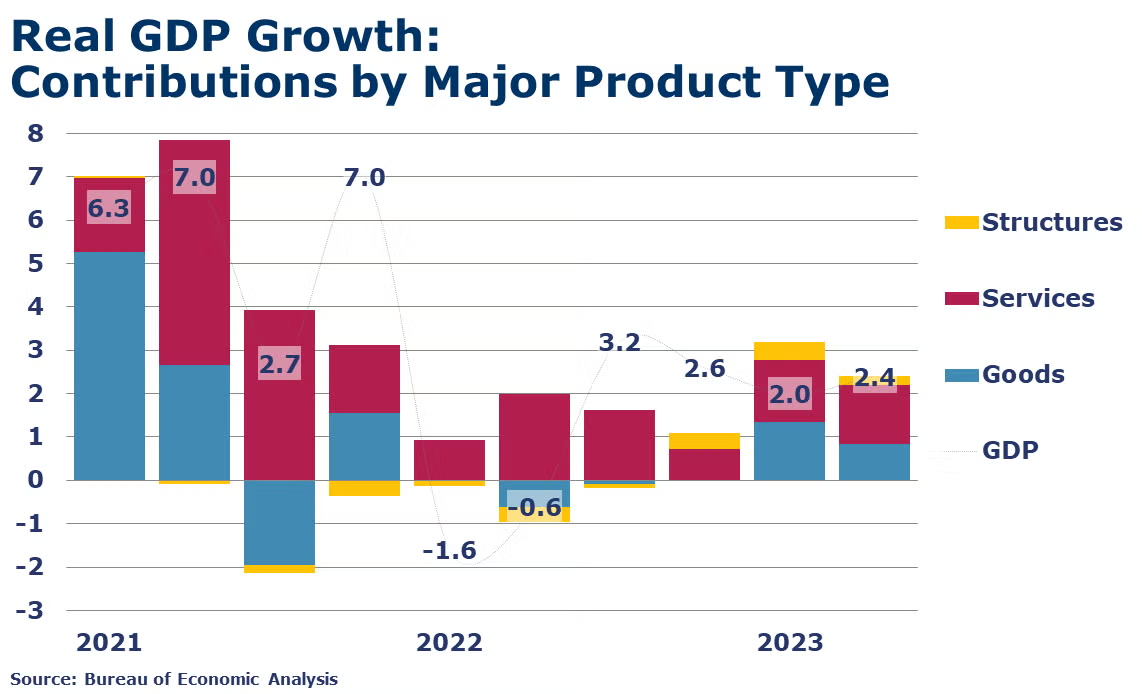
Q2 GDP accelerated at a 2.4% pace according to the first of three estimates from the Bureau of Economic Analysis. Growth was driven by increased consumer spending on services and nonresidential fixed investment in structures and equipment, in particular. Residential investment continued to slide. Consumer spending on goods slowed considerably. There was a small contribution from inventory investment and a small negative contribution from trade. Compared to a year ago, real GDP was up 2.6%. The price index for gross domestic purchases slowed from a 5.1% Y/Y pace to 4.0% Y/Y in Q2. Excluding food and energy, the index slowed from a 5.3% Y/Y pace to 4.0% Y/Y.
After three months of growth, new home sales declined 2.5% in June. Sales activity rose in the Northeast and South but declined in the Midwest and West. Inventories of new homes available for sale declined. New home inventories rose from a 7.2-month supply in May to a 7.4-month supply in June. With extremely low inventories of existing homes due to homeowners’ reluctance to give up low mortgage rates, interest in new homes remained strong. New home sales were up 23.8% Y/Y.
The Conference Board Consumer Confidence Index® rose to 117 in July (from 110.1 in June). Consumers’ assessment of present economic and labor market conditions increased, as did their expectations for the short-term outlook. The Expectations Index—based on consumers’ short-term outlook for income, business, and labor market conditions—improved to 88.3 (1985=100) from 80.0 in June. Importantly, expectations climbed well above 80—the level that historically signals a recession within the next year. Considering their family’s current financial situation, 31.6% of consumers say it’s “good,” while 17.6% say it’s “bad”. Looking ahead six months, 31.1% of consumers expect their family finances to be better, while 13.6% expect their situation to be worse. Their outlook on the labor market improved, but expectations for short-term income prospects worsened. Consumers’ Perceived Likelihood of a US Recession over the Next 12 Months ticked up in July but remained below the recent peak earlier in the year. Plans for travel and vacation spending slowed but increased for healthcare and streaming services.
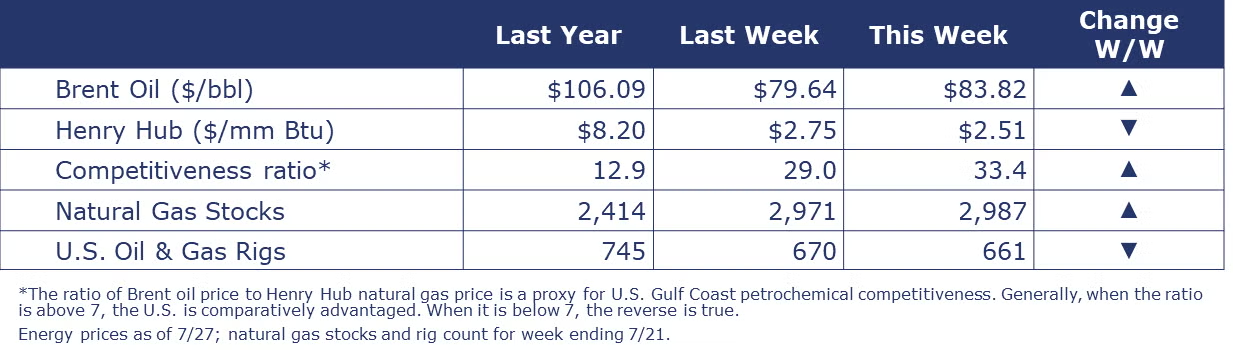
Oil prices continued to move higher this week as production cuts from OPEC+ are starting to have an impact. At the same time, a stronger-than-expected estimate for Q2 GDP suggests continued resilience in the U.S. economy going into Q3. U.S. natural gas prices eased compared to a week ago. Natural gas inventories were nearly 24% higher than a year ago. There are abundant inventories going into the end of July when cooling demand peaks. The combined oil and gas rig count continued to decline, down by nine to 661.
Indicators for the business of chemistry bring to mind a red banner.
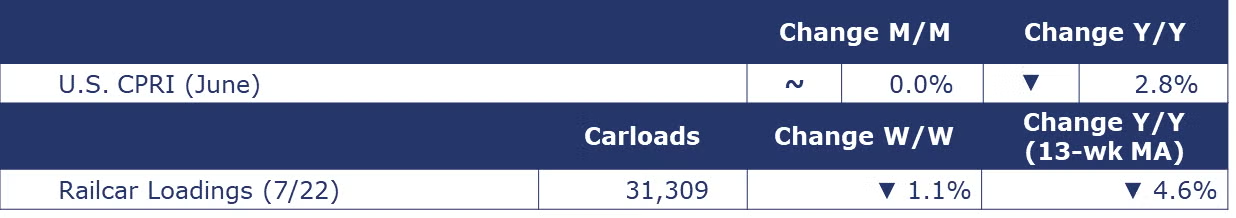
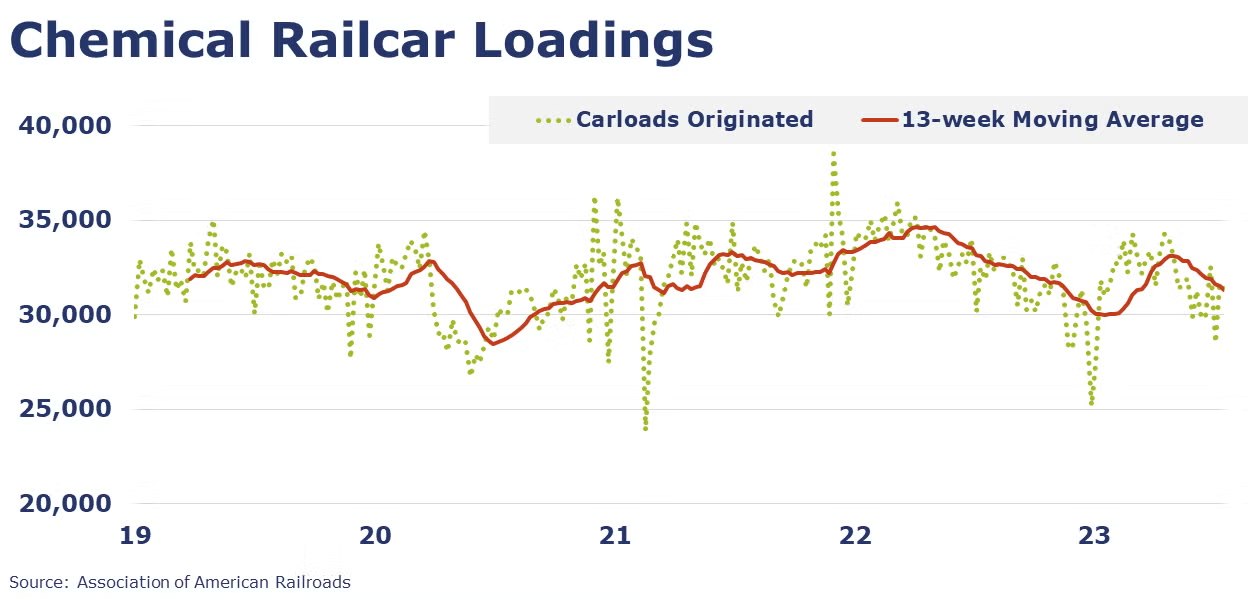
According to data released by the Association of American Railroads, chemical railcar loadings were down 1.1% to 31,309 for the week ending July 22. Loadings were down 4.6% Y/Y (13-week MA), down 4.2% YTD/YTD and have been on the rise for 8 of the last 13 weeks.
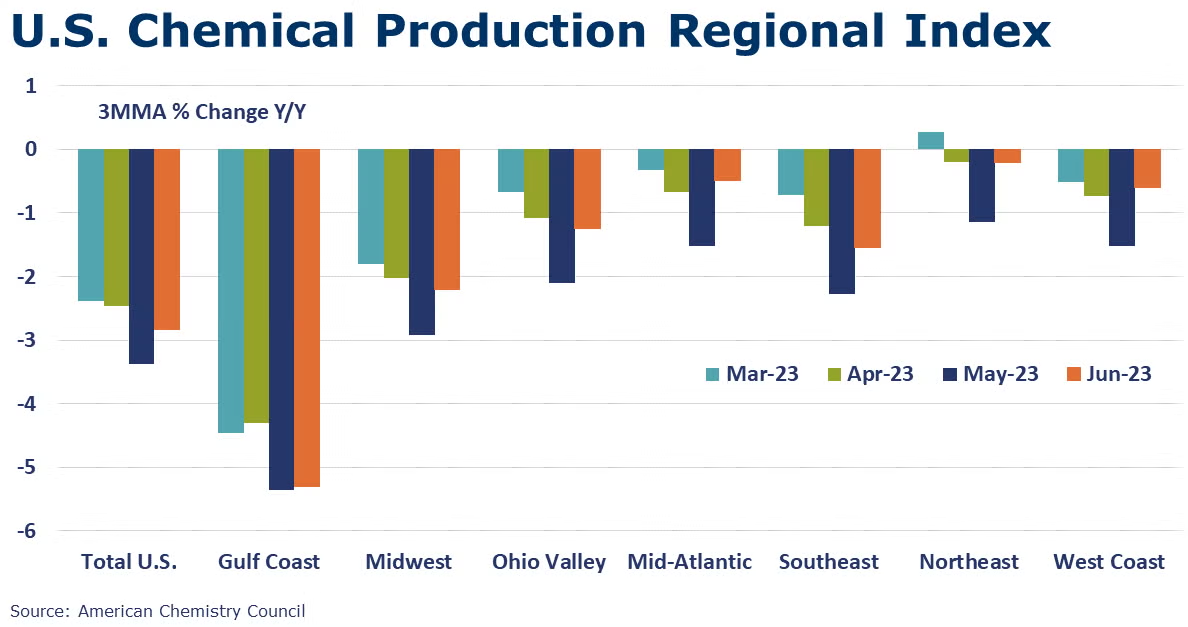
ACC’s U.S. Chemical Production Regional Index (U.S. CPRI) was flat in June, following a 0.9% decline in May. The U.S. CPRI, measured on a 3MMA basis to reduce month-to-month volatility, indicates ongoing weakness in the Gulf Coast was offset by gains across all other regions. Increased output of coatings, adhesives, other specialty chemicals, fertilizers, crop protection chemicals, and consumer products was offset by lower production of organic and inorganic chemicals, plastic resins, synthetic rubber, and manufactured fibers.
Note On the Color Codes
The banner colors represent observations about the current conditions in the overall economy and the business chemistry. For the overall economy we keep a running tab of 20 indicators. The banner color for the macroeconomic section is determined as follows:
Green – 13 or more positives
Yellow – between 8 and 12 positives
Red – 7 or fewer positives
For the chemical industry there are fewer indicators available. As a result, we rely upon judgment whether production in the industry (defined as chemicals excluding pharmaceuticals) has increased or decreased three consecutive months.
For More Information
ACC members can access additional data, economic analyses, presentations, outlooks, and weekly economic updates through ACCexchange.
In addition to this weekly report, ACC offers numerous other economic data that cover worldwide production, trade, shipments, inventories, price indices, energy, employment, investment, R&D, EH&S, financial performance measures, macroeconomic data, plus much more. To order, visit http://store.americanchemistry.com/.
Every effort has been made in the preparation of this weekly report to provide the best available information and analysis. However, neither the American Chemistry Council, nor any of its employees, agents or other assigns makes any warranty, expressed or implied, or assumes any liability or responsibility for any use, or the results of such use, of any information or data disclosed in this material.
Contact us at ACC_EconomicsDepartment@americanchemistry.com.