Running tab of macro indicators: 12 out of 20
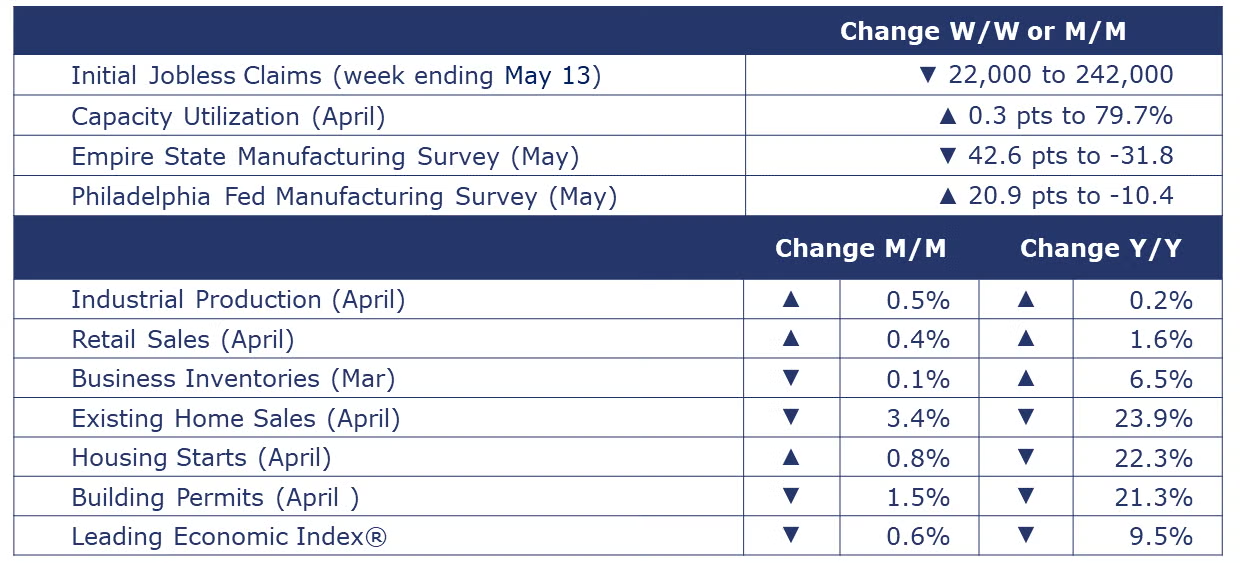
The number of new jobless claims declined by 22,000 to 242,000 during the week ending May 13. Continuing claims decreased by 8,000 to 1.79 million, and the insured unemployment rate for the week ending May 6 was 1.2, unchanged from the previous week.
Following declines in February and March, nominal retail and food service sales rose by 0.4% in April. Sales were mixed among segments with higher sales at motor vehicle & parts dealers, health & beauty stores, building materials & garden centers, nonstore retailers (i.e., online platforms) and restaurants. Offsetting those gains were lower sales at retailers of furniture & home furnishings, electronics and appliances, food and beverage, gas stations, clothing, and sporting goods. Compared to a year ago, retail sales were ahead by 1.6% Y/Y. Factoring in inflation, spending was lower than a year ago as consumers pull back.
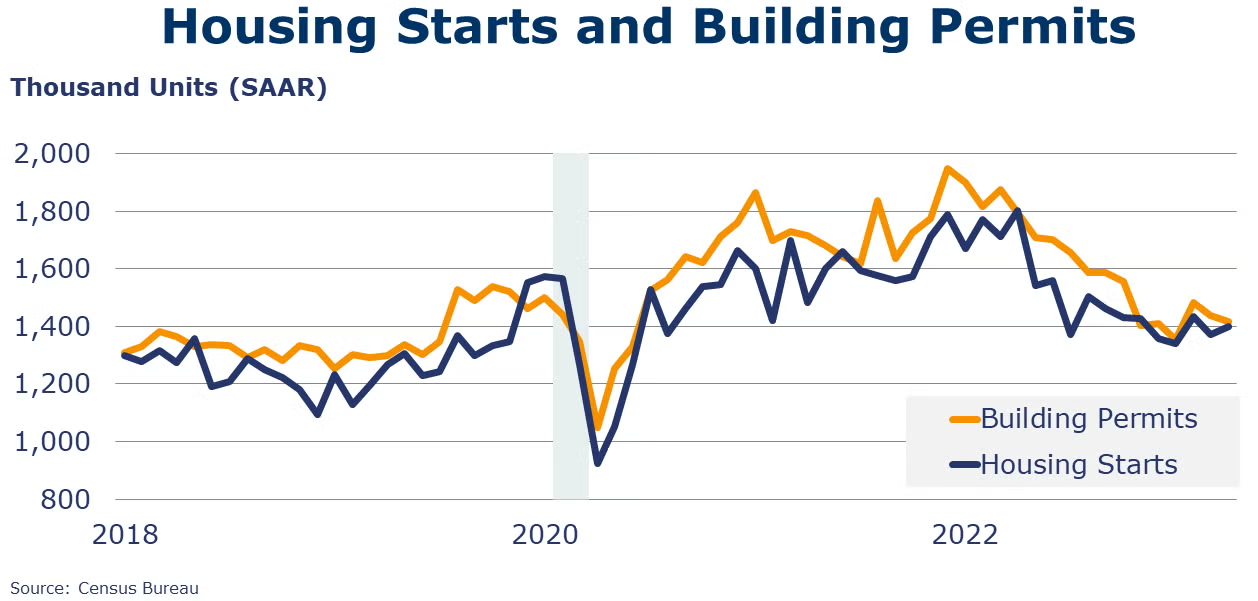
Seasonally adjusted housing starts rose in April, by 0.8%. Chemistry-intensive single family starts, however, were up by 1.6% compared to the previous month. After a strong February, forward-looking building permits were down 1.5% in April, but single‐family authorizations were up by 3.1%. Permits for buildings with five or more units fell by 9.7%. Both starts and permits remained sharply lower than a year ago. According to data from the National Association of Realtors®, existing-home sales fell 3.4% in April to 4.28 million; this is down 23.9% Y/Y. Existing homes inventory was up M/M (7.2%), or the equivalent of 2.9 months' supply at the current monthly sales pace. Existing home prices fell 1.7% Y/Y, the sharpest decline in years.
Homebuilder confidence jumped by five points to 50 in May, the highest reading since last July. It was also the first time in nearly a year that the reading pulled out of negative territory. There was improvement among all three components, including current sales, sales expectations, and buyer traffic.
Business inventories were 0.1% lower at the end of March (compared to February) and 6.5% higher than they were at the end of March 2022. Inventories increased at the retail and wholesale levels but were drawn down in manufacturing. Combined business sales were down 1.1% as wholesale sales declined 2.1%, retail sales declined 0.8%, and manufacturers’ sales fell 0.1% in March. Compared to a year earlier, sales were down by 0.3% with retailers leading the decline at -2.9%. The inventories-to-sales ratio was 1.39 in March compared to 1.38 in February. A year ago, the ratio was 1.30.
Signaling a worsening economic outlook, the Conference Board’s Leading Economic Index® fell for an 13th consecutive month in April, down by another 0.6%. Weaknesses among underlying components were widespread—but less so than in March’s reading. The LEI is down by 4.4% over the previous six months and down 9.5% from a year ago. The Conference Board forecasts a contraction of economic activity starting in Q2, leading to a mild recession by mid-2023.
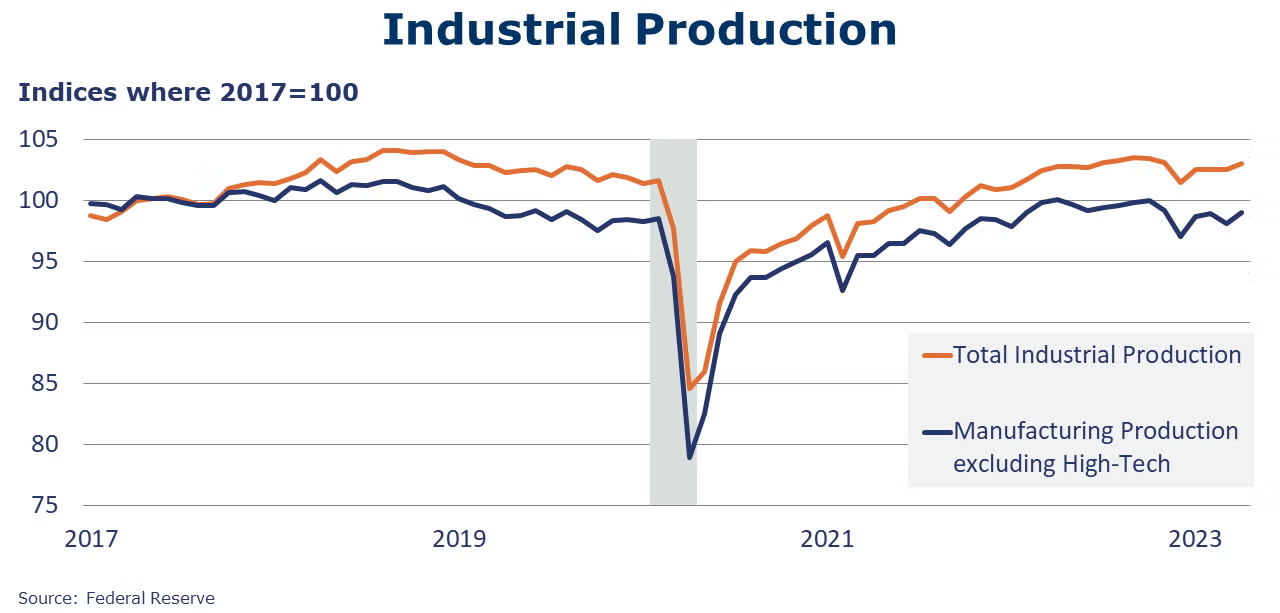
U.S. industrial output rose by 0.5% in April following two months of flat growth. The headline industrial production, at 103.0, was just above the levels a year prior. Manufacturing production was up 1.0%, driven by strong growth in motor vehicles and parts. Light vehicle assemblies rose to an 11.1-million-unit annual pace, the highest since August 2020. Most major market groups recorded growth in April. Gains were notable in computer and electronics products and plastics and rubber products. The largest production decline was in miscellaneous manufacturing. Mining output was up 0.6% in April while utilities declined. Capacity utilization rose to 79.7% and was 1.5% higher than a year earlier.
Manufacturers’ business conditions deteriorated in New York state in May, according to the April Empire State Manufacturing Survey. The business conditions index plunged 42.6 points in May, landing in negative territory at -31.8. During May, there were declines in shipments, new orders, and unfilled orders. Manufacturers worked down inventories. Pressures on prices paid and received remain. Labor counts contracted and so did average hours worked. Manufacturers continue to be optimistic overall about business conditions looking forward six months. Optimism is waning in some areas, however. Capital spending and tech spending plans are flattening. Manufacturing business activity in eastern Pennsylvania and southern New Jersey decreased in May, the ninth consecutive negative reading according to the Philadelphia Fed’s Manufacturing Business Outlook Survey. According to the survey, general activity, new orders, and shipments remained negative but higher than last month. Employment was also negative for the third consecutive month. The future general activity index—reflecting forward-looking (6-month) activity--declined for the third straight month.
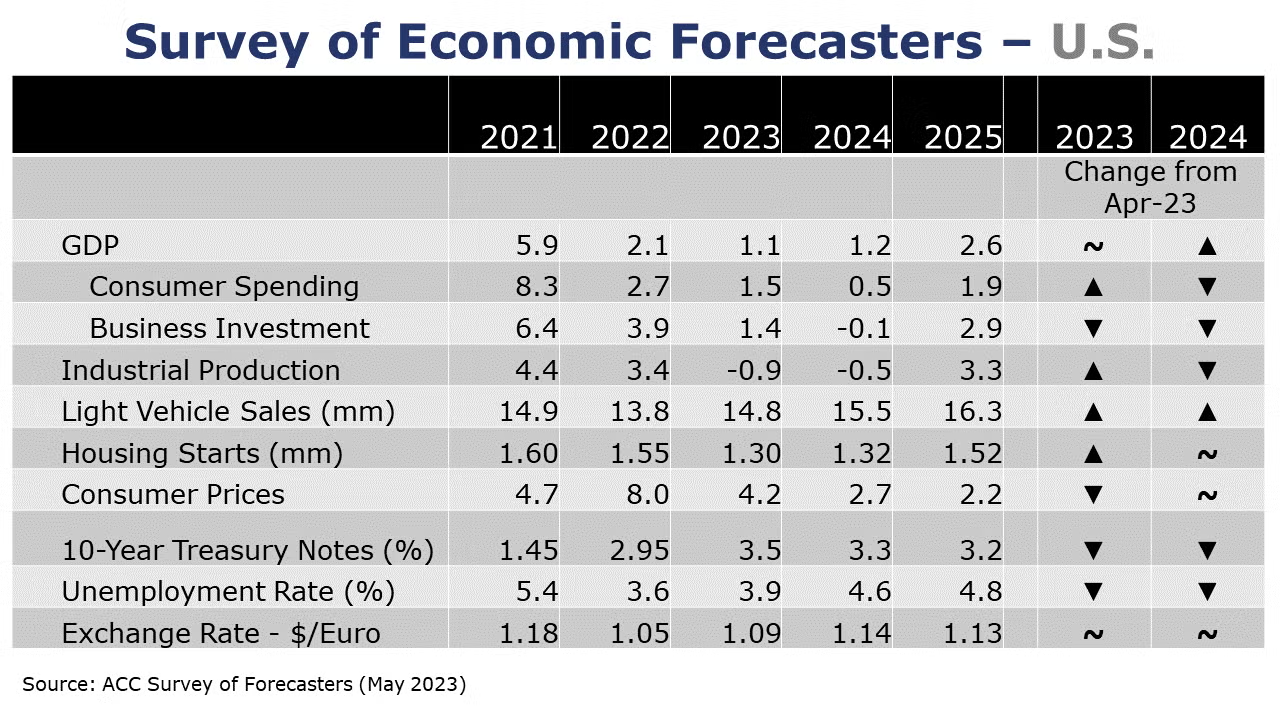
SURVEY OF ECONOMIC FORECASTERS – MAY 2023
- Halfway through Q2, signs of weakness persist and suggest a downturn in the U.S. economy in the near-term. A short, mild recession is expected to emerge in the second half of the year.
- With the delayed downturn, growth prospects for 2024 continue to deteriorate for consumer spending, business investment, and industrial production.
- U.S. GDP is expected to grow by a modest 1.1% in 2023 and essentially the same (+1.2%) in 2024.
- Consumer spending growth is expected to slow to a 1.5% Y/Y pace in 2023 and slow further to a 0.5% gain in 2024.
- Dampened by higher borrowing costs, growth in business investment is also expected to decelerate to a 1.4% pace in 2023 before slipping by 0.1% in 2024.
- The deterioration in industrial production, that began in late-2022 is expected to continue through the start of 2024. Industrial production is expected to contract by 0.9% in 2023 and ease a further 0.5% in 2024.
- Vehicle production is a relatively bright spot in an otherwise lackluster outlook. With supply chain issues largely resolved, dealer inventories and assemblies have expanded, though higher borrowing costs and uncertainty will be headwinds. As a result, sales of autos and light trucks are expected to grow to 14.8 million in 2023 (still below trend) and 15.5 million in 2024.
- Home-building, however, continues to struggle as higher mortgage rates and high home prices dampen demand. Housing starts are expected to come in at 1.30 million in 2023, before edging higher to 1.32 million in 2024.
- The unemployment rate is expected to move higher from 50-year lows to average 3.9% in 2023 and 4.6% in 2024.
- Following an 8.0% surge in consumer prices in 2022, growth in consumer prices is expected to decelerate to a 4.2% pace in 2023 and 2.7% in 2024.
- Compared to last month, expectations for interest rates (10-year Treasury) were lower, reflecting recent bank turmoil and recession concerns.
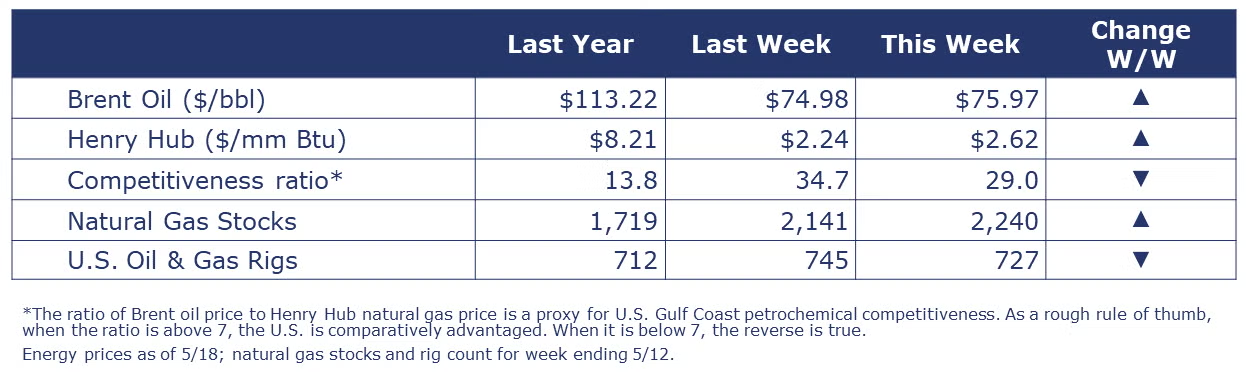
Oil prices moved up during the week as Canadian wildfires disrupted production, but concerns about debt ceiling talks tempered those gains. U.S. natural gas prices moved higher compared to last Thursday. The combined rig count fell by 18 at the end of last week, with much of the decline in the number of gas rigs. The number of active gas rigs has fallen from 162 to 141 over the past seven weeks.
Indicators for the business of chemistry bring to mind a yellow banner.
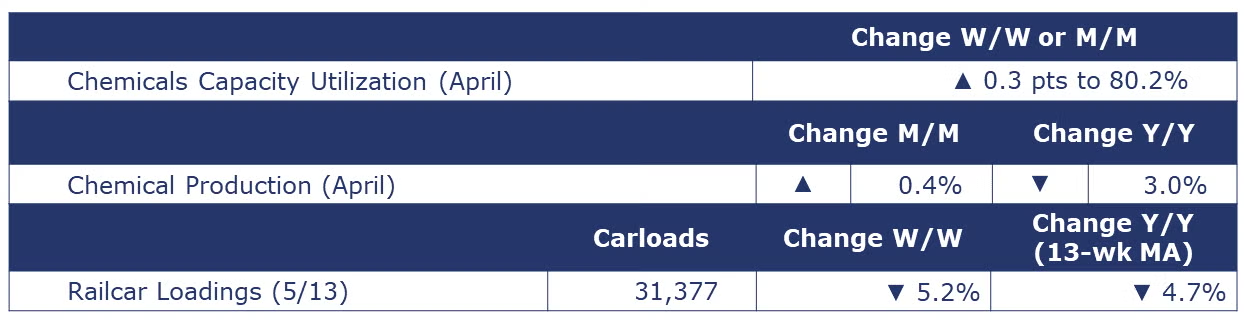
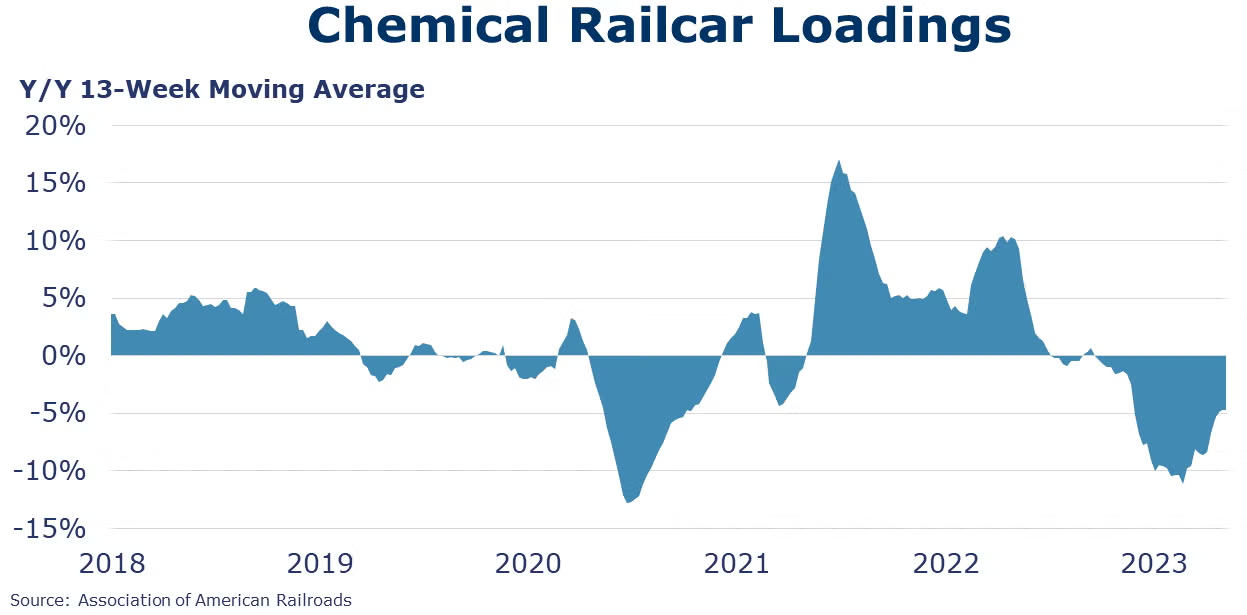
According to data released by the Association of American Railroads, chemical railcar loadings were down by 1,707 cars to 31,377 for the week ending 13 May. Loadings were down 4.7% Y/Y (13-week MA), down (-5.8%) YTD/YTD and have been on the rise for seven of the last 13 weeks.
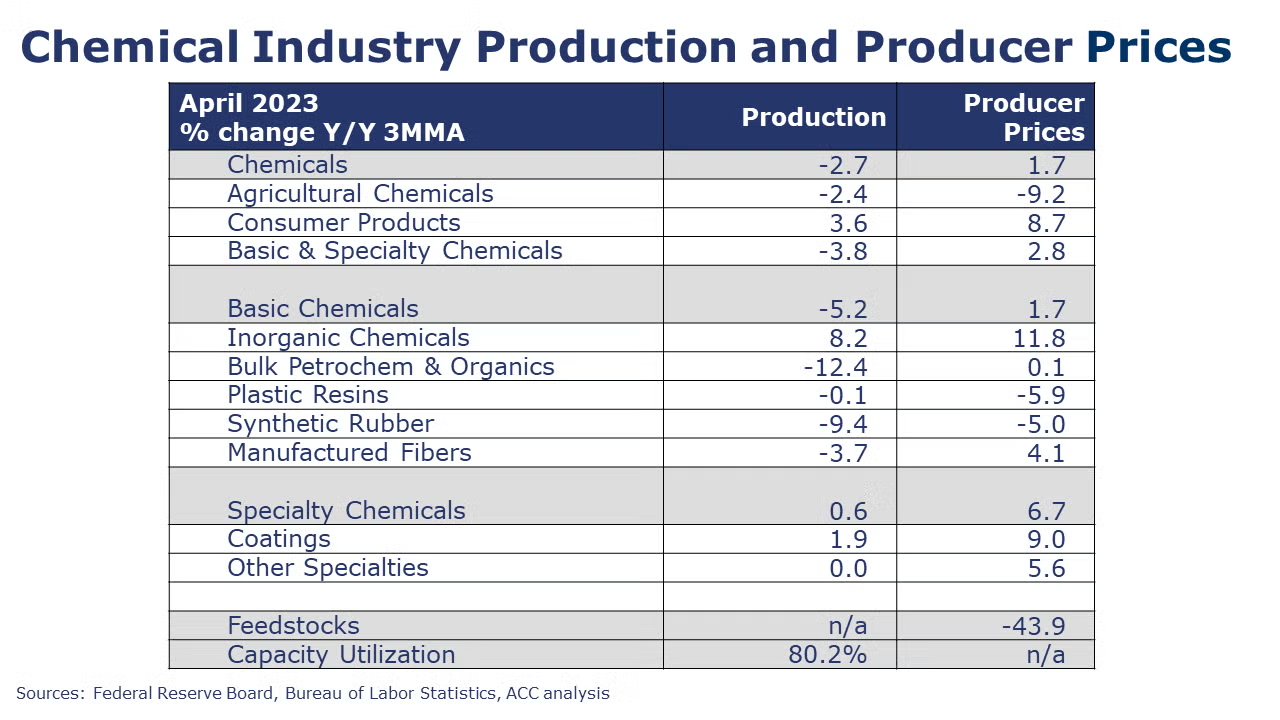
Chemical production rose by 0.4% in April. There were gains in agricultural chemicals and consumer products, a small decline in specialties and no growth in basic chemicals. Within basic chemicals, gains in the production of inorganic chemicals and plastic resins offset declines in the output of organic chemicals and other synthetic materials. Capacity utilization tightened in April, up to 80.2%. Both production and capacity utilization were below year ago levels.
Note On the Color Codes
The banner colors represent observations about the current conditions in the overall economy and the business chemistry. For the overall economy we keep a running tab of 20 indicators. The banner color for the macroeconomic section is determined as follows:
Green – 13 or more positives
Yellow – between 8 and 12 positives
Red – 7 or fewer positives
For the chemical industry there are fewer indicators available. As a result, we rely upon judgment whether production in the industry (defined as chemicals excluding pharmaceuticals) has increased or decreased three consecutive months.
For More Information
ACC members can access additional data, economic analyses, presentations, outlooks, and weekly economic updates through ACCexchange.
In addition to this weekly report, ACC offers numerous other economic data that cover worldwide production, trade, shipments, inventories, price indices, energy, employment, investment, R&D, EH&S, financial performance measures, macroeconomic data, plus much more. To order, visit http://store.americanchemistry.com/.
Every effort has been made in the preparation of this weekly report to provide the best available information and analysis. However, neither the American Chemistry Council, nor any of its employees, agents or other assigns makes any warranty, expressed or implied, or assumes any liability or responsibility for any use, or the results of such use, of any information or data disclosed in this material.
Contact us at ACC_EconomicsDepartment@americanchemistry.com.

