Running tab of macro indicators: 8 out of 20
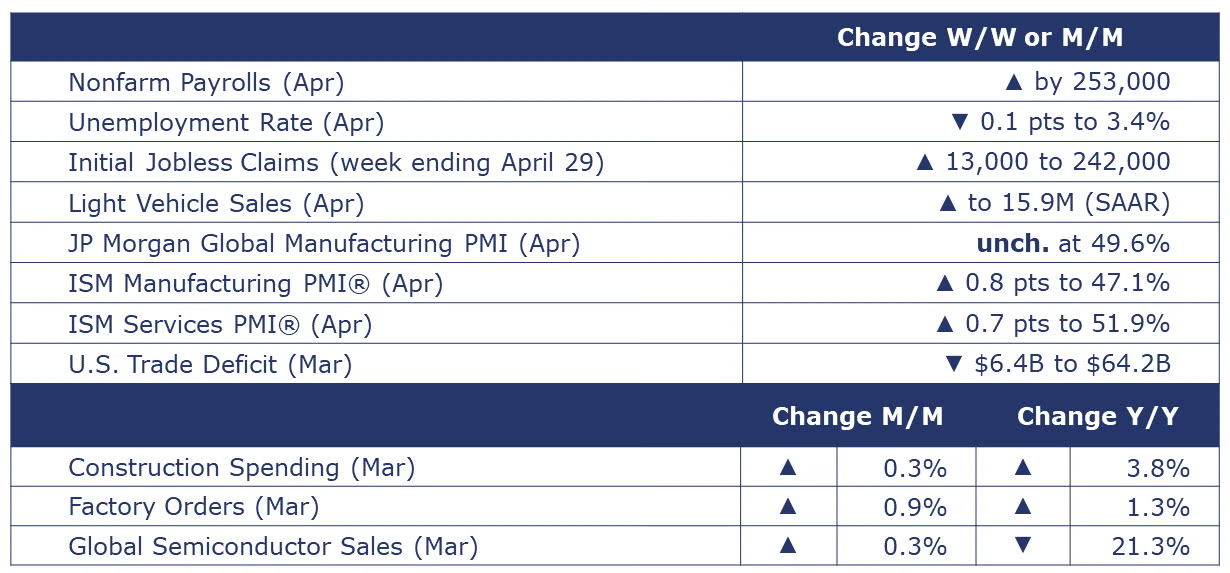
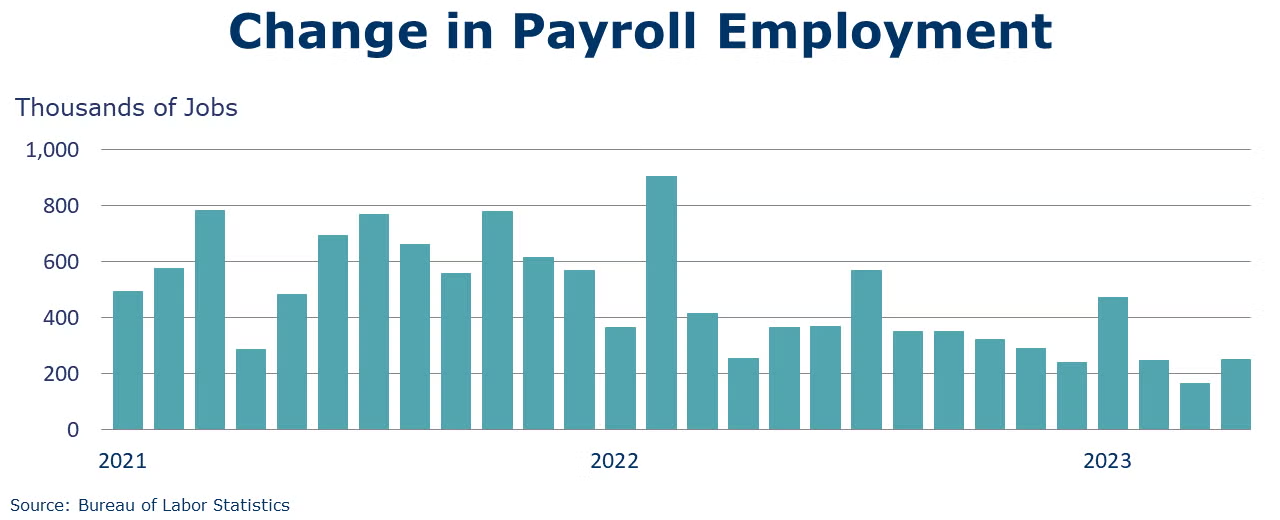
Once again, the gain in payroll employment exceeded expectations, rising by 253,000 in April. Employment continued to trend higher, led by gains in professional and business services, health care, leisure and hospitality, and social assistance. Manufacturing employment expanded by 11,000 following a contraction in March. Average hourly earnings of all employees were up 4.4% Y/Y, faster than last month’s 4.3% Y/Y gain. From the separate household survey, the unemployment rate fell 0.1 points to 3.4%, the lowest since May 1969! The civilian labor force edged slightly lower but was offset by a larger decline in the number of unemployed people. The resilient labor market creates challenges for the Fed as it tries to cool persistent inflation, fed in part by a tight labor supply.
New jobless claims rose by 13,000 to 242,000 during the week ending 29 April. Continuing claims fell by 38,000 to 1.8 million, and the insured unemployment rate for the week ending 22 April was down slightly at 1.2%.
Job openings continued to ease in March, down nearly 400,000 to 9.59 million, the lowest level since May 2021. In March, there were 1.6 unemployed people for every job opening, down nearly 2.0 in December. Comparing the number of jobs available in the economy to the number of workers able and willing to do them, there remains a large, but declining, gap of 3.75 million. This suggests that while the labor market may be starting to cool, it remains historically tight.
Construction spending increased 0.3% in March to a level up 3.8% Y/Y. Residential construction was down 0.2%. Spending on multi-family home construction rose 0.4% while spending on chemistry-intensive single family home construction fell 0.8%. Higher non-residential spending (up 1.0%) was influenced by a 4.6% increase in manufacturing, which was up 62.5% Y/Y. Public spending on construction fell by 0.2% but was 15.0% higher Y/Y.
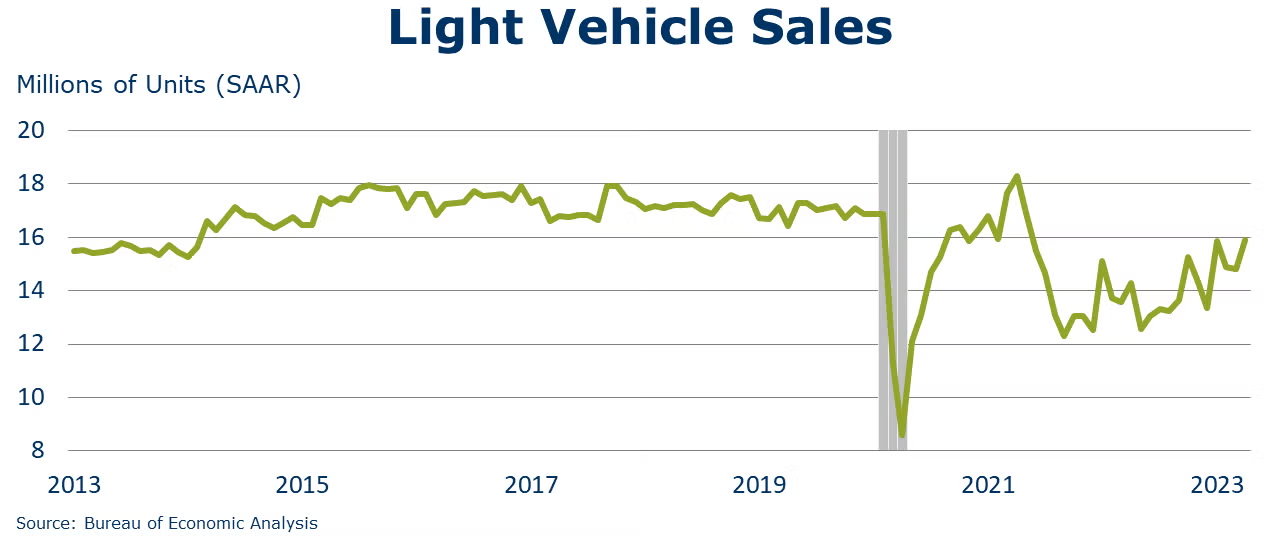
Light vehicles sales rose by 1.1 million to 15.9 million (SAAR) in April. Sales were higher in both passenger cars and light trucks. Sales were ahead of last April’s 14.3 million (SAAR) pace but remain well below pre-pandemic levels as some remaining shortages of materials and higher lending rates constrain the market.
Nominal factory orders rose 0.9% in March, following a decline in February. As reported in last week’s durable goods orders report, a surge in aircraft orders offset weaker or declining orders in many other categories. Orders for consumer goods continued to decline, as did core business orders (nondefense capital goods, excluding aircraft), which were down for the fourth month in the past five. Manufacturing shipments, which eased by 0.1%, were also skewed by strong shipments of civilian aircraft and parts. Inventory destocking accelerated with a 0.8% decline in inventories. As a result, the manufacturing inventories-to-sales ratio ticked lower from 1.49 in February to 1.48 in March.
The ISM Services PMI® rose 0.7 points to 51.9% in April, indicating continued expansion in the U.S. services sector. Except for a contraction in December, services have grown in 34 of the last 35 months. April’s expansion was largely due to higher new orders and continued improvements in capacity and logistics, which has had a positive impact on supplier performance.
The ISM Manufacturing PMI® rose 0.8 points to 47.1% in March, indicating a fifth consecutive month of contraction in the U.S. industrial sector (readings below 50 suggest contraction, readings above 50 suggest expansion). New orders were down for the eighth month, new export orders were down for the ninth month, and production was down for the fifth month. The employment index was up after two months of contraction. New order rates remain sluggish and panelists remain concerned about when manufacturing growth will resume. Panelists’ comments registered a 1-to-1 ratio regarding optimism for future growth and continuing near-term demand declines. Supply chain pressures are easing and manufacturers note reduced lead times for capital expenditure-related purchases. Price instability remains, and future demand is uncertain as companies continue to work down overdue deliveries and backlogs.
The U.S. trade deficit narrowed to $64.2 billion in March as exports of goods and services rose (+2.1%) and imports fell (0.3%). U.S. goods exports were up in March driven by higher exports of crude oil, fuel oil, natural gas liquids, natural gas and passenger cars. Capital goods imports fell with declines in semiconductors, electric apparatus, and excavating machinery. Imports of industrial supplies and materials were also down with declines in crude oil, fuel oil, other petroleum products, and organic chemicals. Consumer goods imports rose in March.
Unchanged at 49.6 in April, the J.P.Morgan Global Manufacturing PMI™ was under the 50-mark for an eighth consecutive month. A look at the report details and index components suggests employment and output increased and manufacturers worked off backlogs in April. Expanding output was largely driven by consumer goods production. Over the same period, incoming new orders declined (and at a faster rate). Deteriorating demand suggests weaker production and output in the coming months. However, businesses are reportedly optimistic about output through the coming year. Inflationary pressure are easing as are supply chain pressures – lead times are shortening.
Global semiconductor sales ticked up 0.3% in March to $39.8 billion. It is the first month-to-month increase recorded since May 2022. Sales were up in Europe, Asia-Pacific and China while down in Japan and the Americas. Compared to last March, sales were down 21.3%. SIA expects a rebound in global sales in the months ahead.
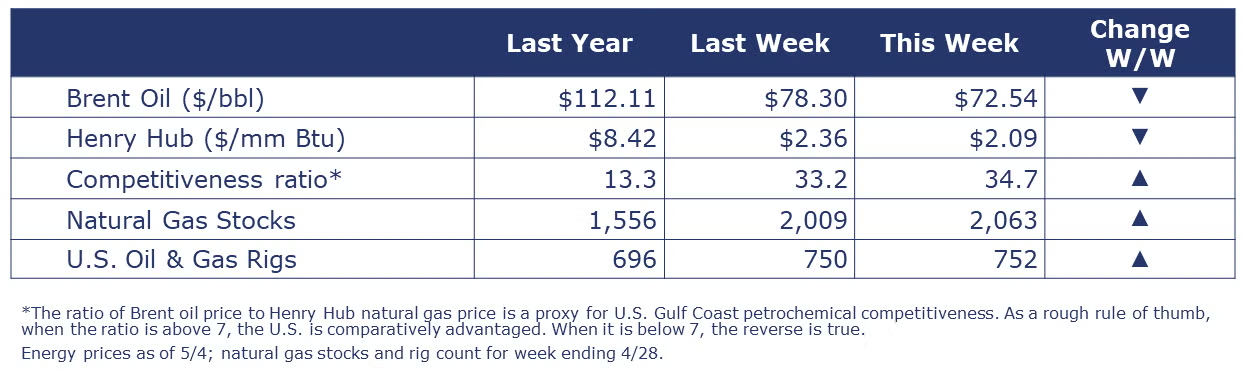
Oil prices were lower this week after another Fed rate hike and conflicting news about the durability of China’s recovery. U.S. natural gas prices remain low on record production levels and milder weather. The combined oil and gas rig count rose by two to 752.
Indicators for the business of chemistry bring to mind a yellow banner.
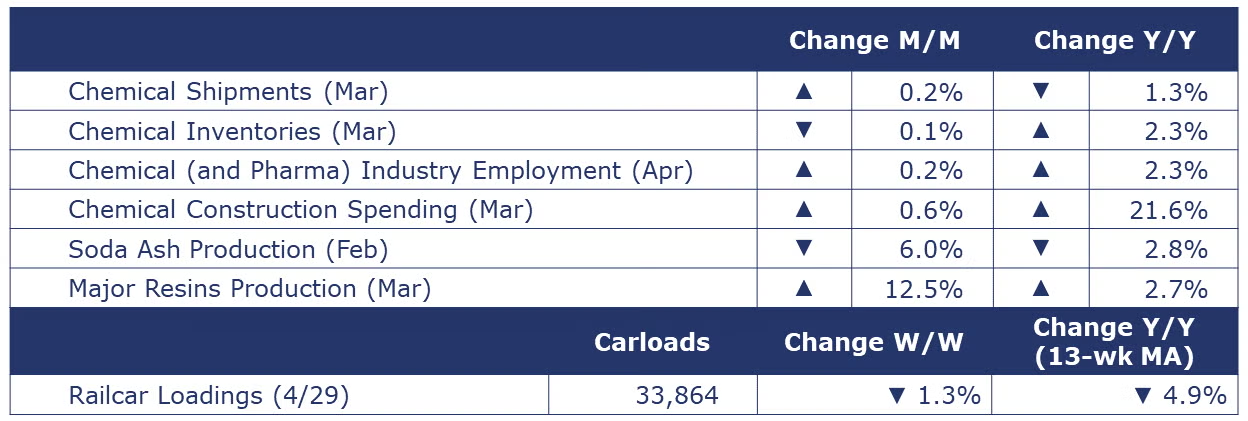
According to data released by the Association of American Railroads, chemical railcar loadings were down 1.3% to 33,864 for the week ending 29 April. Loadings were down 4.9% Y/Y (13-week MA), down 6.0% YTD/YTD and have been on the rise for 8 of the last 13 weeks.
Details of the ISM Manufacturing PMI® report suggest the chemical industry activity continued to contract through March. New orders, new exports orders and production were down in April while employment increased. Chemical manufacturers have been working off order backlogs and working down inventories. Supplier deliveries have been faster, reflecting reduced supply chain pressures. Inflationary pressures have eased as well as chemical manufacturers report declining input/raw material costs.
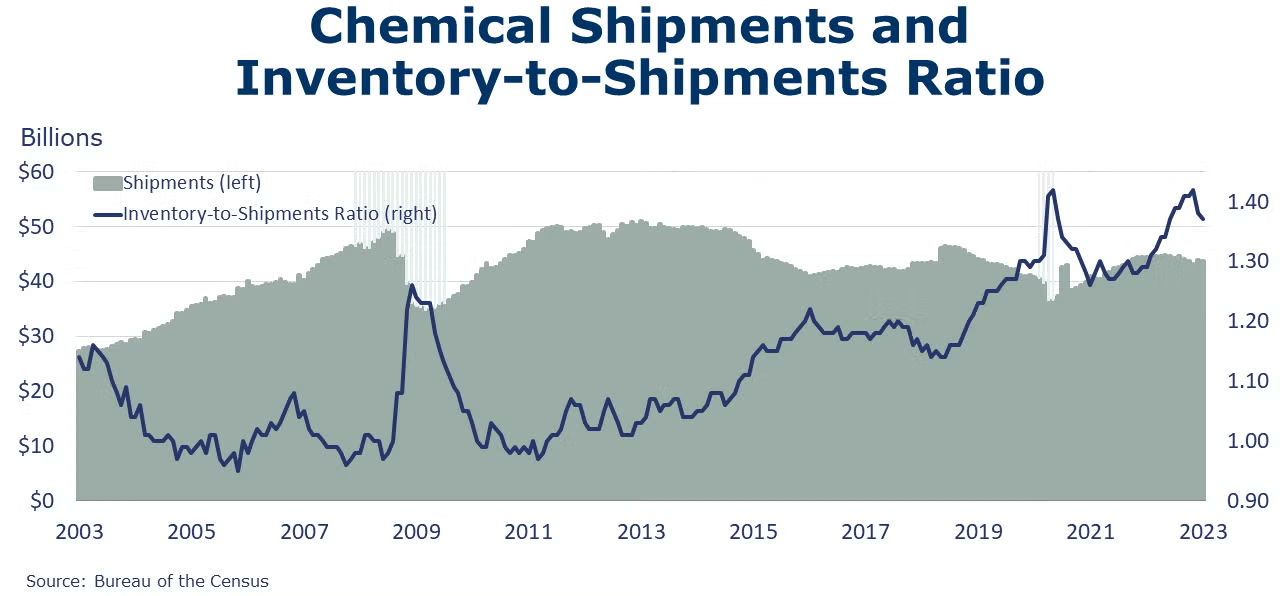
Chemical shipments moved slightly higher for a second month in March, up by 0.2%. Gains in shipments of agricultural chemicals offset lower shipments of coatings, adhesives, and other chemicals. Chemical inventories eased by 0.1% as lower inventories of coatings, adhesives, and other chemicals offset higher inventories of agricultural chemicals. The inventories-to-shipments ratio eased from 1.37 in February to 1.36 in March. This level was higher than a year ago (1.32) but lower than its recent peak of 1.42 in November 2022. Chemical shipments were off 1.3% Y/Y while inventories were up 2.3% Y/Y.
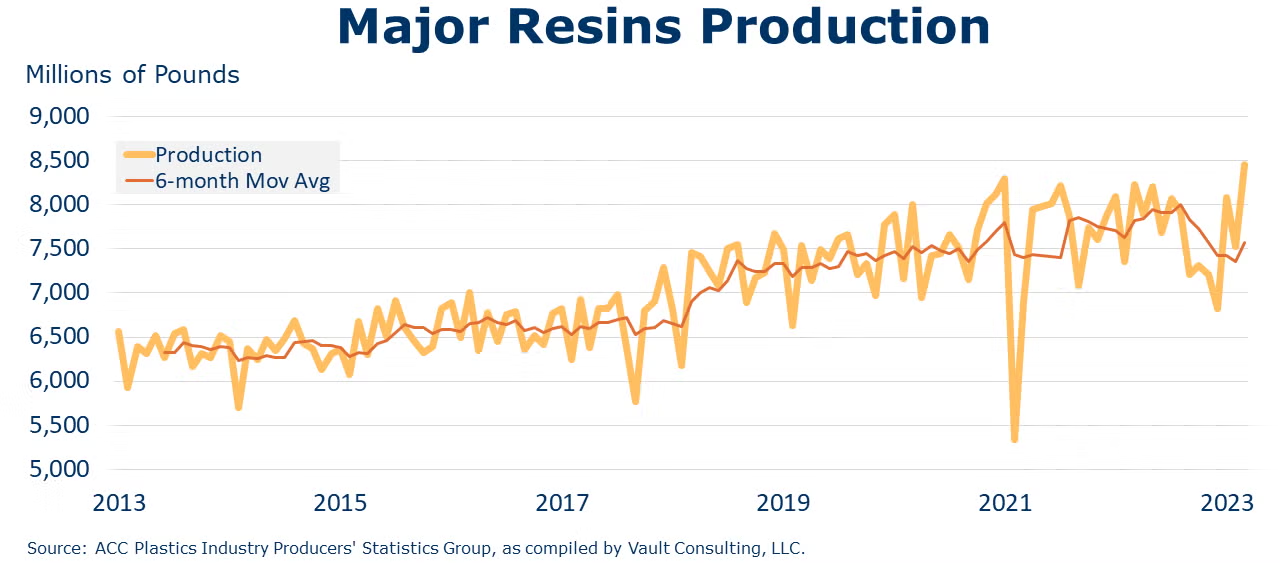
ACC reported that production of major plastic resins in North America totaled 8.5 billion pounds in March 2023, a level up 12.5% M/M and up 2.7% Y/Y. Year-to-date production was 24.1 billion pounds, 1.6% higher than the same period in 2022. Sales and captive (internal) use of major plastic resins totaled 8.0 billion pounds, up 8.1% M/M but down 7.0% Y/Y. Year-to-date sales and captive use were 23.2 billion pounds, a 1.2% decrease compared to the same time last year.
Chemical industry construction spending rose 0.6% in March and was up 21.6% Y/Y. Chemical construction spending as a percent of total manufacturing construction spending was 22.2% in March. The comparison has been softening gradually after climbing to a sustained high proportion (around 46%) during 2014-2017.
Chemical and pharmaceutical industry employment rebounded by 2,000 (0.2%) in April. The number of production workers rose by 6,300 while the number of supervisory and non-production workers fell by 4,300. Compared to a year ago, industry employment was up by 17,200 (2.3% Y/Y). Average hourly wages were up 6.2% Y/Y. The average workweek increased by 12 minutes to 41.5 hours. With the higher number of production workers and a slightly longer workweek, the labor input into the chemical industry rose 1.4% from March, suggesting that output rose. This is in contrast to the ISM Manufacturing PMI® report that suggested chemical production contracted in April.
The U.S. Geological Survey reported that monthly production of soda ash in February was 831 thousand tons, down 6.0% compared to the previous month and down 2.8% Y/Y. Stocks fell 2.6% compared to January to 295 thousand tons at the end of the month, a 10-day supply. Ending stocks were up 15.2% Y/Y.
Note On the Color Codes
The banner colors represent observations about the current conditions in the overall economy and the business chemistry. For the overall economy we keep a running tab of 20 indicators. The banner color for the macroeconomic section is determined as follows:
Green – 13 or more positives
Yellow – between 8 and 12 positives
Red – 7 or fewer positives
For the chemical industry there are fewer indicators available. As a result, we rely upon judgment whether production in the industry (defined as chemicals excluding pharmaceuticals) has increased or decreased three consecutive months.
For More Information
ACC members can access additional data, economic analyses, presentations, outlooks, and weekly economic updates through ACCexchange.
In addition to this weekly report, ACC offers numerous other economic data that cover worldwide production, trade, shipments, inventories, price indices, energy, employment, investment, R&D, EH&S, financial performance measures, macroeconomic data, plus much more. To order, visit http://store.americanchemistry.com/.
Every effort has been made in the preparation of this weekly report to provide the best available information and analysis. However, neither the American Chemistry Council, nor any of its employees, agents or other assigns makes any warranty, expressed or implied, or assumes any liability or responsibility for any use, or the results of such use, of any information or data disclosed in this material.
Contact us at ACC_EconomicsDepartment@americanchemistry.com.

