Running tab of macro indicators: 10 out of 20
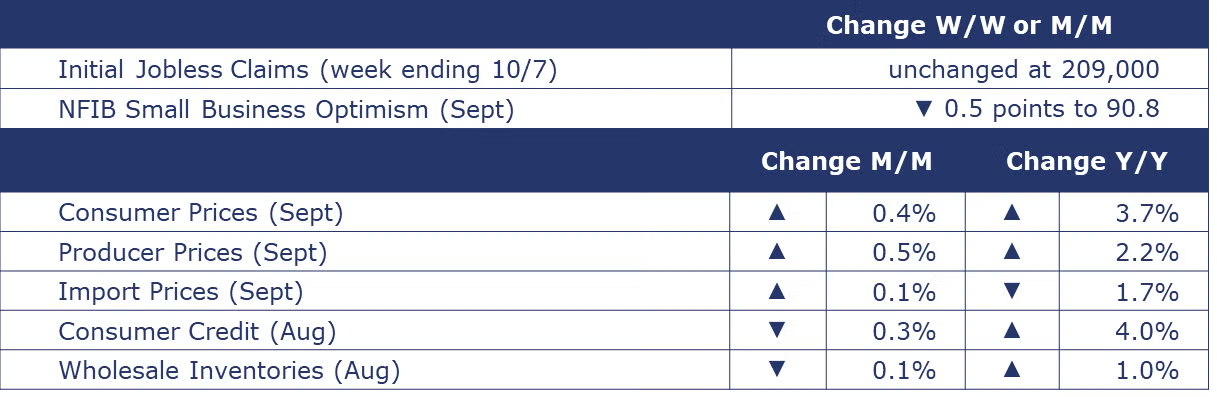
The number of new jobless claims remained the same during the week ending October 7. Continuing claims increased by 30,000 to 1.70 million, and the insured unemployment rate for the week ending September 30 was unchanged at 1.1%.

Headline consumer prices rose 0.4% in September and were up 3.7% Y/Y. The rise in the headline consumer price index (CPI) was largely due to an increase in the cost of shelter, accounting for more than half the increase, and the cost of gasoline also rose. Core CPI (all items less food and energy) rose 0.3% in September and was up 4.1% Y/Y.
Headline producer prices rose by 0.5% in September, the smallest monthly gain since June. The gain in producer prices was driven by higher prices for energy (which accounted for nearly three-quarters of the price increase for final demand goods). Prices were also higher for jet fuel, chicken & meat, electric power, and diesel fuel. Excluding food and energy, core producer prices rose by 0.2%. Compared to last year, headline producer prices were up 2.2% Y/Y, while core prices were up 2.8% Y/Y. Coming off a 0.6% monthly jump in August, U.S. import prices stabilized over September, rising only 0.1% (due in large part to moderation in fuel import prices growth). Compared to last year, import prices were down 1.7%. U.S. export prices rose 0.7% in September following a 1.1% gain in August. Prices of agricultural exports softened (-1.1%) while non-ag exports prices rose by 1.0%. U.S. export prices are down 4.1% Y/Y.
Pessimism remains among small business owners, with nearly one-fourth reporting inflation as the top concern. The NFIB Small Business Optimism Index was down half of a point in September (to 90.8), marking the 21st consecutive month below the 49-year average of 98.
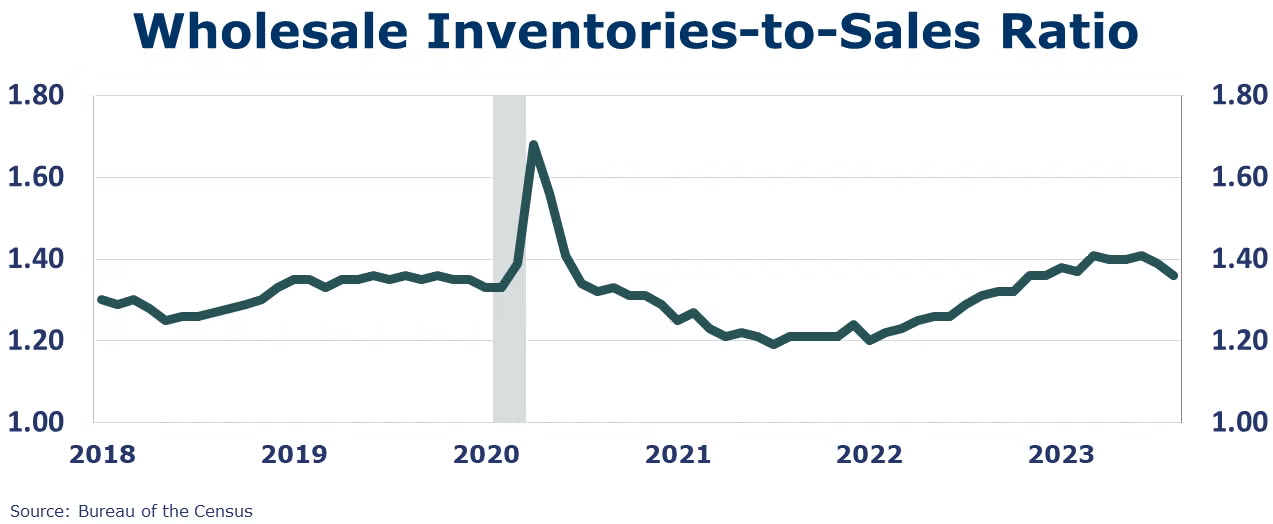
Wholesale inventories continued to move lower, down 0.1% in August. Inventories were lower across most categories, with the largest declines in furniture, computer equipment, metals, electrical, apparel, and chemicals. Wholesale inventories were higher for motor vehicles, petroleum, and hardware. Sales at the wholesale level rose 1.8% in August. Compared to a year ago, sales were 1.7% lower while inventories were 1.0% higher. The wholesale inventories-to-sales ratio fell from 1.39 in July to 1.36 in August.
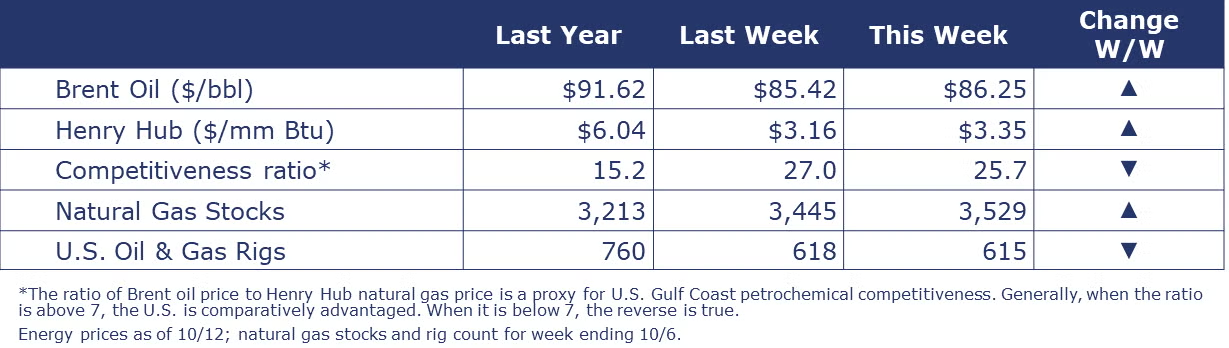
Oil prices were higher than last Thursday, but lower compared to September as new EIA data on exports, production and refinery demand suggest a loosening of oil markets. U.S. natural gas prices were also higher this week as the winter heating season draws closer. The combined oil and gas rig count fell by three to 615 during the week ending 6 October.
Indicators for the business of chemistry suggest a yellow banner.
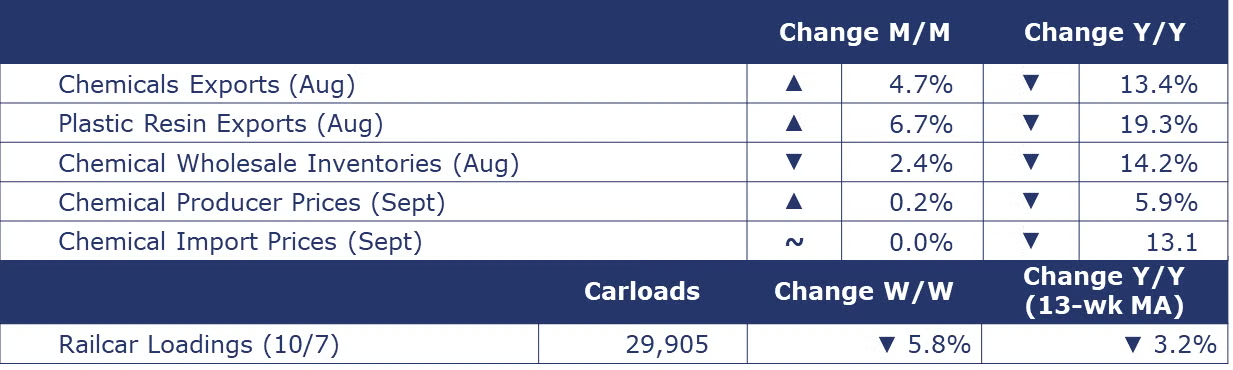
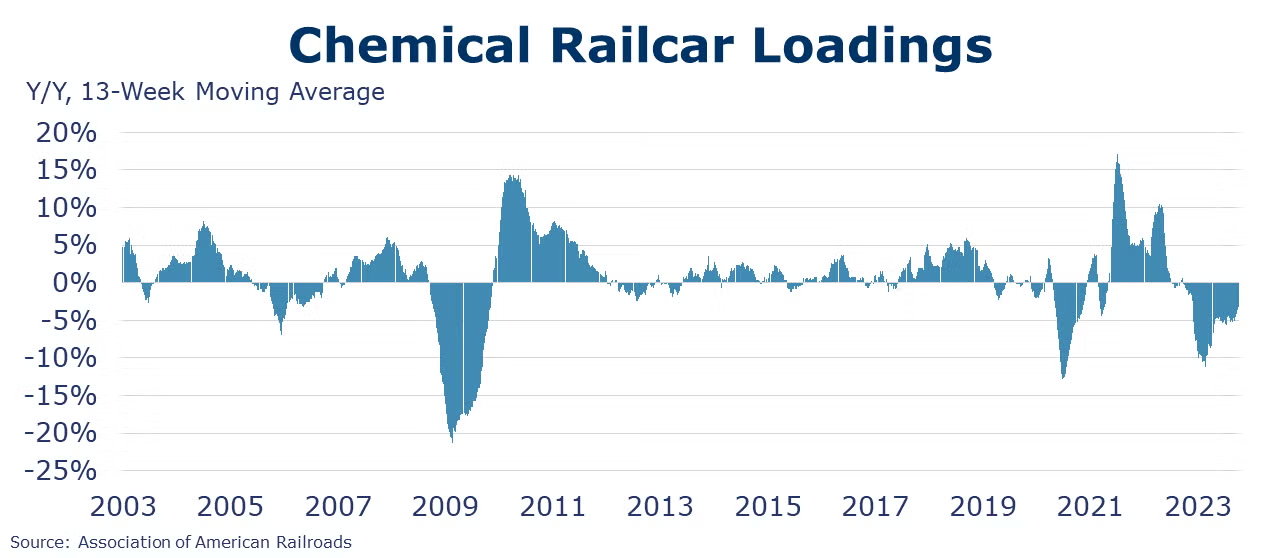
According to data released by the Association of American Railroads, chemical railcar loadings were down to 29,905 for the week ending October 7. Loadings were down 3.2% Y/Y (13-week MA), down (3.8%) YTD/YTD, and have been on the rise for 7 of the last 13 weeks.
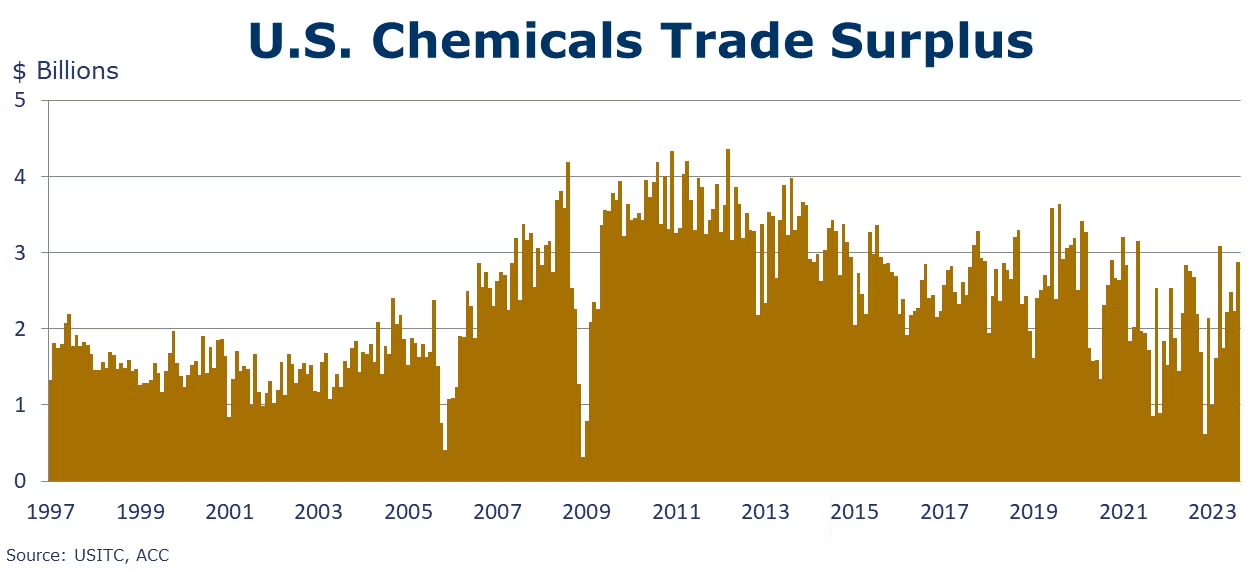
U.S. chemical exports rose by $620 million to $13.7 billion in August, up 4.7% from July but down 13.4% Y/Y and down 9.2% YTD/YTD. Plastic resins exports rose 6.7% to $3.1 billion in August, a level down 19.3% Y/Y. On a YTD/YTD comparison, all categories of chemical exports were down except consumer products, synthetic fibers, and coatings. U.S. chemical imports held steady at $10.8 billion in August but was down 17.6% Y/Y and down 10.2% YTD/YTD. On a YTD/YTD comparison, all categories of chemical imports were down except consumer products and inorganic chemicals. The U.S. trade surplus in chemicals increased in August reaching $17.3 billion YTD.
Following four months of consecutive declines, chemical producer prices were higher in September, up by 0.2%. Prices were higher for plastic resins, synthetic rubber, manufactured fibers, inorganic chemicals, agricultural chemicals, and specialty chemicals (excluding coatings). These gains were partially offset by lower prices for bulk petrochemicals and organics, coatings, and consumer products. Compared to a year ago, chemical prices remained 5.9% lower Y/Y.
Following seven months of decline, chemical import prices stabilized in September. Chemical export prices also held steady (up just 0.1%). On a Y/Y basis, import prices are down 13.1% and export prices are down 14.9%.
Chemical wholesale inventories fell 2.4% in August, following a 0.9% decline in July. Sales of chemicals at the wholesale level increased 1.4%. As a result, the inventories-to-shipments ratio fell from 1.15 in July to 1.11 in August. Inventories were off 14.2% Y/Y while sales were off 6.2% Y/Y.
Note On the Color Codes
Banner colors reflect an assessment of the current conditions in the overall economy and the business chemistry of chemistry. For the overall economy we keep a running tab of 20 indicators. The banner color for the macroeconomic section is determined as follows:
Green – 13 or more positives
Yellow – between 8 and 12 positives
Red – 7 or fewer positives
There are fewer indicators available for the chemical industry. Our assessment on banner color largely relies upon how chemical industry production has changed over the most recent three months.
For More Information
ACC members can access additional data, economic analyses, presentations, outlooks, and weekly economic updates through ACCexchange.
In addition to this weekly report, ACC offers numerous other economic data that cover worldwide production, trade, shipments, inventories, price indices, energy, employment, investment, R&D, EH&S, financial performance measures, macroeconomic data, plus much more. To order, visit http://store.americanchemistry.com/.
Every effort has been made in the preparation of this weekly report to provide the best available information and analysis. However, neither the American Chemistry Council, nor any of its employees, agents or other assigns makes any warranty, expressed or implied, or assumes any liability or responsibility for any use, or the results of such use, of any information or data disclosed in this material.
Contact us at ACC_EconomicsDepartment@americanchemistry.com