Running tab of macro indicators: 7 out of 20
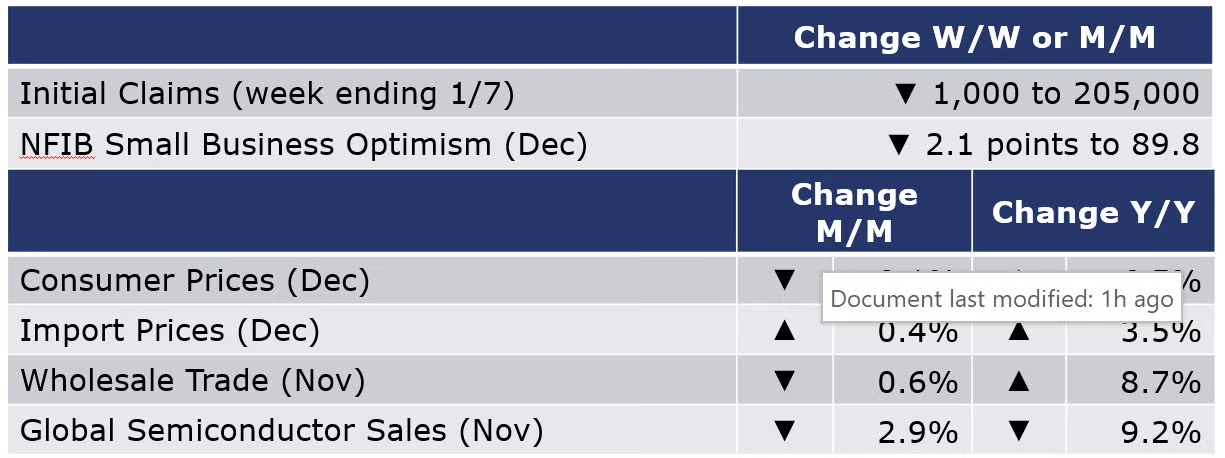
The number of new jobless claims was down by 1,000 to 205,000 during the week ending 7 January. Continued claims were down (by 63,000) to 1.63 million for the week ending 31 December and the insured unemployment rate was 1.1%, down from the previous week's rate of 1.2%.
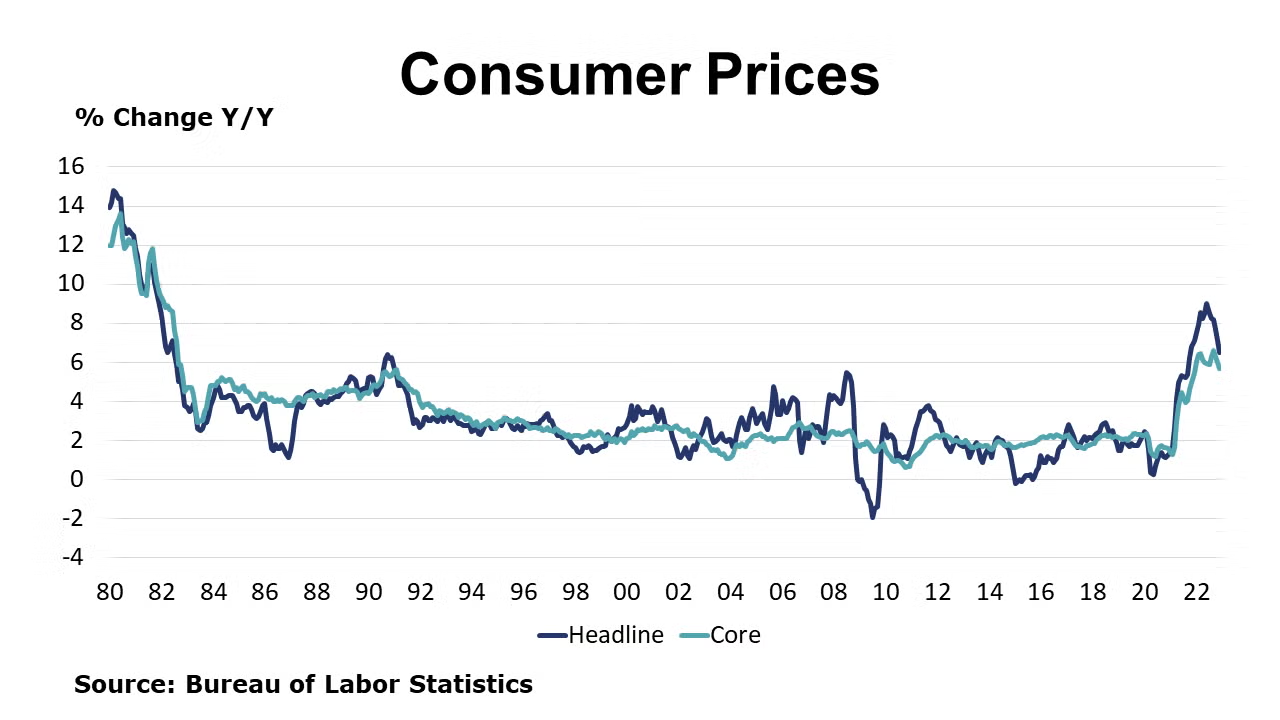
Headline consumer prices ended the year with a 0.1% decline in December led by lower prices for gasoline. Excluding the volatile food and energy components, core consumer prices rose 0.3%, continuing the deceleration seen since the end of Q3 when core prices were growing at twice that pace. Services inflation continued to build. Headline consumer prices were up 6.5% Y/Y while core consumer prices were 5.7% higher Y/Y, both showing an easing of inflation pressures. For the whole of 2022, consumer prices were up 8.0%, the fastest pace since 1981 and faster than average hourly earnings for which were up 5.2%.
Reversing a declining trend that began in July, import prices rose 0.4% in December. The gain reflected higher prices for imported fuels and the largest gain in nonfuel import prices since April. The BLS noted strong gains in prices for nonferrous metals and finished metals. Import prices were up 3.5% Y/Y. The value of the U.S. dollar which strengthened rapidly during the first part of the year has fallen in recent months, making imports into the U.S. more expensive. Export prices fell 2.6% with declines in both agricultural and non-agricultural export prices and were ahead by 5.0% Y/Y.
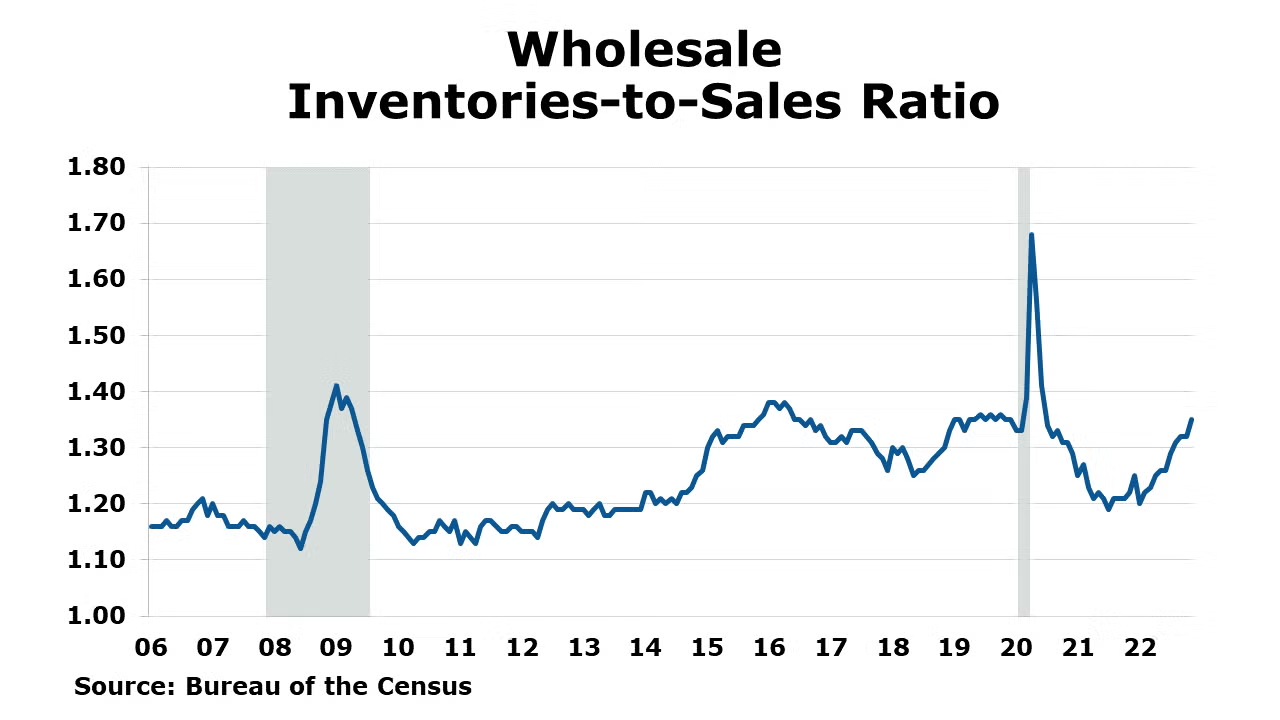
Following flat growth in October, nominal wholesale trade fell 0.6% in November with declines across nearly all durable categories (except for machinery and furniture) and several nondurable categories, including paper and petroleum products. Wholesale inventories rose by 1.0%, following a 0.6% gain in October. Inventories of durables rose across the board. The inventories-to-sales ratio rose from 1.32 to 1.35, up from 1.21 in November 2021. Compared to a year ago, sales at the wholesale level were up 8.7% while inventories were up 20.9% Y/Y.
Small business optimism fell more than expected in December with its composite index falling by 2.1 points to 89.8. While eight of the 10 components weakened, there were indications that price pressures were easing. Demand for labor also appears to be softening.
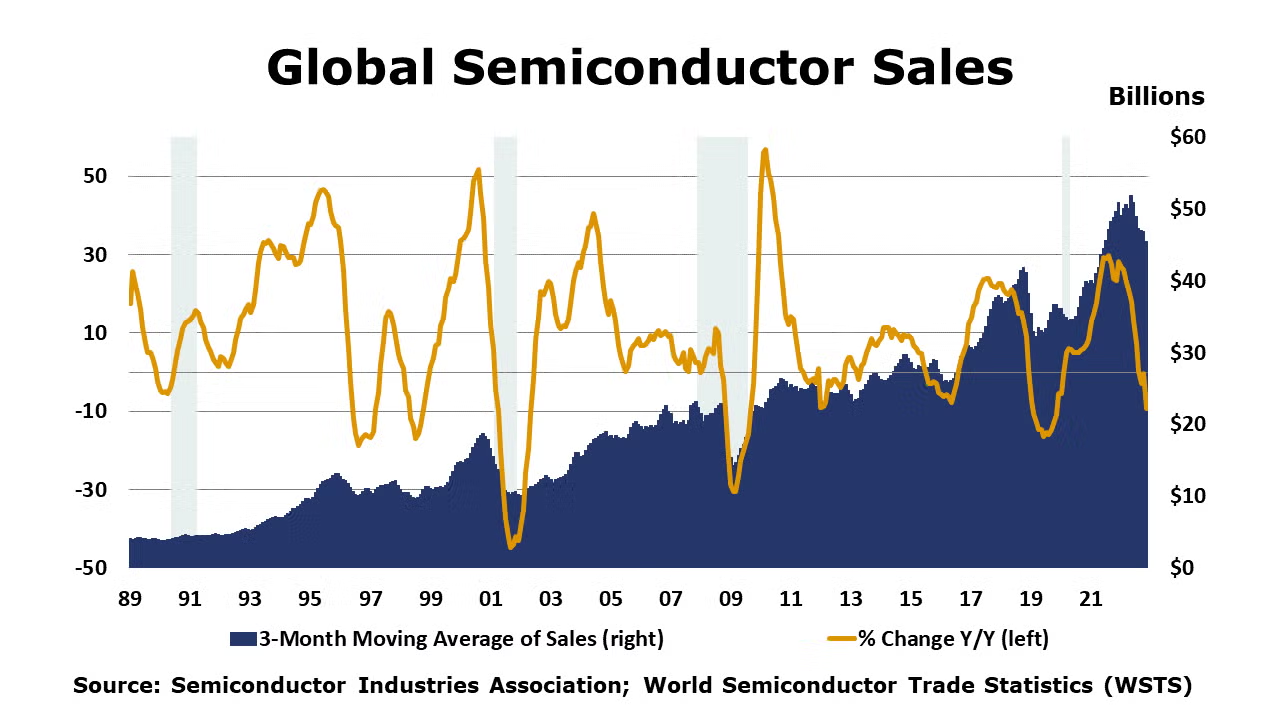
Global semiconductor industry sales were down (2.9%) M/M to $45.5 billion in November. Sales were down 9.2% Y/Y globally but were up 5.2% Y/Y in the Americas.

Natural gas prices were slightly higher than a week ago but remain near their lowest level in a year as U.S. natural gas production sets new production records and less is being withdrawn from inventories due to the warmer than typical weather. In fact, there was an exceedingly rare 11 BCF build in natural gas inventories last week. European gas prices also continue to ease and are back to year-ago levels. The combined oil and gas rig count fell by seven during the week ending 6 January.
For the business of chemistry, the indicators still bring to mind a red banner for basic and specialty chemicals.
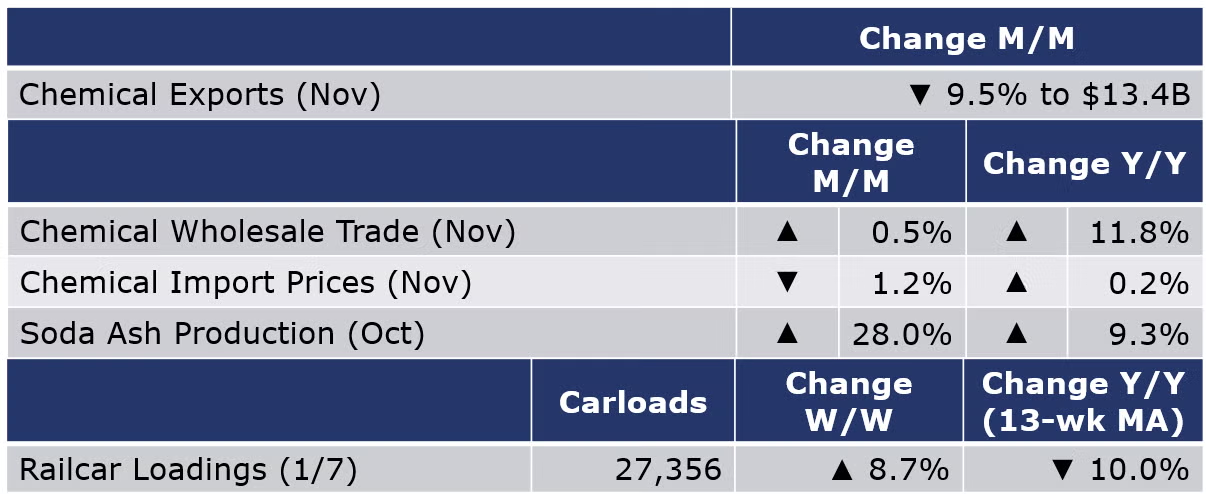
According to data released by the Association of American Railroads, chemical railcar loadings were up 8.7% to 27,356 for the week ending 7 January. Loadings were down 10.0% Y/Y (13-week MA) and have been on the rise for 7 of the last 13 weeks.
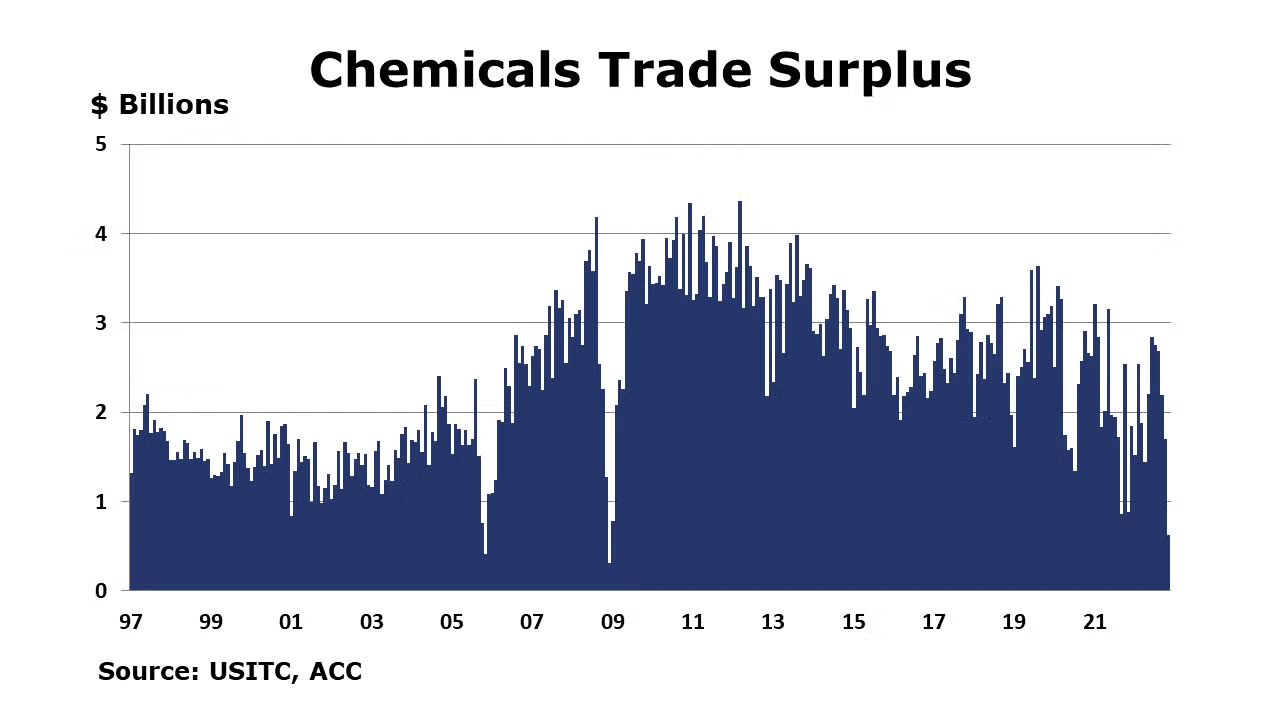
U.S. chemicals trade contracted in November by 6.2% as exports fell by 9.5% and imports fell by 2.5% in the month. The U.S. chemicals trade surplus dropped by $1 billion to $620 million in November. The YTD/YTD comparison on the balance was down by 2.7%. Chemical exports fell in all categories except for agricultural chemicals. Chemical imports fell in all sectors expect for agricultural chemicals and bulk petrochemicals and intermediates.
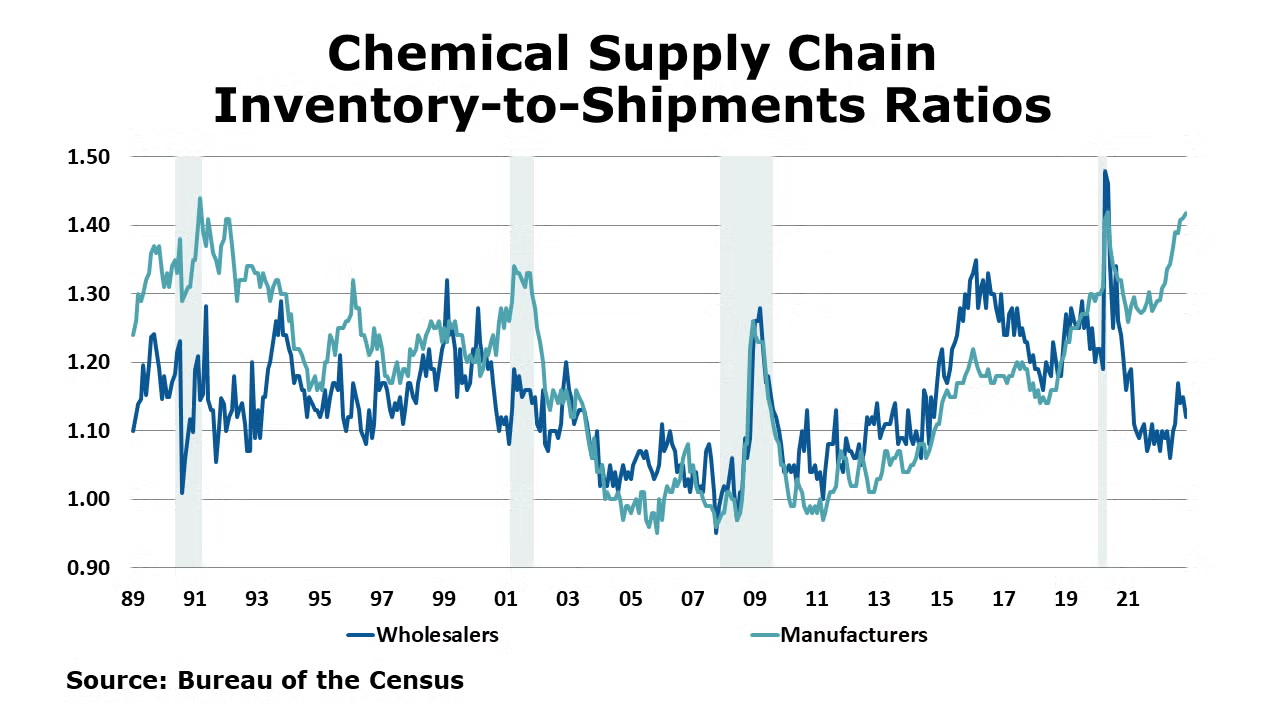
Sales of chemicals at the wholesale level rose 0.5% in November to $14.7 billion. Inventories also continued to decline, off by 2.1% to $16.4 billion. Compared to a year ago, wholesale sales of chemicals were up 11.8% Y/Y while inventories were up 17.7% Y/Y. The inventories-to-sales ratio fell from 1.15 in October to 1.12 in November. This was up from 1.06 a year ago.
Chemical import prices fell for a seventh consecutive month in December, down by 1.2%. Export prices also declined, down 0.8%. Compared to a year ago import prices remained ahead by 0.2% Y/Y while export prices were off 3.8% Y/Y. For the whole of 2022, chemical import prices were up 15.4% following a 17.8% gain in 2021.
The U.S. Geological Survey reported that monthly production of soda ash in October was 1,030 thousand tons, up 28.0% compared to the previous month and up 9.3% Y/Y. Stocks rose 26.3% over September to 298 thousand tons at the end of the month, a 9-day supply. Ending stocks were up 8.8% Y/Y.
Note On the Color Codes
The banner colors represent observations about the current conditions in the overall economy and the business chemistry. For the overall economy we keep a running tab of 20 indicators. The banner color for the macroeconomic section is determined as follows:
Green – 13 or more positives
Yellow – between 8 and 12 positives
Red – 7 or fewer positives
For the chemical industry there are fewer indicators available. As a result we rely upon judgment whether production in the industry (defined as chemicals excluding pharmaceuticals) has increased or decreased three consecutive months.
For More Information
ACC members can access additional data, economic analyses, presentations, outlooks, and weekly economic updates through MemberExchange.
In addition to this weekly report, ACC offers numerous other economic data that cover worldwide production, trade, shipments, inventories, price indices, energy, employment, investment, R&D, EH&S, financial performance measures, macroeconomic data, plus much more. To order, visit http://store.americanchemistry.com/.
Every effort has been made in the preparation of this weekly report to provide the best available information and analysis. However, neither the American Chemistry Council, nor any of its employees, agents or other assigns makes any warranty, expressed or implied, or assumes any liability or responsibility for any use, or the results of such use, of any information or data disclosed in this material.
Contact us at ACC_EconomicsDepartment@americanchemistry.com

