MACROECONOMY & END-USE MARKETS
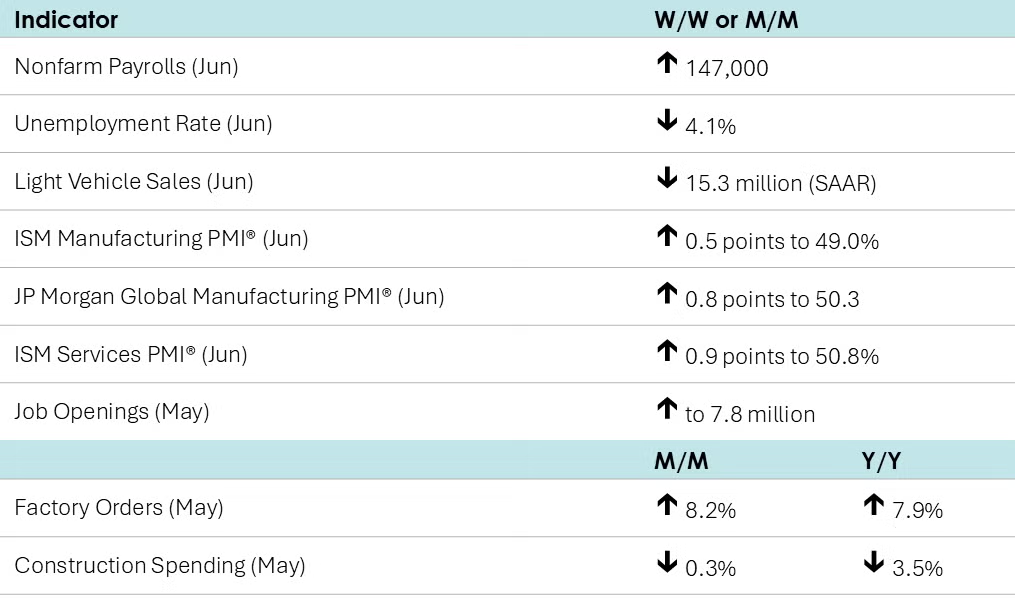
Nonfarm payrolls expanded by 147,000 in June and gains in April and May were upwardly revised by 16,000. Jobs in manufacturing continued to fall, down by 7,000 last month. Jobs in construction rose, but the largest gains were in the services sector, notably healthcare and state & local government. Average hourly earnings rose 3.7% Y/Y, the slowest pace in nearly a year and the second slowest pace since June 2021. From the separate household survey, the unemployment rate ticked lower to 4.1%, in part due to the lower number of people looking for work. The labor participation rate moved slightly lower to 62.3%
Job openings rose slightly to 7.8 million in May. The rate of people voluntarily quitting their job (a rough measure of workers’ confidence in the labor market) remained essentially unchanged.
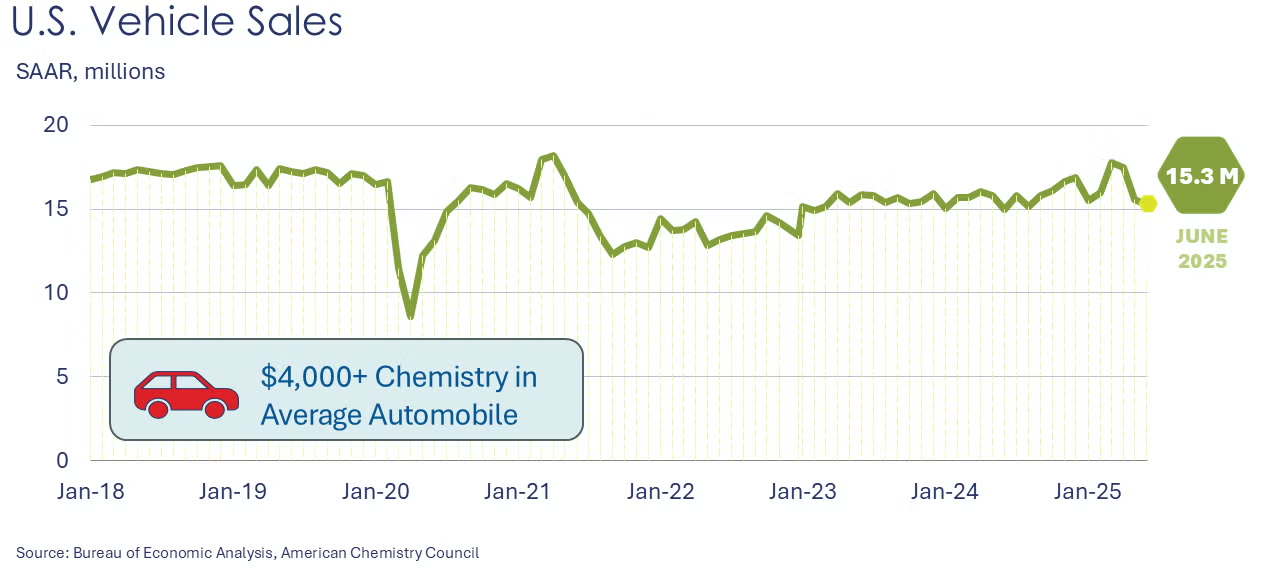
Light vehicle sales fell for a third consecutive month, down to a 15.3 million seasonally adjusted annual rate (SAAR). Following a surge in March and into April to avoid tariffs, vehicle sales have fallen off in May and June. With more than $4,000 in chemistry in a typical North American built vehicle, this is an important end-use market for chemicals and plastics.
Buffeted by high borrowing costs and continued uncertainty, construction spending fell for a ninth consecutive month in May, down 0.3%. The decline was led by continued lower spending on privately-funded residential and nonresidential projects. Publicly-funded construction edged slightly higher. Compared to a year ago, construction spending was off by 3.5% Y/Y.
The ISM Manufacturing PMI® rose 0.5 points in June to 49.0%, a level that indicates U.S. manufacturing contracted for a fourth consecutive month, though at a slower rate than in May. New orders, order backlogs and employment continued to contract, but production expanded slightly. Inventories contracted at a slower rate and customer inventories were deemed “too low”. Prices rose at a faster rate and delivery times slowed. Imports and export orders continued to contract, but at a slower rate. The average procurement lead times were higher across all three supply categories – production materials, capital expenditures, and MRO supplies. Nine manufacturing industries reported growth in June, while six reported contraction (including chemicals). Many of the comments cited tariff and geopolitical uncertainty and the negative impact on sales and orders.
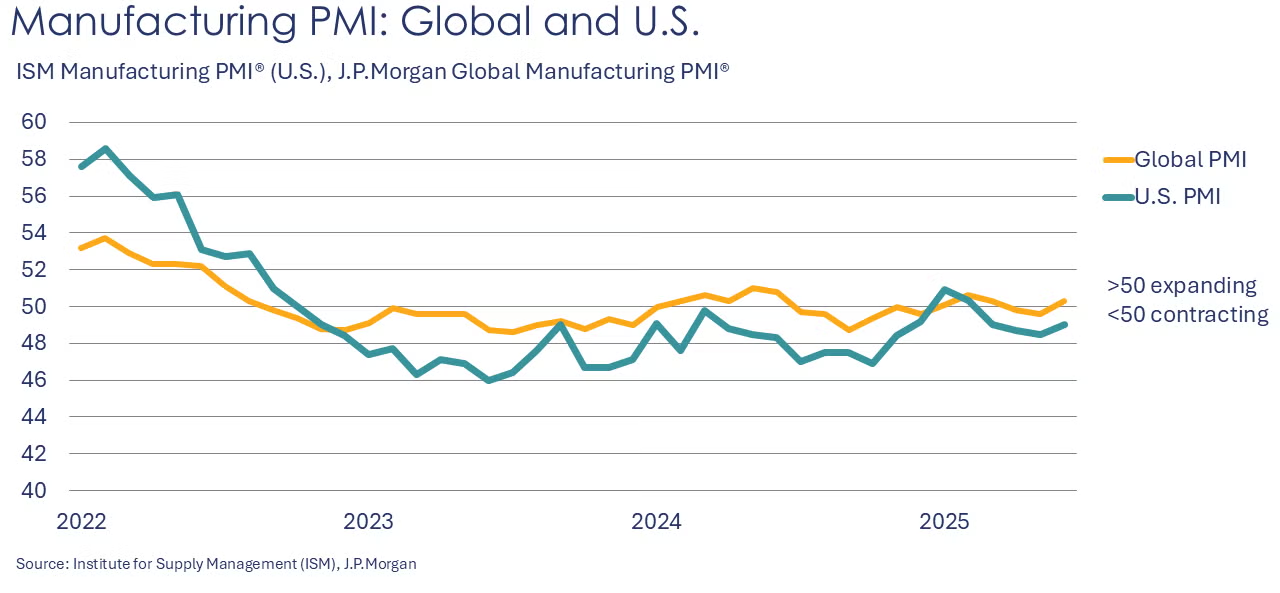
The JP Morgan Global Manufacturing PMI® rose 0.8 points to 50.3 in June. Both new orders and production expanded, and employment registered its weakest decrease since August 2024. The rebound in worldwide production volumes was led by returns to growth in China and Japan, and continued gains in the Eurozone. India continued to register the fastest overall rate of expansion. The UK, Brazil, Mexico and Russia were among the manufacturing economies that contracted last month.
Perceptions of broader manufacturing conditions in Texas continued to worsen in June, according to Dallas Fed’s Texas Manufacturing Outlook Survey. The general business activity index rose 2.6 points to -15.3. Production held steady while new orders and shipments were lower. Expectations for manufacturing activity six months from now remained positive.
Factory orders jumped 8.2% in May, due in large part to sharply higher orders for civilian aircraft and defense goods. There were also gains in orders for IT equipment, computers, motor vehicles, and consumer goods. Orders for construction materials and supplies continued to move lower, however. Orders for core business goods (nondefense capital goods, excluding aircraft) rose 1.7% (following a similar decline in April). Unfilled orders (a measure of the manufacturing pipeline) rose strongly, by 3.4%. Manufacturing shipments edged higher by 0.1%, the same pace by which manufacturing inventories expanded. As a result, the inventories-to-shipments ratio remained stable at 1.58.
The nation’s trade deficit expanded to $71.5 billion in May, as exports fell faster than imports. Exports fell 4.0% to $279.0 billion as declines in industrial supplies & materials and capital goods were only partially offset by higher exports of consumer goods. Imports eased 0.1% to $350.5 billion with declines in industrial supplies & materials and consumer goods offset by higher imports of vehicles & parts, capital goods, and a large gain in other goods imports. The trade deficit with China fell to its lowest level since March 2020.
The ISM Services PMI® rose 0.9 points to 50.8% in June, returning to expansion territory. Business activity, new orders, export orders, imports and inventories expanded. Prices continued to increase. Employment contracted and order backlogs contracted at a faster pace. Supplier deliveries were slightly slower. Ten industries reported growth in June, while six (including agriculture and construction) reported contraction. Within the comments, respondents noted higher prices from tariffs, but a few commented that business was starting to pick up.
CHEMICALS
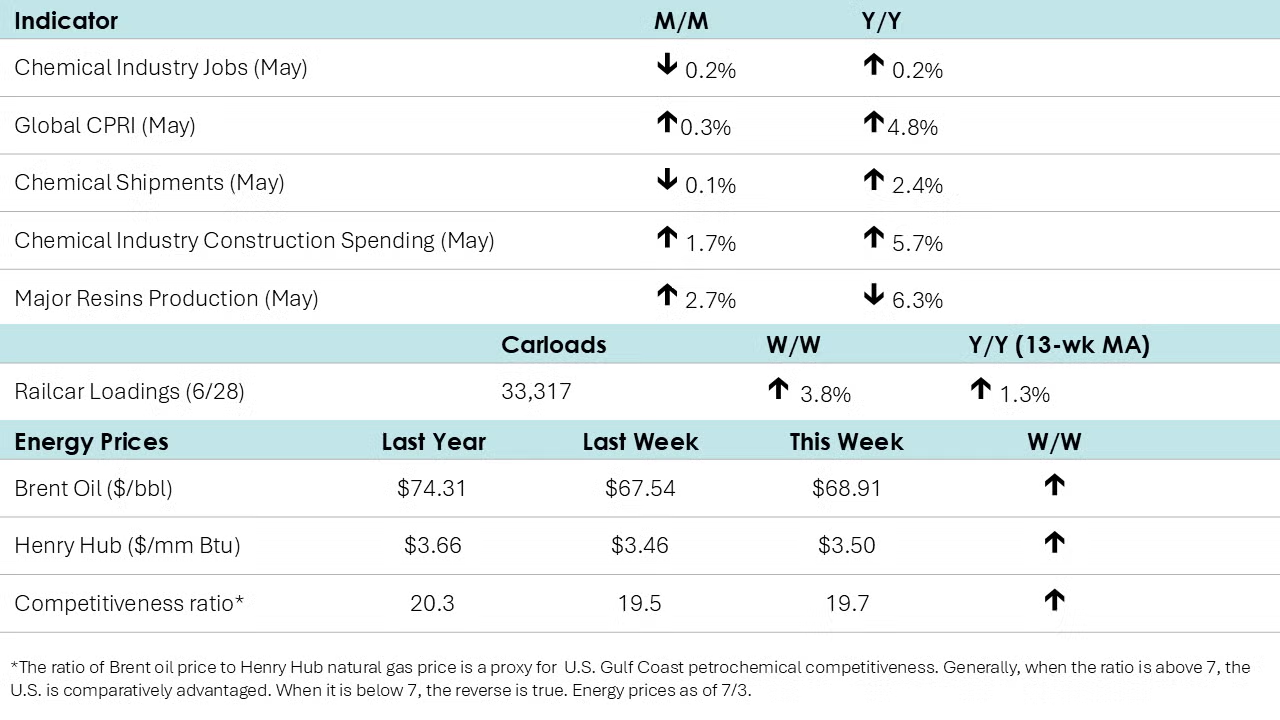
According to data released by the Association of American Railroads, chemical railcar loadings were up/down to 33,317 for the week ending June 28th. Loadings were up 1.3% Y/Y (13-week MA), up 1.6% YTD/YTD and have been on the rise for six of the last 13 weeks.
Within the details of the ISM Manufacturing PMI® report, the chemical products sector was one of six industries that reported contraction in June. Manufacturers of chemical products reported lower new orders, production, backlogs, employment, inventories, export orders and imports. The sector also reported slower supplier deliveries and said that customer inventories were “too low”.
Within the comments of the Texas Manufacturing Outlook Survey, several chemical manufacturing respondents offered the following comments:
- “The world is responding in an unprecedented destocking. The tariff-driven dumping by China to other countries is preventing competitiveness on a global scale. End consumer demand is down, causing finished product inventories to fall significantly as companies attempt to manage through this unprecedented period. The entire supply chain is backed up by as much as two months, even if the global economic outlook improves. We believe destocking may cease, but orders will be slow to increase due to this two-month backlog in the supply chain.”
- “General activity in the chemical industry seems to have decreased substantially.”
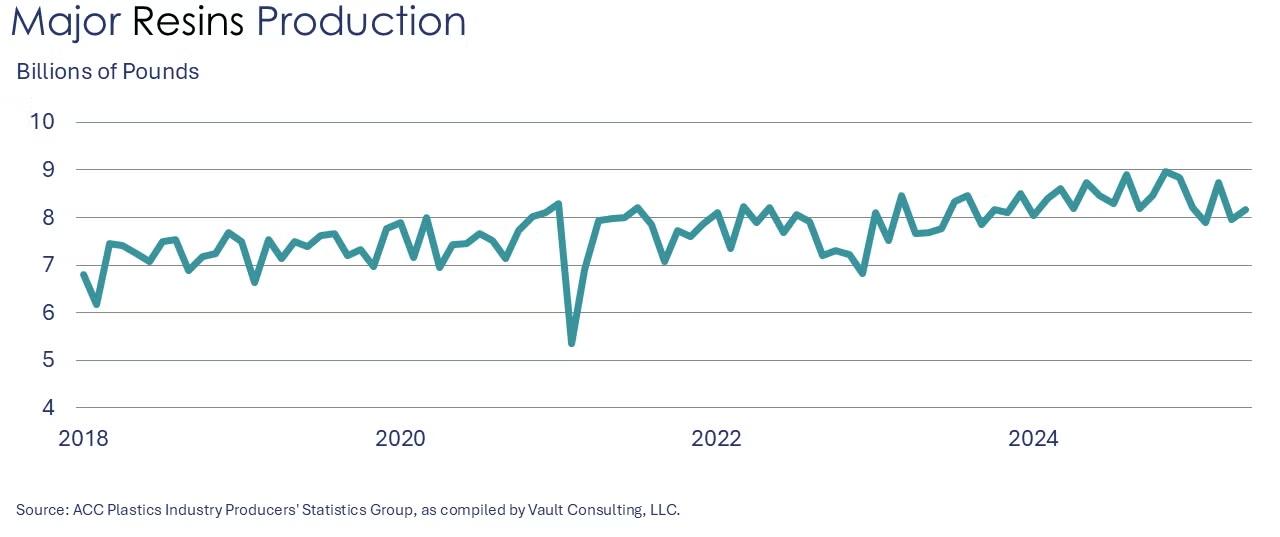
U.S. production of major plastic resins totaled 8.2 billion pounds in May, an increase of 2.7% compared to the prior month, but declined 6.3% compared to the same month in 2024, according to ACC. Year-to-date production was 41.0 billion pounds, a 2.3% decline as compared to the same period in 2024.
Sales and captive (internal) use of major plastic resins totaled 8.6 billion pounds during May, an increase of 7.0% compared to the prior month, and a 0.8% increase from the same month one year earlier. Year-to-date sales and captive use were 41.3 billion pounds, a 1.5% decline compared to the same period in 2024.
Chemical industry construction spending rose 1.7% in May to a $41.7 billion seasonally adjusted annual rate, a new record high. Compared to a year ago, spending on chemical manufacturing projects was up 5.7% Y/Y.
US and Global CPRI
Following a 0.5% gain in April, the ACC’s Global Chemical Production Regional Index(Global CPRI) increased by 0.3% in May. Production rose in Europe, Asia, Africa, and the Middle East but declined elsewhere. Production in the Asia-Pacific region slowed as front-loading subsided. European output increased as the Eurozone’s Manufacturing PMI (S&P Global) improved and new orders stabilized. Output in North America decreased as trade-related uncertainty weighed on production decisions. South American production continued to decline in May, with a significant drop in Brazilian output. All segments saw improvement, and year-over-year production rose by 4.8%.
The U.S. CPRI edged down by 0.4% in April. This index measures chemical production trends based on a three-month moving average to smooth out month-to-month volatility. Production declined the most in the Northeast and Southeast regions. Overall, the U.S. CPRI was 2.4% higher than it was a year ago.
For more details, check out our new CPRI Dashboard.
Chemical shipments eased in May, down 0.1% to $57.3 billion. Higher shipments of agricultural chemicals were offset by lower shipments of coatings & adhesives and other chemicals. Chemical inventories were also lower, by 0.2%, as higher inventories of coatings & adhesives and agricultural chemicals were more than offset by a decline in inventories of other chemicals. Compared to a year ago, shipments were up 2.4% Y/Y while inventories were up 0.7%. In June, the inventories-to-shipments ratio for chemicals ticked lower to 1.24.
Chemical industry employment fell in May, down 0.2% to 548,300 (up 0.2% Y/Y). Employment in plastic resin manufacturing edged slightly higher, however, up by 0.2% to 62,000, a level 2.0% higher than last May. (Note that data at the detailed industry level are lagged one month behind the headline jobs report.)
In June, combined chemical and pharmaceutical jobs rose by 900 to 903,100, a level up 0.6% Y/Y. A gain in the number of supervisory & non-production workers was only partially offset by a decline in production workers. Average hourly earnings for production workers rose 2.5% Y/Y to $31.43. The average workweek remained steady at 42.1 hours in June. With the decline in production workers and the average workweek remaining stable, the implied labor input into the chemical industry eased in June, consistent with the ISM PMI® report which reported that the chemical industry contracted.
Energy Wrap-Up
- Oil prices were higher compared to the previous week going into the holiday weekend as Iran turned away UN nuclear inspectors; natural gas prices remained relatively stable.
- Natural gas inventories rose by 55 BCF and remained above the five-year historic average.
- The combined oil & gas rig count fell for a ninth consecutive week (for the week ending 6/27) to 541.
For More Information
ACC members can access additional data, economic analyses, presentations, outlooks, and weekly economic updates through ACCexchange.
In addition to this weekly report, ACC offers numerous other economic data that cover worldwide production, trade, shipments, inventories, price indices, energy, employment, investment, R&D, EH&S, financial performance measures, macroeconomic data, plus much more. To order, visit store.americanchemistry.com.
Every effort has been made in the preparation of this weekly report to provide the best available information and analysis. However, neither the American Chemistry Council, nor any of its employees, agents or other assigns makes any warranty, expressed or implied, or assumes any liability or responsibility for any use, or the results of such use, of any information or data disclosed in this material.
Contact ACC's Economics & Data Analytics department via email.