WASHINGTON (February 2, 2024) — According to the American Chemistry Council (ACC), the Global Chemical Production Regional Index (Global CPRI) trended higher by 0.1% in December, following a revised 0.5% gain in November. In the U.S., the U.S. Chemical Production Regional Index (U.S. CPRI) rose 0.4% in December, following a 0.3% decline in November. Both indices are measured on a three-month moving average (3MMA) basis to reduce month-to-month volatility.
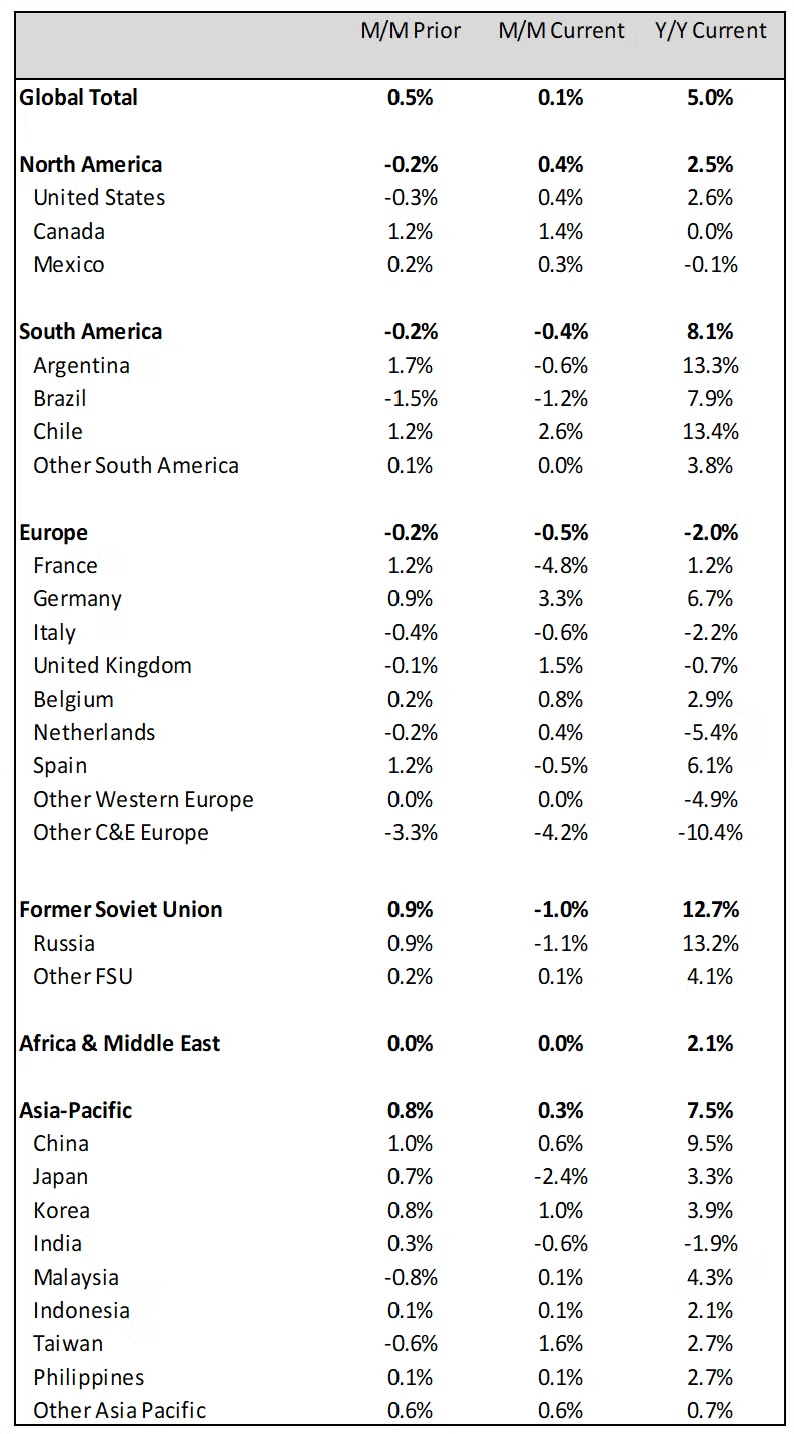
“The gain in December was led by North America and Asia-Pacific,” said Martha Moore, ACC’s chief economist. “Even though global production was higher on a year-over-year basis, Europe continued to see weakness as production remained below last year’s level.”
“In the U.S., chemical output rose in all regions except the Gulf Coast. There were signs of recovery in the output volumes of agricultural and coatings and other specialty chemicals that offset ongoing weakness in basic industrial chemicals and synthetic materials.”
Key findings:
- The gain in the Global CPRI during December was led by higher chemical output in China despite the country’s ongoing real estate woes and deflationary pressures. That said, economic activity often slows in January and February as China celebrates the Lunar New Year.
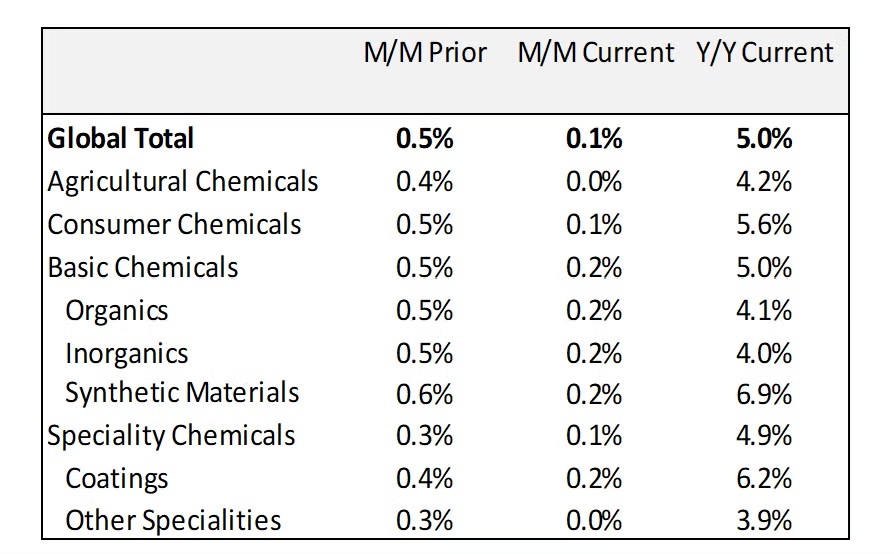
- Global output increased in all segments, with basic chemicals and specialty materials showing the highest gain.
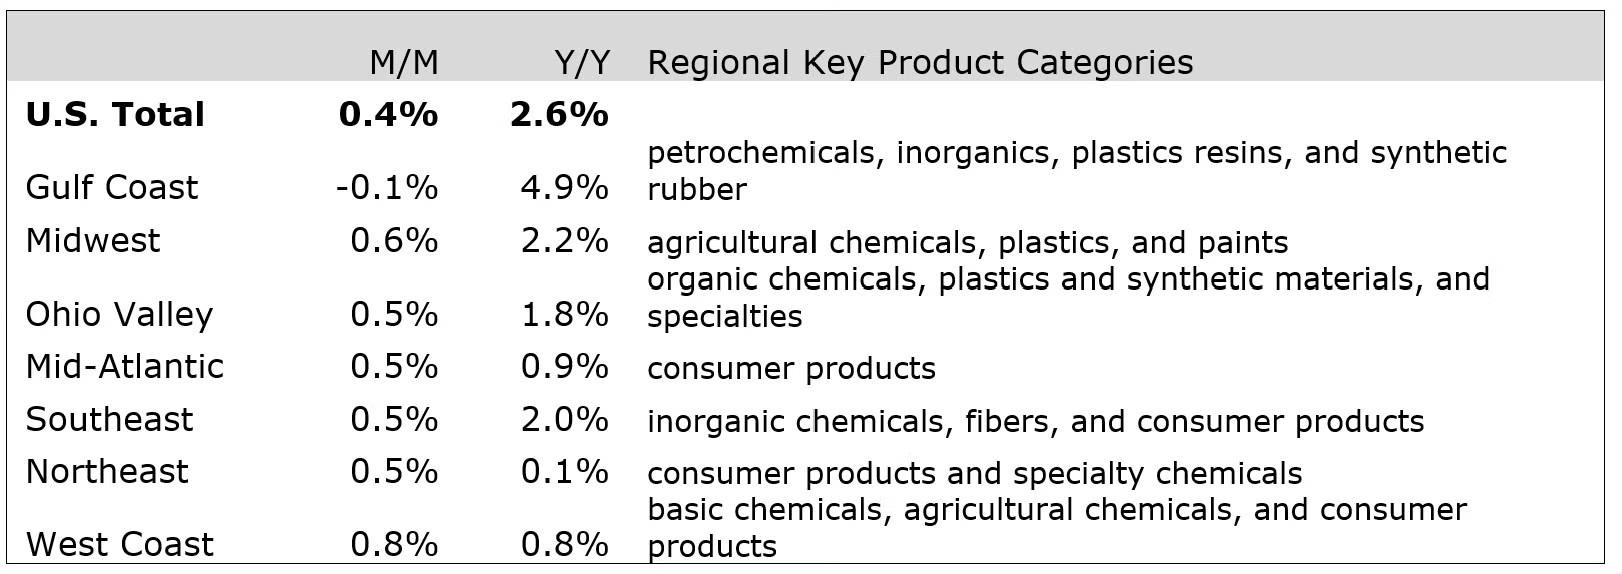
- According to U.S CPRI, chemical output in the U.S. was higher for the first time in four months with gains across all regions, except the Gulf Coast.
- The decline in the Gulf Coast reflected ongoing weakness in demand for basic industrial chemicals and synthetic materials, a large share of which are produced in that region.
- Compared to last December (when a late-month freeze event disrupted production), U.S. chemical production was 2.6% higher.
Global Chemical Production by Country/Region, Percentage Change
(Seasonally adjusted, 3-month moving average)
Global Chemical Production by Segment, Percentage Change
(Seasonally adjusted, 3-month moving average)
The Global CPRI measures the production volume of the chemical industry for 55 key nations, sub-regions, and regions, all aggregated to the world total. While most data are seasonally adjusted at source, some are adjusted using the U.S. Census Bureau’s X-12 model to present data comparable to the United States. In a few cases, ACC creates indices of production based on actual production data weighted according to industry structure. The index uses the total value added as a proxy for individual country weights to arrive at the total. This method accounts for the changes in each country’s share relative to global production, which is more reflective of the ever-changing global production dynamics. The Global CPRI measures production activity generally consistent with the overall industry nomenclature of NAICS 325 (less pharmaceuticals) and the EU NACE 20 industries. The index measures the production of soaps and detergents, personal care products, fertilizers, and other downstream products in addition to measuring inorganic chemicals, organic chemicals, plastic resins, synthetic fibers, synthetic rubber, adhesives and sealants, coatings, and other specialty chemicals. Production of pharmaceuticals is excluded.
U.S. Chemical Production Regional Index, Percentage Change
(Seasonally adjusted, 3-month moving average)
The U.S. CPRI was developed to track chemical production activity in seven regions of the United States. The U.S. CPRI is based on information from the Federal Reserve, and as such, includes monthly revisions as published by the Federal Reserve. The U.S. CPRI includes the most recent Federal Reserve benchmark revision released on March 28, 2023. To smooth month-to-month fluctuations, the U.S. CPRI is measured using a three-month moving average. The reading in September reflects production activity during October, November and December.


