Running tab of macro indicators: 15 out of 20
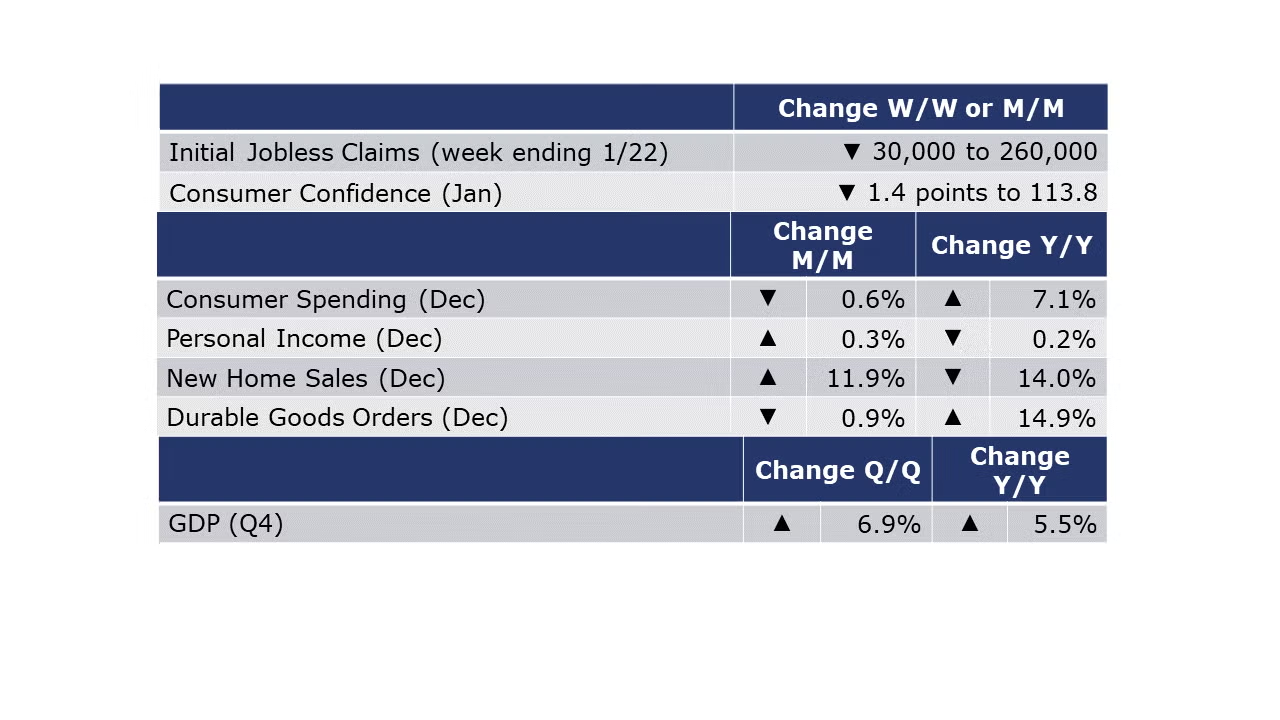
The number of new jobless claims was up by fell by 30,000 to 260,000 during the week ending 22 January. Continuing claims increased by 51,000 to 1.67 million, and the insured unemployment rate for the week ending 15 January was unchanged at 1.2%.
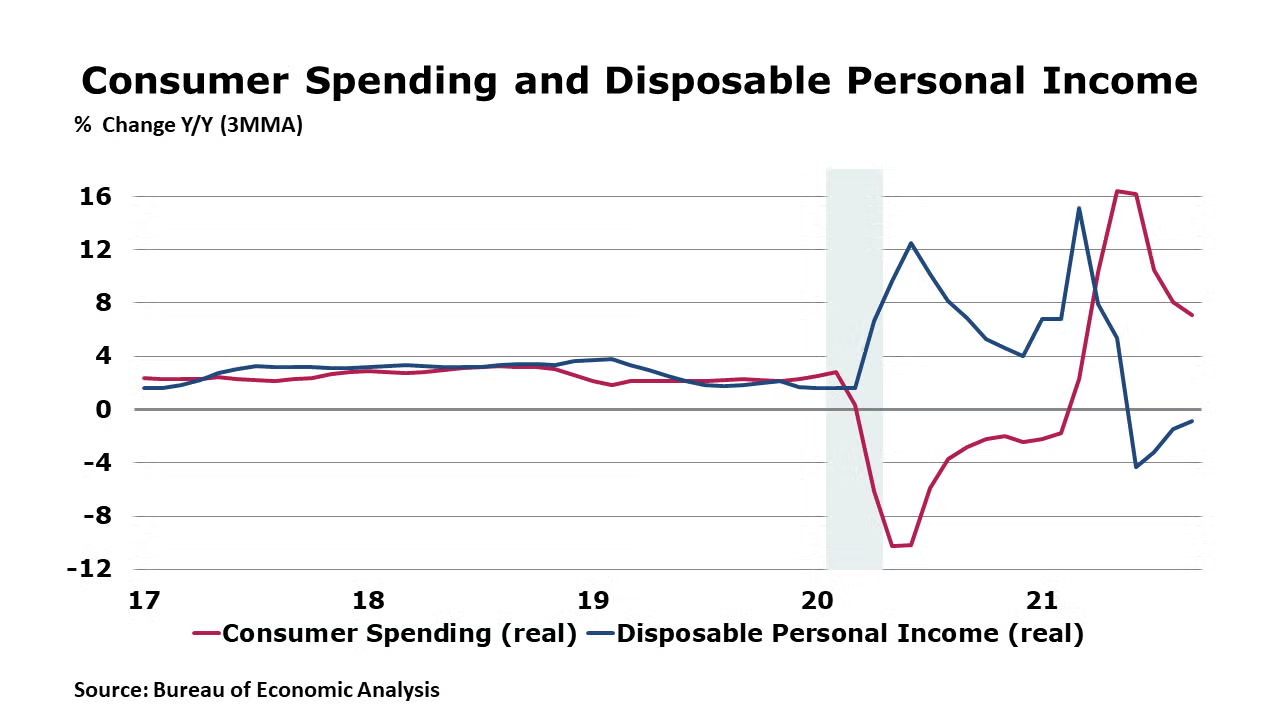
Buffeted by the spread of Omicron and increasing prices, consumer spending fell 0.6% in December, in line with expectations. It was the first decline in nine months and follows exceptionally strong growth during much of the past year. Spending on goods took the largest hit while spending on services continued to expand. Growth in personal income slowed in December, up by 0.3% with gains in employee compensation offsetting declines in proprietor’s income and transfer payments (e.g., unemployment benefits). The price index for personal consumption expenditures (PCE deflator), a preferred inflation measure of the Fed, rose 5.8% Y/Y. Excluding food & energy, the core PCE deflator was up 4.9% Y/Y. Both measures reflect an acceleration. Compared to a year ago, disposable personal income was off 0.2% while spending was up by 7.1% Y/Y.
Following three months of gains, consumer confidence fell in January as Omicron surged. The index fell 1.4 points to 113.8. Expectations about short-term growth prospects weakened, but the proportion of consumers planning to purchase homes, automobiles, and major appliances over the next 6 months continued to increase.
New home sales also surged in December, up 11.9% compared to November. Sales were higher across all regions except the Northeast. Compared to a year ago, new home sales were off 14.0%. Inventories of unsold homes rose 1.5% (+34.8% Y/Y). As sales growth outpaced inventory growth, the months’ supply fell from 6.6 months in November to 6.0 months in December. The median sales price was up 3.4% Y/Y.
Durable goods orders declined by 0.9% in December after two months of increases. Excluding transportation equipment, new orders were up 0.4%. New orders were higher for many durable categories including primary metals, metal products, and motor vehicles. Orders were lower for machinery, communications equipment, electrical equipment, and aircraft and parts. Orders for core business goods (nondefense capital goods, excluding aircraft) were flat. Compared to a year ago, core goods orders were up 11.2% while headline durable orders were up by 14.9% Y/Y.
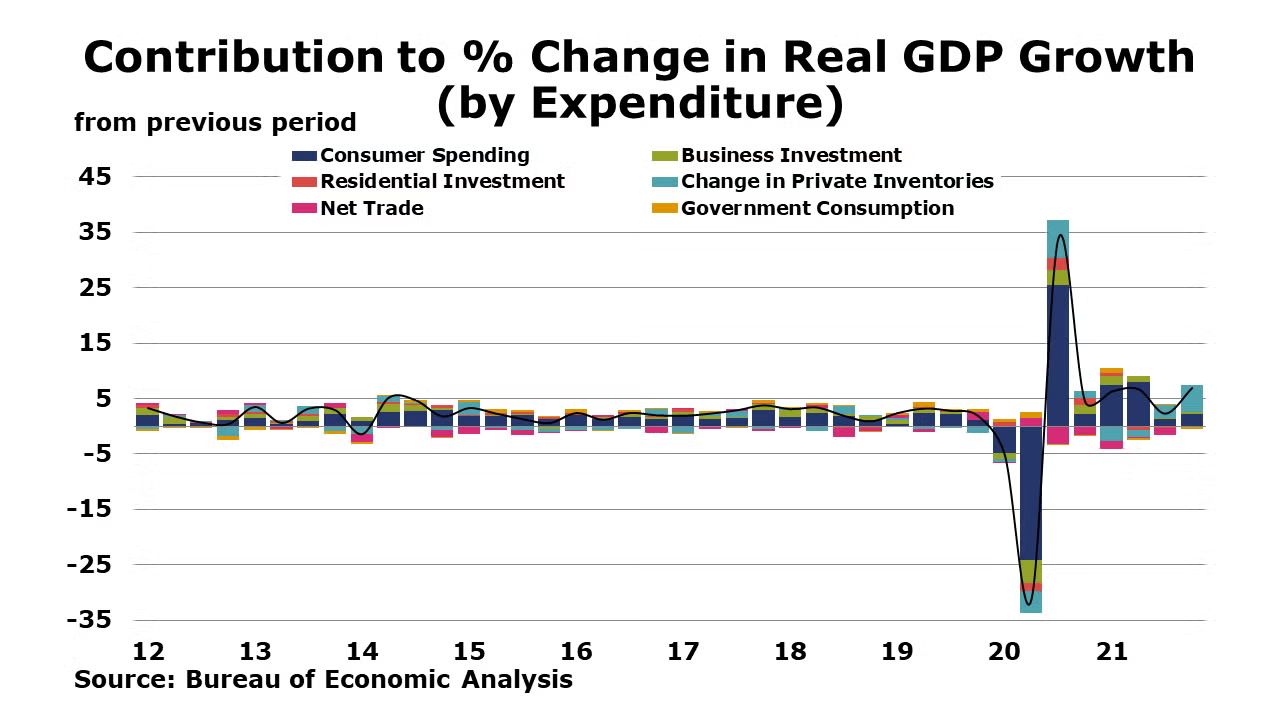
Economic momentum was strong going into the end of the year. In its first of three estimates, the Bureau of Economic Analysis said Q4 GDP accelerated at a 6.9% annual pace, higher than anticipated and the fastest pace since Q3 2020 when the economy was roaring back after pandemic lockdowns. About two-thirds of the gain came from inventory building as firms along the supply chain rebuilt lean inventories and boosted inventory levels to accommodate longer delivery times due to supply chain bottlenecks. Other positive contributions came from business fixed investment and consumer spending. Compared to a year ago, GDP was up 5.5%. The price index for GDP also accelerated in Q4 and was up 5.8% Y/Y.
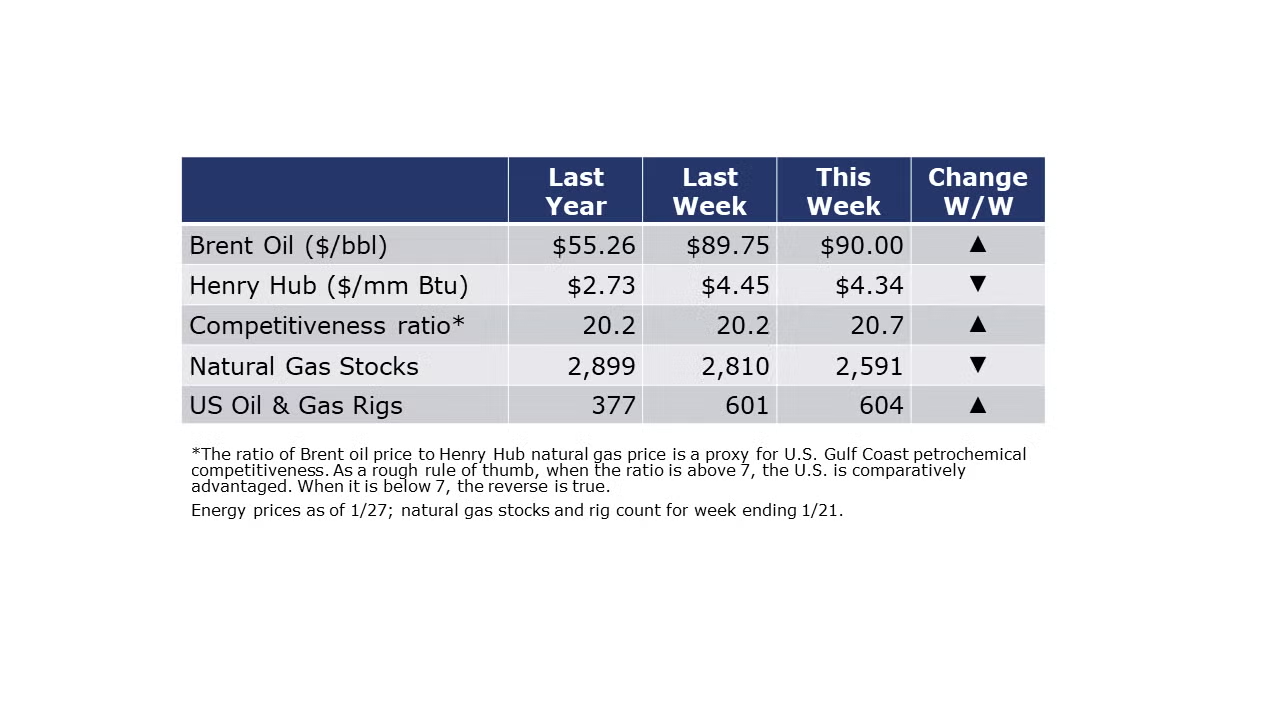
The combined oil and gas rig count rose by 3 to 604 during the week ending 21 January. Oil prices moved higher during the week (topping $90/bbl for the first time since 2014) as Russia continues to mobilize its military near the Ukrainian border. Russia is the world’s 3rd largest oil producer (after the U.S. and the Kingdom of Saudi Arabia) and accounts for more than 12% of global supply. While European natural gas prices soared on escalating tensions between Russia and Ukraine (Russia is #2 in natural gas production), U.S. natural gas prices remained largely steady.
For the business of chemistry, the indicators still bring to mind a green banner for basic and specialty chemicals
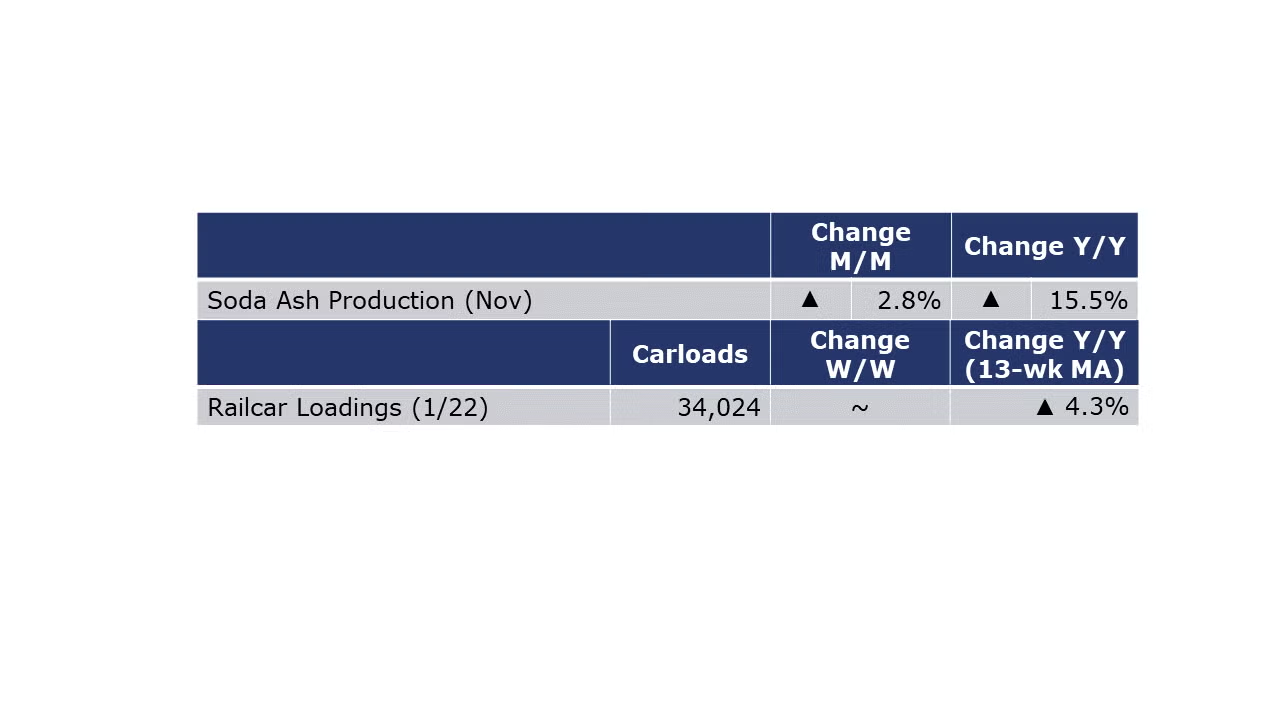
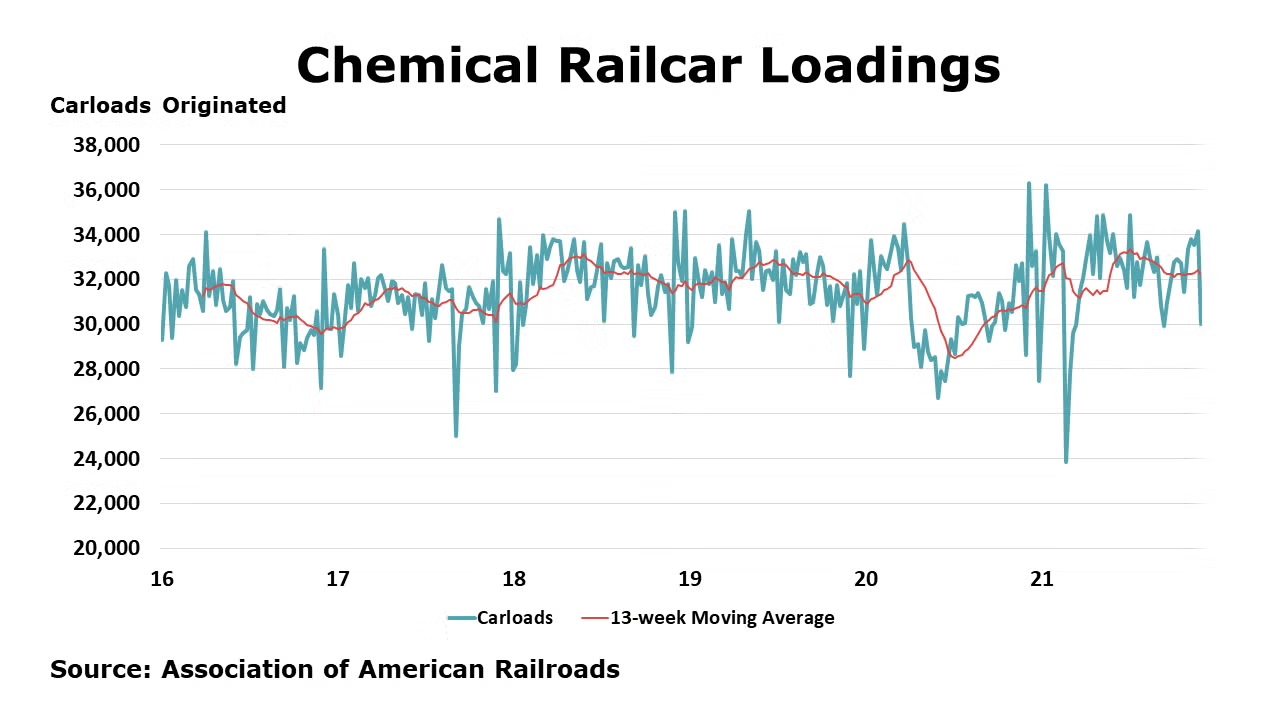
According to data released by the Association of American Railroads, chemical railcar loadings were essentially flat (up 22 carloads) for the week ending 22 January (week 4). Loadings were up 4.3% Y/Y (13-week MA), up slightly (0.1%) YTD/YTD and have been on the rise for 7 of the last 13 weeks.
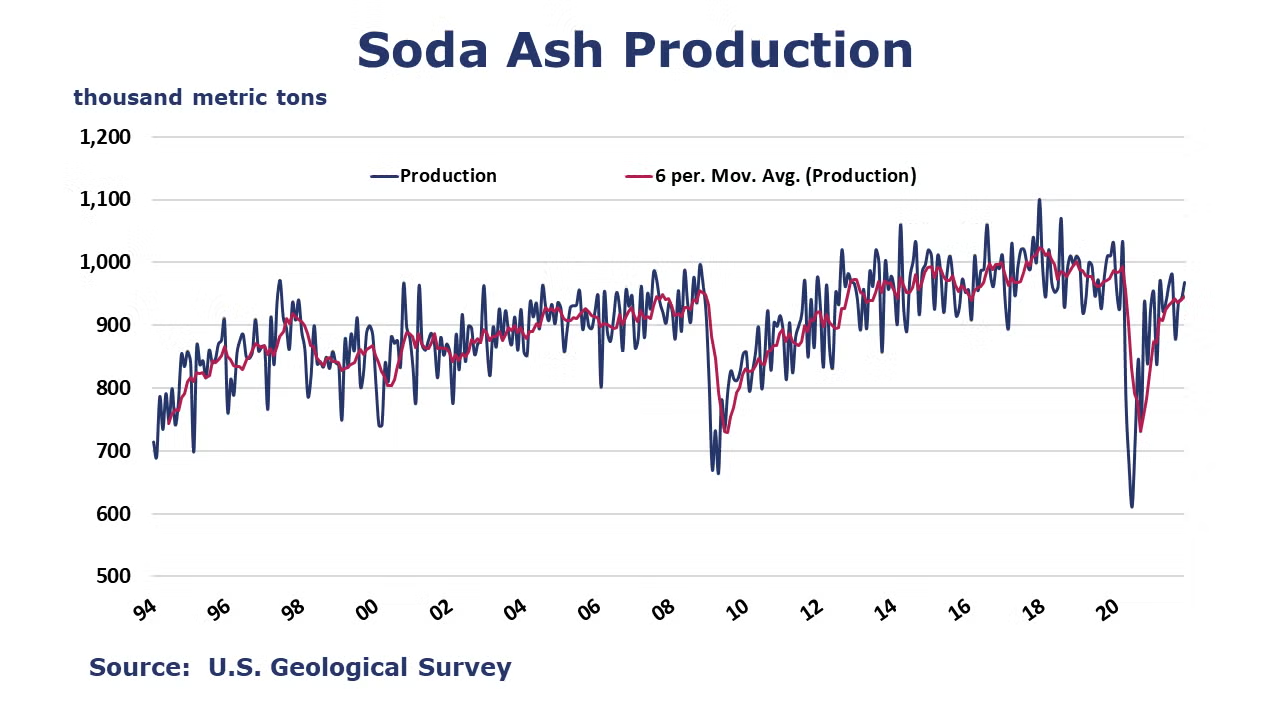
The U.S. Geological Survey reported that monthly production of soda ash in November was 968 thousand tons, up 2.8% compared to the previous month and up 15.5% Y/Y. Stocks fell 5.2% M/M to 277 thousand tons, an 8-day supply. Ending stocks were down 17.3% Y/Y.
Note On the Color Codes
The banner colors represent observations about the current conditions in the overall economy and the business chemistry. For the overall economy we keep a running tab of 20 indicators. The banner color for the macroeconomic section is determined as follows:
Green – 13 or more positives
Yellow – between 8 and 12 positives
Red – 7 or fewer positives
For the chemical industry there are fewer indicators available. As a result we rely upon judgment whether production in the industry (defined as chemicals excluding pharmaceuticals) has increased or decreased three consecutive months.
For More Information
ACC members can access additional data, economic analyses, presentations, outlooks, and weekly economic updates through MemberExchange.
In addition to this weekly report, ACC offers numerous other economic data that cover worldwide production, trade, shipments, inventories, price indices, energy, employment, investment, R&D, EH&S, financial performance measures, macroeconomic data, plus much more. To order, visit http://store.americanchemistry.com/.
Every effort has been made in the preparation of this weekly report to provide the best available information and analysis. However, neither the American Chemistry Council, nor any of its employees, agents or other assigns makes any warranty, expressed or implied, or assumes any liability or responsibility for any use, or the results of such use, of any information or data disclosed in this material.
Contact us at ACC_EconomicsDepartment@americanchemistry.com