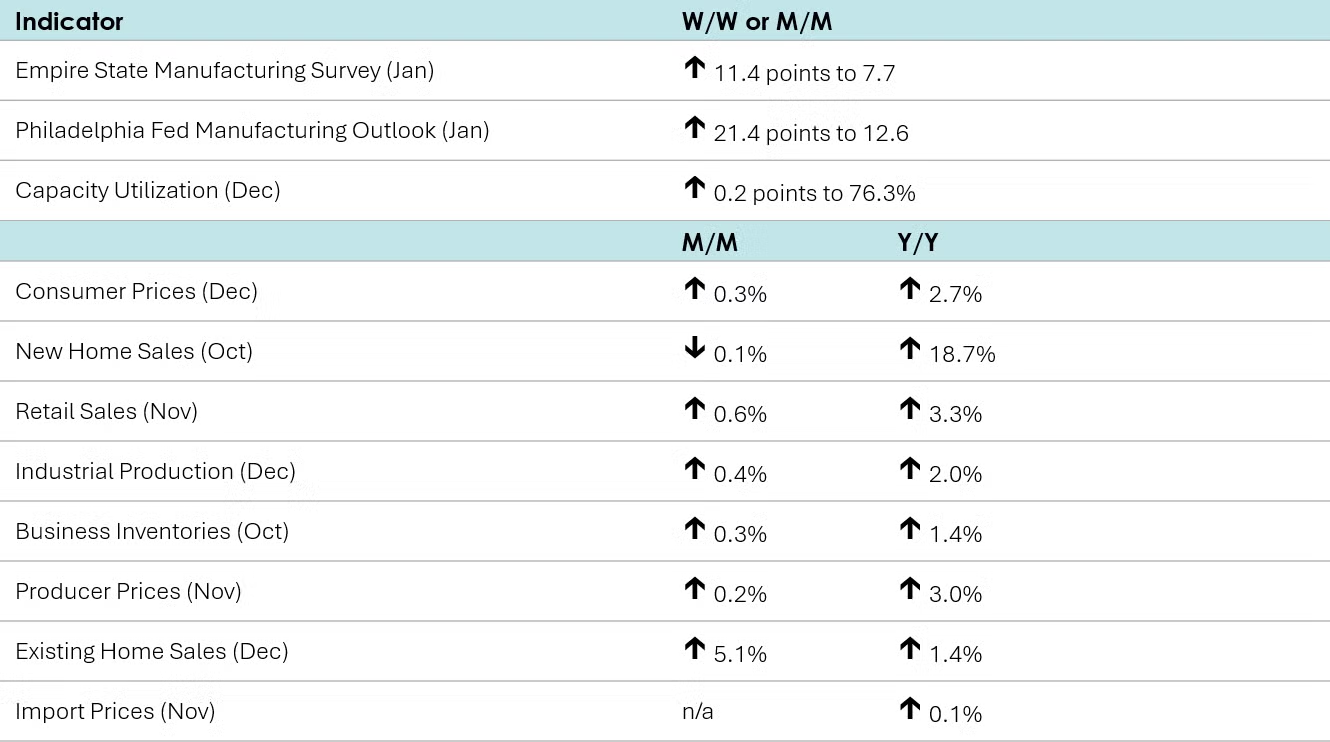
Consumer prices rose 0.3% in December, led by advances in food, shelter, and prices for energy services. Compared to a year ago, consumer prices were up 2.7% Y/Y, while core consumer prices (excluding food and energy) were up 2.6% Y/Y.
Producer prices climbed 0.2% in November after adding 0.1% in October. Prices for final demand goods leaped 0.9%, pushed up by a 4.6% rise in energy prices. Final demand services prices were flat. Compared to a year ago, headline producer prices were up 3.0% Y/Y, accelerating from September’s 2.8% Y/Y gain. Prices for final demand goods rose 3.2% Y/Y (the largest Y/Y percent rise since February 2023), up from a 2.8% Y/Y increase in October. Prices for final demand services advanced 2.9% Y/Y, up slightly from September’s 2.8% Y/Y gain.
Import prices (which exclude tariffs) were 0.1% higher in November compared to a year ago. The October import price report was not conducted due to the 70-day Federal government shutdown, so a monthly comparison is unavailable. Export prices were up 3.3% Y/Y.
Existing home sales jumped 5.1% in December to a 4.35 million seasonally adjusted annual rate (SAAR). Inventories dropped 18.1%. Compared to a year earlier, sales rose 1.4% Y/Y while inventories grew 3.5% Y/Y. At the current sales pace, inventories represent 3.3 months’ supply, up slightly from 3.2 months’ supply a year ago. The median sales price rose 0.4% Y/Y to $405,400. The median price peaked at $432,700 back in June 2025.
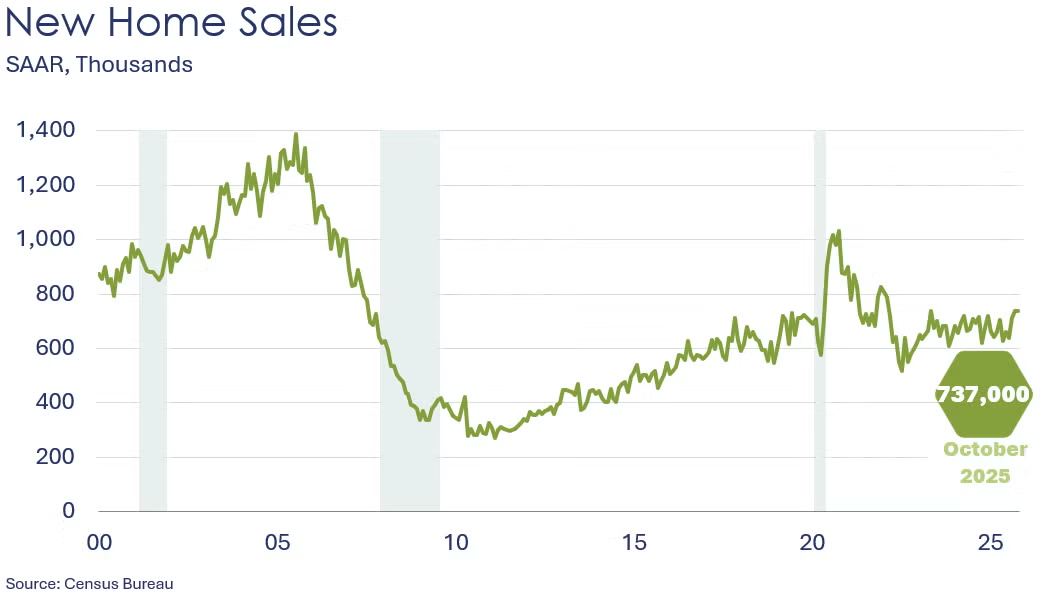
New home sales were flat in October after rising 3.8% in September, when they reached their highest level since May 2023. October sales dropped in all regions except for the South. Home sales jumped 18.7% Y/Y. Inventories were unchanged from September but rose 1.7% from a year ago. At the current sales pace, inventories represent a 7.9-month supply, unchanged from September and down from 9.3 months a year earlier. The median sales price was down 8.0% Y/Y to $392,300. This is 14.8% below the median price in October 2022, where it peaked at 460,300.
Headline retail and food service sales rose 0.6% in November, following a revised 0.1% drop in October. November sales increased at sporting goods & hobby stores, miscellaneous retailers, gas stations, building & garden centers, motor vehicle & parts dealers, clothing & accessory stores, restaurants & bars, online platforms, and health & personal care stores. On the other hand, sales were essentially flat at grocery stores, electronics retailers, furniture & home furnishing stores, and general merchandise stores. November core retail sales (excluding vehicle & gas station sales) increased 0.4%, the same increase seen in October.
The NFIB’s small business optimism index rose 0.5 points to 99.5 in December. The gain was led by higher expectations for better business conditions. The uncertainty index fell to its lowest reading since June 2024.
Combined business inventories rose 0.3% in October, propelled by gains in retail and wholesale inventories. Manufacturing inventories were flat. Combined business sales dipped 0.2%, with retail and wholesale sales dropping while manufacturing sales increased slightly. The inventories-to-sales ratio inched up from 1.37 in September to 1.38. A year earlier, the ratio was 1.41.
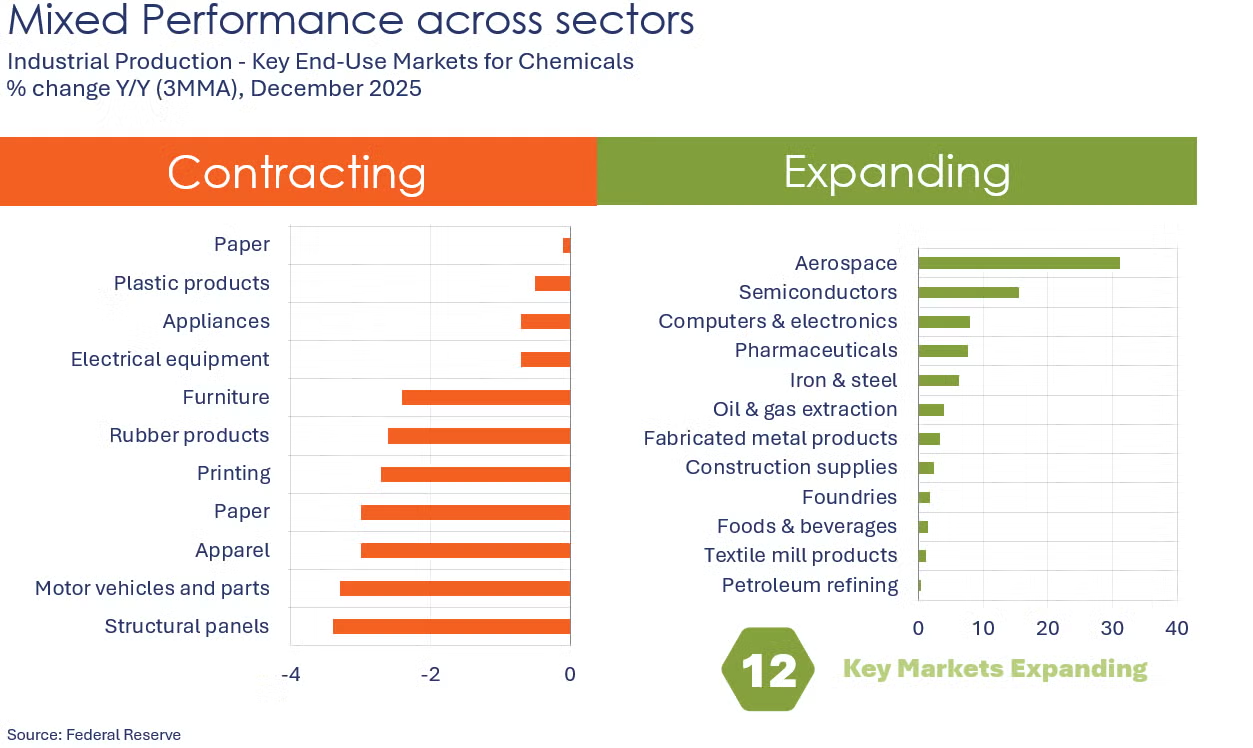
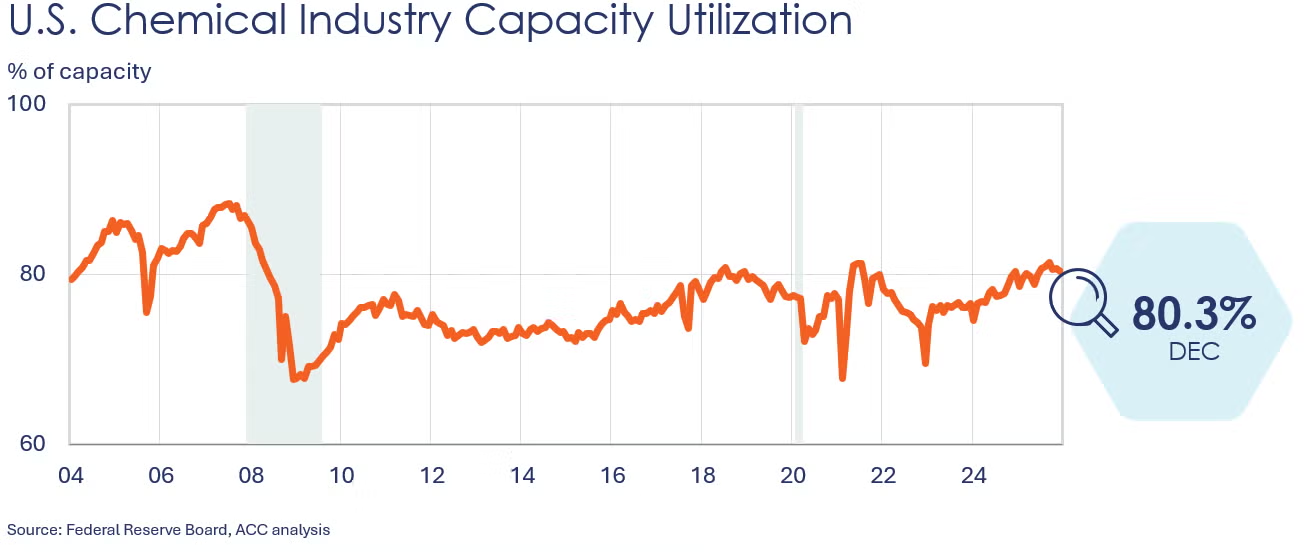
Industrial production expanded for a second month in December, up by 0.4%. A strong gain in utility output and a modest increase in manufacturing production offset lower output from the mining sector. Within manufacturing, the largest gains were in electrical equipment, aerospace, and petroleum products. The largest declines were in wood products, nonmetallic mineral products, textiles, apparel, and motor vehicles & parts. Overall industrial production was up 2.0% Y/Y, as was manufacturing output. Capacity utilization rose 0.2 points to 76.3%, its highest reading since July. Capacity utilization remains well below its long-term average of 79.5%.
A first look at manufacturing activity for January, the new year started on a bit of an upswing. The Philadelphia Fed Manufacturing Survey rose 21.4 points to +12.6 in January reflecting rising shipments and new orders. Manufacturing also expanded slightly in New York State, according to the Empire State Manufacturing Survey which rose 11.4 points to +7.7
Fed Beige Book
• Overall economic activity increased at a slight to modest pace in eight of the twelve Federal Reserve Districts, with three Districts reporting no change and one reporting a modest decline. This marks an improvement over the last three report cycles where a majority of Districts reported little change.
• Most banks reported slight to modest growth in consumer spending this cycle, largely attributed to the holiday shopping season.
• Several Districts also noted that spending was stronger among higher-income consumers with increased spending on luxury goods, travel, tourism, and experiential activities. Meanwhile, low to moderate income consumers were seen to be increasingly price sensitive and hesitant to spend on nonessential goods and services.
• Auto sales were little changed to down across most Districts.
• Manufacturing activity varied with five Districts reporting growth and six reporting contraction.
• Residential real estate sales, construction, and lending activity softened in the majority of Districts that report on the sector.
• Agriculture conditions were largely unchanged with only Atlanta reporting a modest decline due to weaker demand for exported commodities.
• Energy demand and production was flat to down slightly.
• Outlooks for future activity were mildly optimistic with most expecting slight to modest growth in coming months.
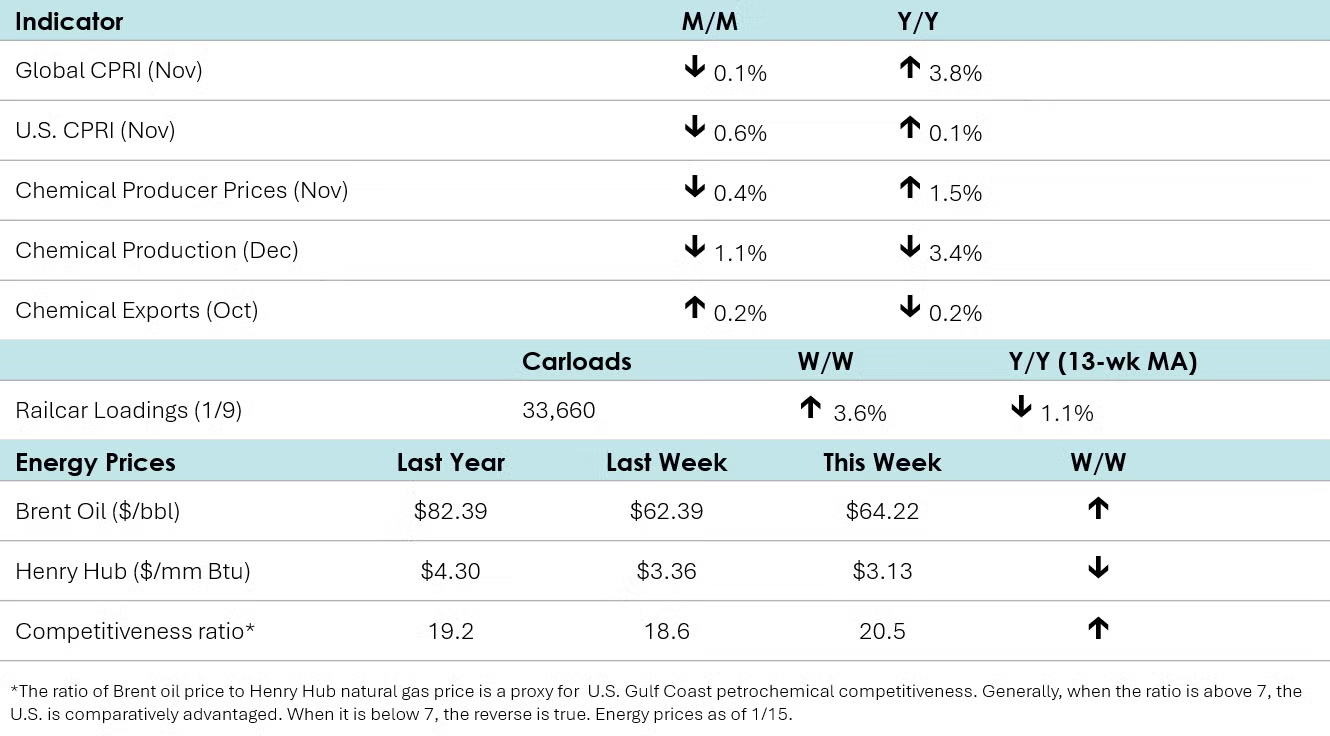
According to data released by the Association of American Railroads, chemical railcar loadings were up to 33,660 for the week ending January 10th. Loadings were down 1.1% Y/Y on a 13-week moving average basis.
Within the comments in the Federal Beige Book:
• “Petrochemical industry contacts reported moderating demand, particularly for chemicals used in appliances, housing, and automotive sectors.” (Atlanta)
• “Petrochemical plant expansions and carbon capture projects faced schedule delays attributed to uncertainty.” (Atlanta)
• “Recent weakness [in factory output] was driven primarily by nondurable goods production, including chemicals.” (Dallas)
• “Petrochemical production fell, with contacts saying some customers were holding back or canceling orders due to anemic global demand and the high level of uncertainty, particularly regarding trade policy.” (Dallas)
Chemical production fell 1.1% in December, following revised flat growth in December, and a decline in October. There were declines across all categories, except organic chemicals, synthetic rubber, and coatings. Compared to a year ago, chemical production was down 3.4% Y/Y. With the preliminary December data, chemical production was up 1.3% in 2025 compared to 2024.
Chemical producer prices dropped 0.4% in November after losing 0.5% in October. Price declines were seen in synthetic rubber, bulk petrochemicals & organics, other specialties, plastic resins, manufactured fibers, specialty chemicals, basic chemicals, and basic & specialty chemicals. On the flip side, prices rose for inorganic chemicals, agricultural chemicals, and coatings. Consumer products prices were flat. Compared to a year ago, chemical producer prices were up 1.5% Y/Y in November, the same Y/Y increase registered in October.
After six consecutive months of decline, chemical exports edged up 0.2% in October 2025, supported by gains in consumer products and specialties that offset lower exports of basic and agricultural chemicals. Imports also rose, up 1.8%, reversing part of September’s sharp drop, with most major categories posting increases. Inorganic chemicals saw the largest month over month rise.
Compared to a year earlier, exports were essentially flat (−0.2%) while imports plunged −14.6%, underscoring that exports remain relatively less impacted than imports. The trade surplus narrowed slightly to $3.5 billion, down from $3.7 billion in September.
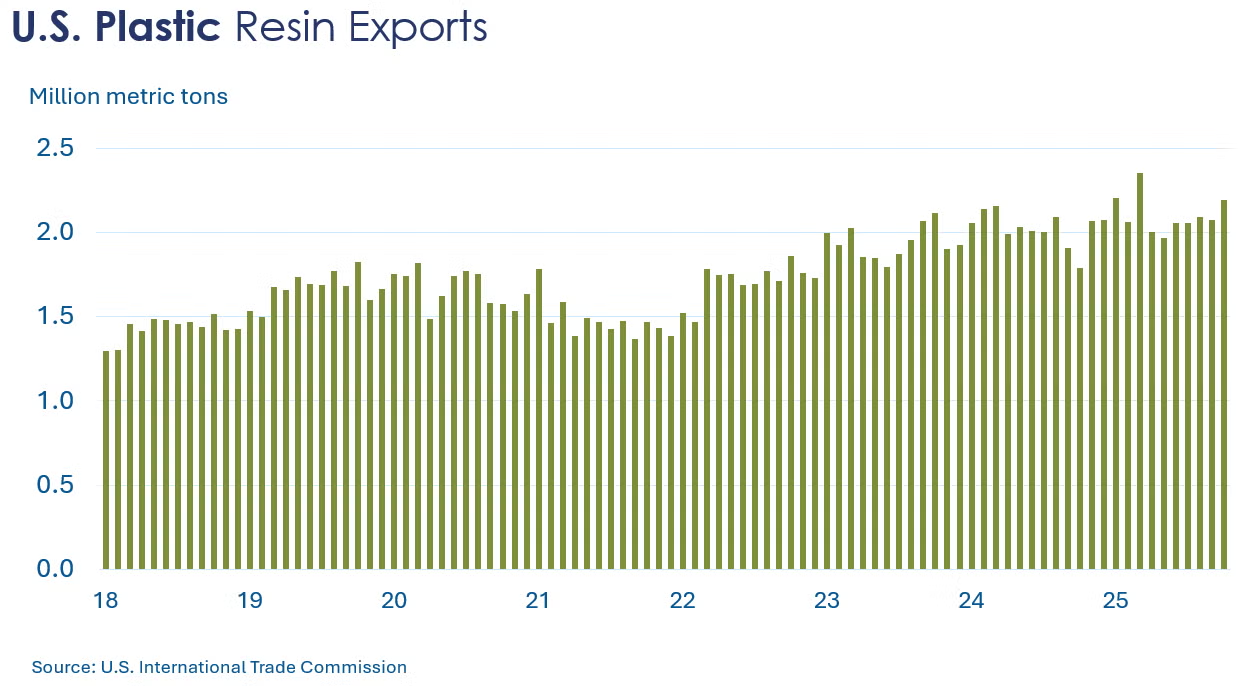
U.S. plastic resin exports remained resilient, up 5.6% to 2.2 million metric tons in October. Compared to the same time last year, resin exports increased by 23%.
Following a 0.1% decline in October 2025, the ACC’s Global Chemical Production Regional Index (Global CPRI) fell another 0.1% in November. Production increased in Asia, South America, and the former Soviet Union countries, but declined in all other regions. Asia Pacific output rose despite softer conditions in China, while European production remained weak amid ongoing trade related uncertainty. North American output continued to contract, while production in South America stabilized. Most segments weakened, with agricultural chemicals experiencing the largest decline. Year over year, global production was up 3.8%.
For more details, check out our new CPRI Dashboard.
The U.S. CPRI fell by 0.6% in November. This index measures chemical production trends based on a three-month moving average to smooth out month-to-month volatility. Production declined in all regions. Overall, the U.S. CPRI was 0.1% higher than it was a year ago.
Energy Wrap-Up
• Oil prices were up compared to last week on heightened tensions with Iran
• U.S. natural gas prices remained comparatively stable despite the arrival of a polar vortex across much of the nation.
• The combined oil & gas rig count fell by four to 433.
For More Information
ACC members can access additional data, economic analyses, presentations, outlooks, and weekly economic updates through ACCexchange: https://accexchange.sharepoint.com/Economics/SitePages/Home.aspx
In addition to this weekly report, ACC offers numerous other economic data that cover worldwide production, trade, shipments, inventories, price indices, energy, employment, investment, R&D, EH&S, financial performance measures, macroeconomic data, plus much more. To order, visit http://store.americanchemistry.com/.
Every effort has been made in the preparation of this weekly report to provide the best available information and analysis. However, neither the American Chemistry Council, nor any of its employees, agents or other assigns makes any warranty, expressed or implied, or assumes any liability or responsibility for any use, or the results of such use, of any information or data disclosed in this material.
Contact us at ACC_EconomicsDepartment@americanchemistry.com.