Running tab of macro indicators: 11 out of 20
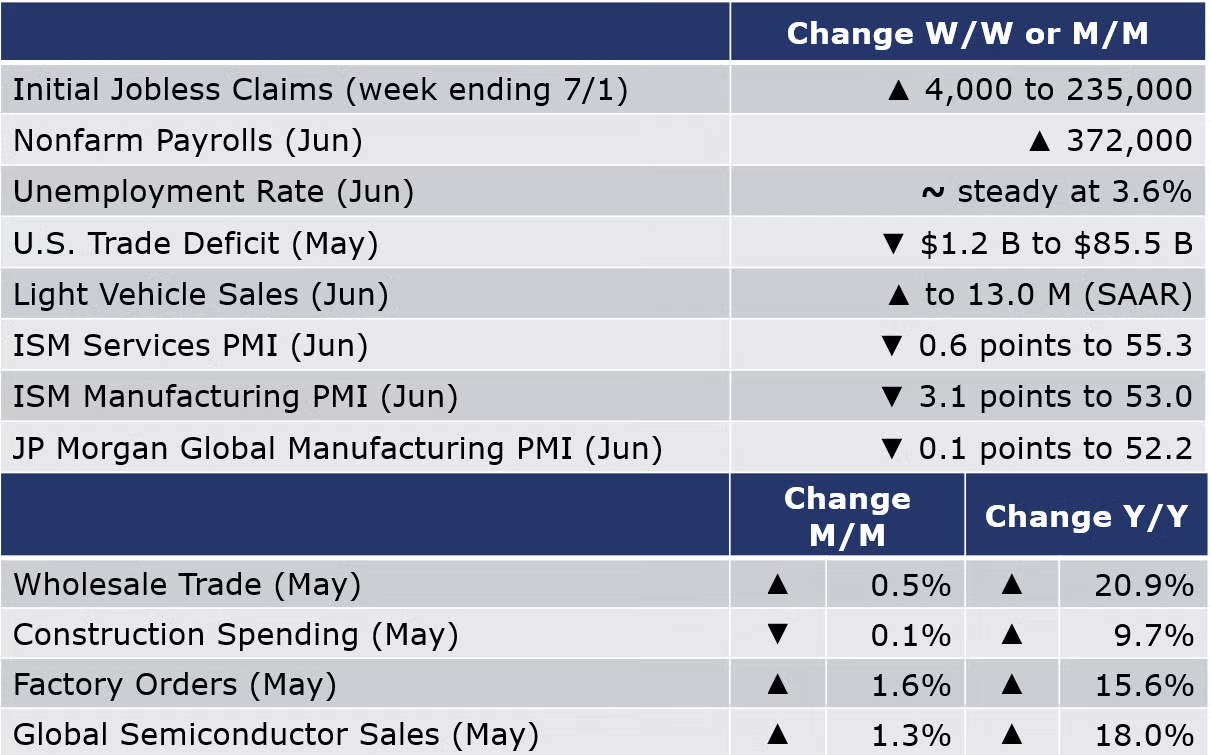
Nonfarm payrolls rose by a better-than-expected 372,000, in line with recent increases. Despite the gain, payroll employment remains slightly below its February 2020 (pre-Covid) level. There were gains across all major segments (except government). Manufacturing employment expanded by 29,000. Average hourly earnings rose by 5.1% Y/Y, the slowest annual gain since December. The unemployment rate remained stable at 3.6% for a fourth consecutive month. The employment estimate from the separate household survey showed a decline which was balanced by lower labor force participation.
The Job Openings and Labor Turnover survey (JOLTS) showed that the number of job openings eased to 11.3 million in May (down from 11.7 in April). This is still an historically high level but suggests that the labor market is beginning to cool. Comparing the number of jobs available in the U.S. economy (the number of employed people plus the number of job openings) to the labor force, there are 5.3 million fewer workers than jobs. The deficit has eased over the past two months, but a large imbalance remains. The number of new jobless claims rose by 4,000 to 235,000 during the week ending 2 July. Continued claims rose (by 13,570) to 1.38 million for the week ending 18 June. The insured unemployment rate for the week ending June 25 was 1.0%, slightly higher than the prior week (0.9%).
The U.S. trade deficit narrowed to $85.5 billion in May as the monthly rise in exports exceeded the monthly rise in imports. Exports were up 1.2% to $259.9 billion while imports were up 0.6% to $341.4 billion. Exports of goods increased driven by higher exports of industrial supplies and materials (including natural gas and other petroleum products), soybeans, civilian aircraft, and medical equipment. The decline in imported goods reflects lower imports of consumer goods, industrial supplies and materials, and capital goods. Imports from China, the largest source of U.S. imported goods, increased in May reflecting fewer shutdowns that had recently slowed their industrial sector and disrupted supply chains.
Construction spending fell by 0.1% in May as a small gain in residential offset declines in nonresidential spending (both privately- and publicly-funded). Compared to a year ago, spending was up 9.7% Y/Y.
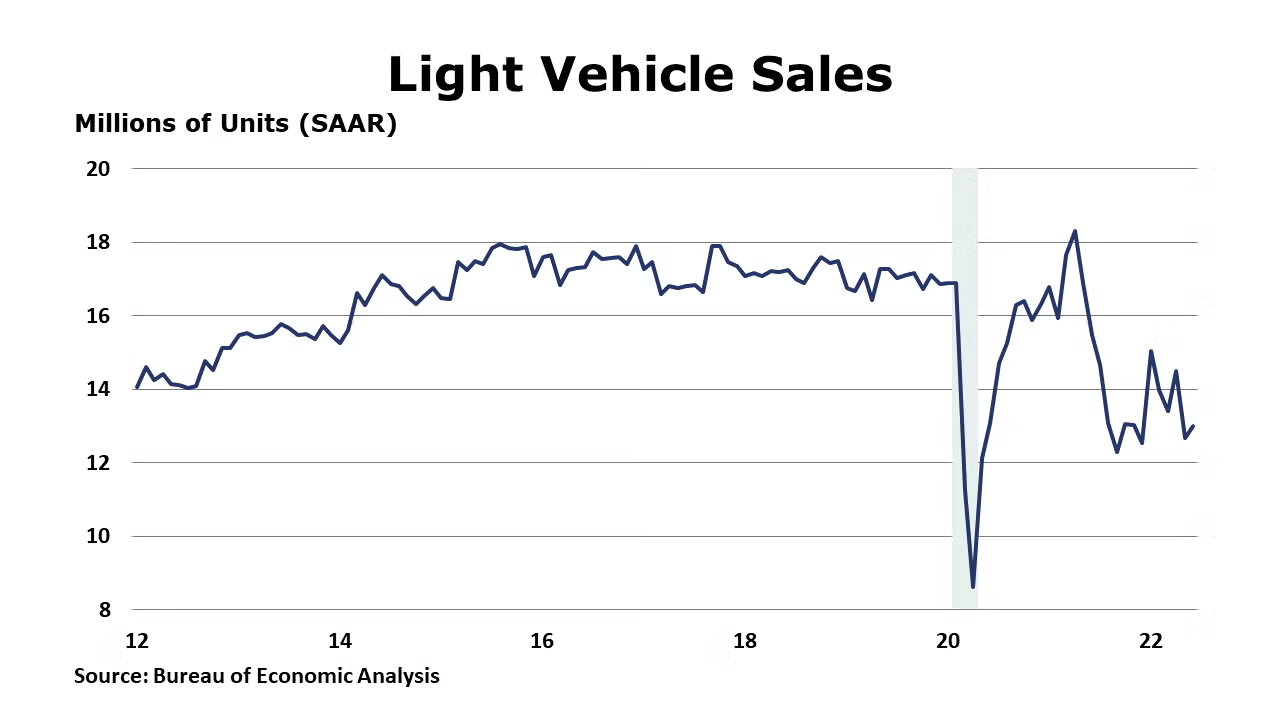
Continuing to struggle with supply chain disruptions, light vehicle sales edged higher in June to a 13.0 million seasonally adjusted annual rate.
Sales at the wholesale level continued to expand in May, up by 0.5%, with the largest gains in machinery, computer equipment, chemicals, and farm products. Wholesale inventories also rose, by 1.8% with gains across all categories. Compared to a year ago, sales were up 20.9% Y/Y while inventories were up 24.7% Y/Y. The inventories to sales ratio ticked higher from 1.25 in April to 1.26 in May. A year ago, the ratio was 1.22.
The ISM Services PMI fell by 0.6 percentage points to 55.3 in June. Although a reading above 50 indicates expansion, it was the lowest reading since May 2020. Business activity continued to expand, but at a slower pace. New orders and export orders grew, but at a slower pace; business activity grew at a faster pace. Employment, inventories and imports contracted. All 18 industries covered reported growth in June.
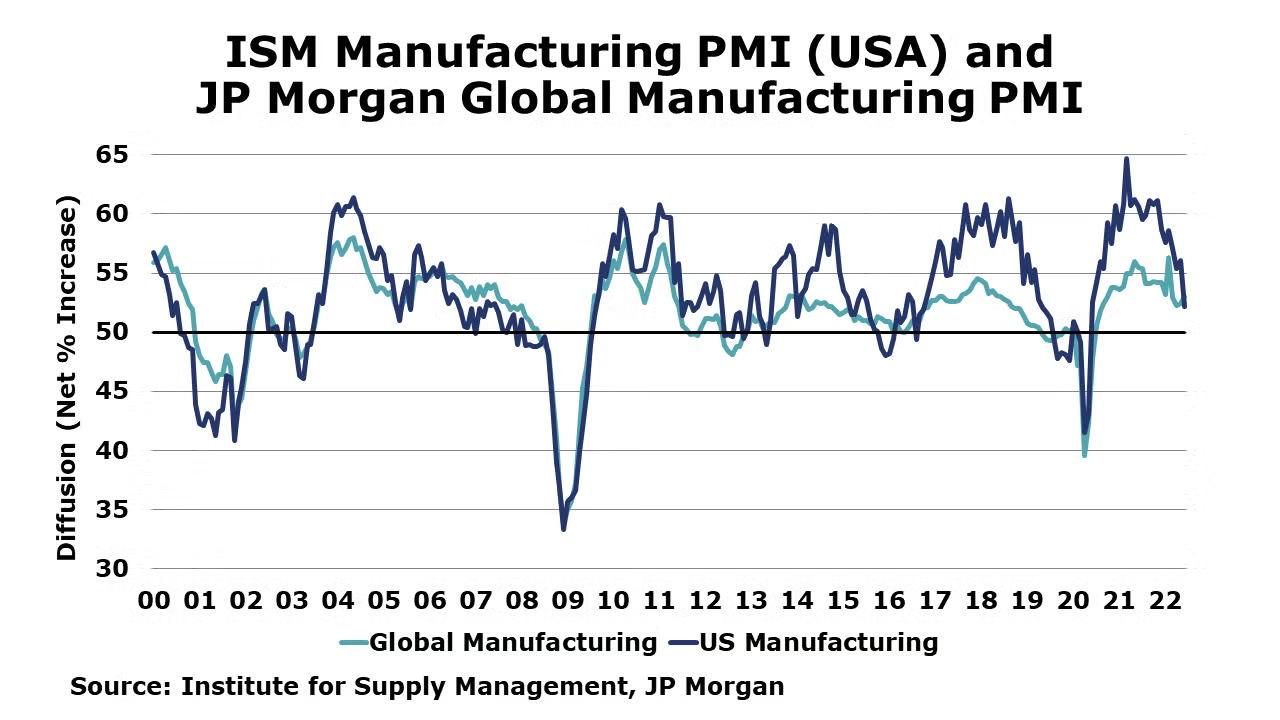
The ISM Manufacturing PMI fell by 3.1 points in June to 53.0, suggesting that manufacturing activity continued to expand in June, but at a slower pace. While production expanded for a 25th consecutive month, the new orders component showed a contraction for the first time in two years. Prices continued to rise at a slower pace in June and exports continued to expand. The supplier deliveries component continued to signal that deliveries slowed at a slower rate, suggesting that supply chain pressures continue to ease. Lead times for capital goods and production materials continued to increase, however. Global manufacturing continued to expand at a slower pace in June with the JP Morgan Global Manufacturing PMI easing by 0.1 points to 52.2, a 22-month low. The production component rose for the first time in three months as China eased Covid restrictions. Growth in output was strongest in the consumer goods sector, which hit a seven-month high and intermediate and investment goods production expanded in June following contraction in April and May. Despite the improvement in production, new orders slowed and new export orders declined. Growth expectations conveyed weaker sentiment.
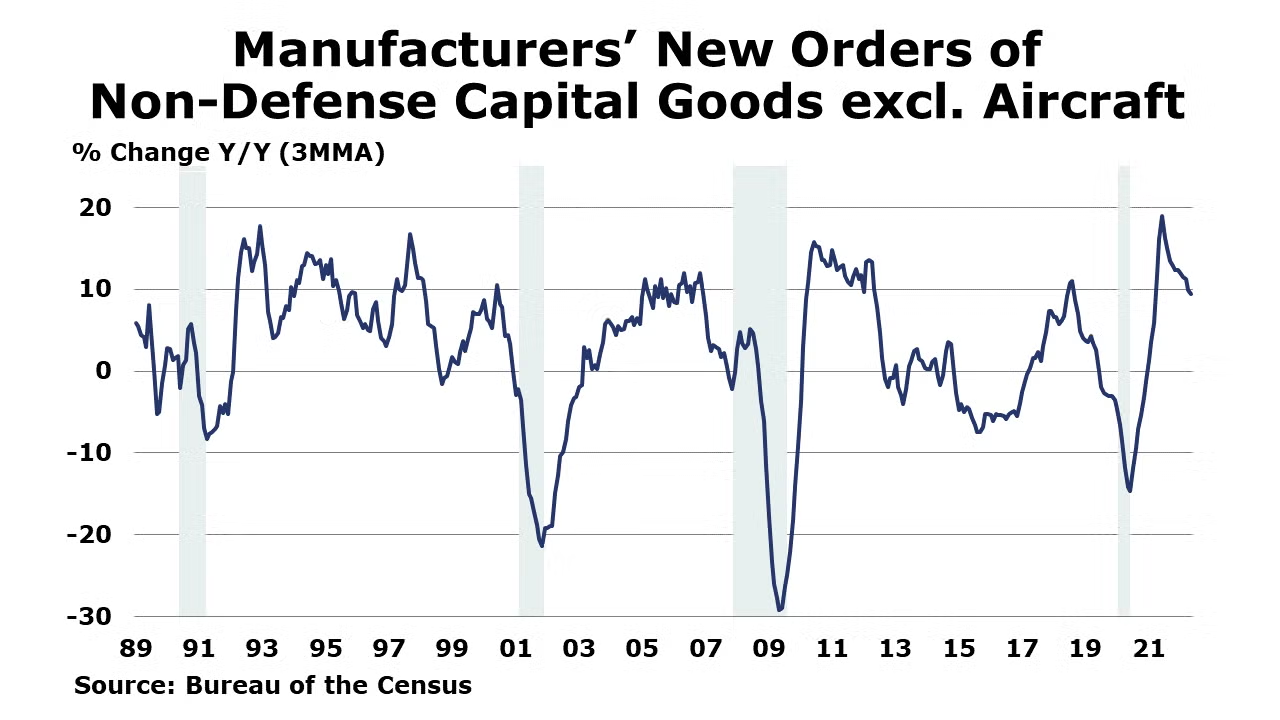
Factory orders continued to expand in May, up 1.6%, with gains across most major segments. New orders for core business goods were up 0.6%. Headline orders were up 15.6% while core business orders were up 10.0% Y/Y. Unfilled orders, a measure of the manufacturing pipeline, expanded by 0.4%, a little lower than previous months’ gains. Manufacturing shipments were up 1.8% and inventories were up 1.3%. All these measures reflect nominal values (i.e., not adjusted for inflation). The ratio of inventories-to-shipments was steady at 1.47 for a third month. A year ago, the ratio was 1.52. The report suggests there was momentum in manufacturing through May, though several recent surveys indicate that activity weakened into June.
Global semiconductor sales rose 1.3% to $51.8 billion during May. Sales in Europe fell, but rose in other regions, with the largest gains in Japan. Compared to a year ago, sales were up 18.0% Y/Y.
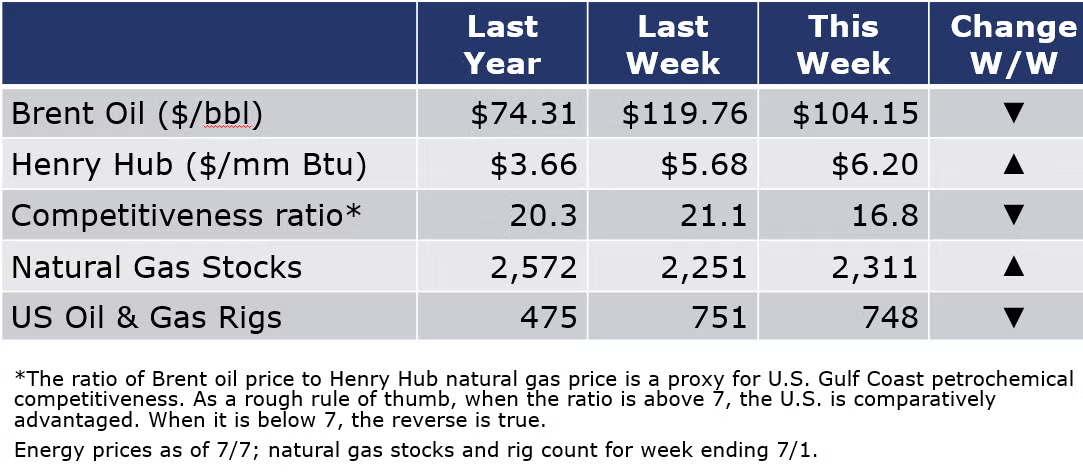
Oil prices were lower this week (even dipping below $100/barrel at times), as growing fears about recession offset strong summer demand. Refinery utilization rates continued to move higher. Natural gas prices trended lower earlier in the week but moved higher on Thursday’s storage report that showed a lower-than-expected build. Natural gas prices in Europe continue to surge. TTF futures for August delivery were up sharply following a short-lived strike by energy workers in Norway. Following a surge the previous week, the rig count was down by 3 to 748 for the week ending 7/1.
For the business of chemistry, the indicators still bring to mind a green banner for basic and specialty chemicals.
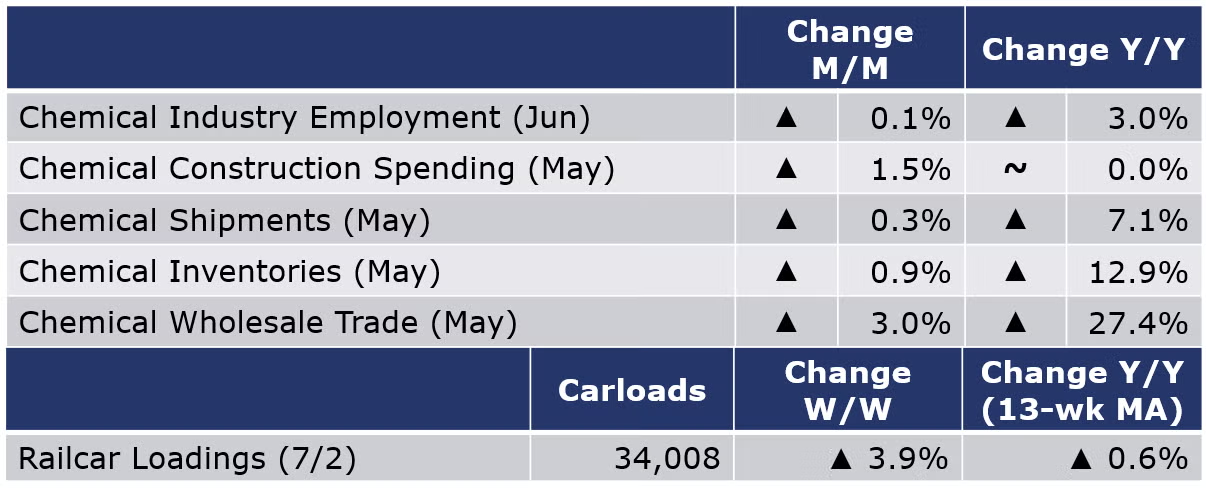
According to data released by the Association of American Railroads, chemical railcar loadings were up 3.9% for the week ending 2 July. Loadings were up 0.6% Y/Y (13-week MA), up 4.9% YTD/YTD and have been on the rise for six of the last 13 weeks.
Within the details of the ISM Manufacturing PMI report, the chemical industry was one of the industries reporting growth in June. Production and inventories expanded, but new orders, order backlogs, imports and employment declined. Supplier deliveries were reported to be slower. Customer inventories were reported to be “too low”. One chemical industry respondent noted that new orders have stabilized and not increased.
Chemical industry employment (including pharmaceuticals) edged higher by 1,200 (0.1%) in June as gains in production workers offset a decline in supervisory and non-production workers. Compared to a year ago, chemical industry employment was up by 25,900 (3.0% Y/Y). Average hourly wages in chemical manufacturing rose 1.6% Y/Y to $27.19. The average workweek eased by 0.2 hours to 41.0 hours. Combined with employment gains, the labor input into the chemical industry was essentially flat which conflicts with the ISM Manufacturing PMI report that suggested the chemical industry experienced growth in June.
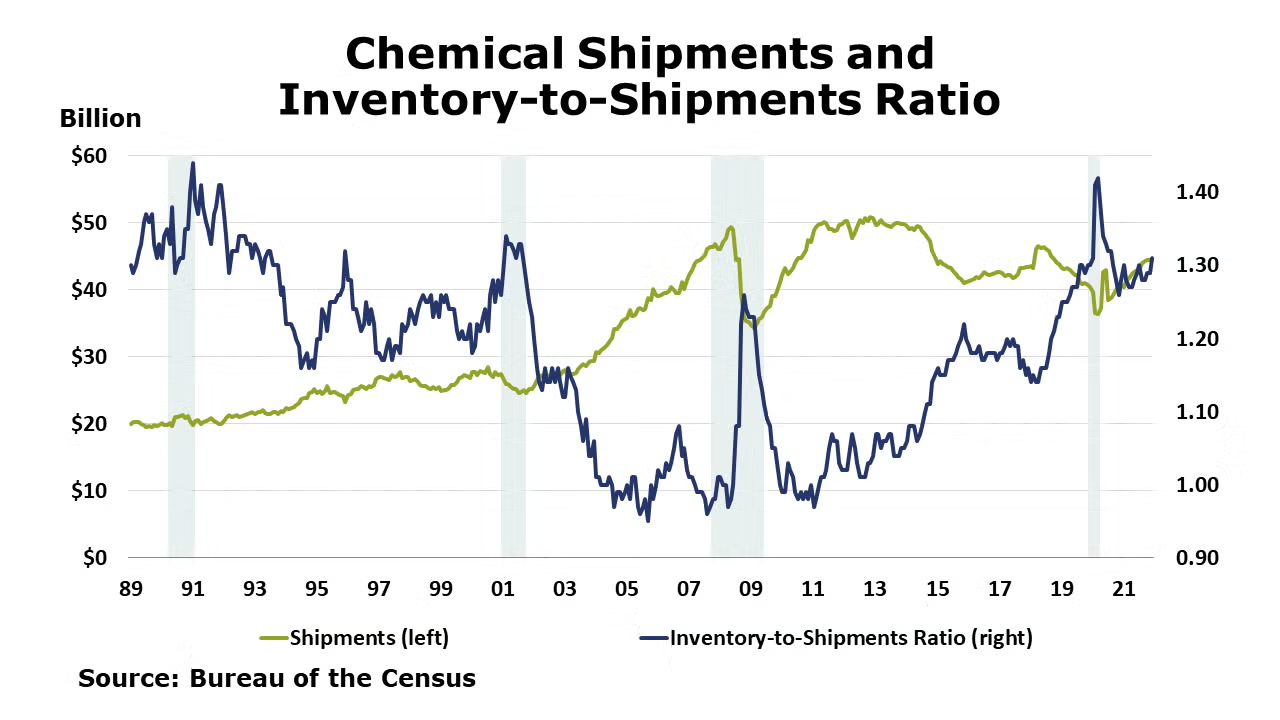
Following a 0.2% decline in April, chemical shipments rose 0.3% in May. There were gains across all major segments. Chemical inventories also rose, up by 0.9%, the 18th consecutive monthly gain. The inventories-to-sales ratio for chemicals remained stable at 1.34. A year ago, the ratio was 1.27. Compared to a year ago, shipments were up 7.1% Y/Y while inventories were up 12.9% Y/Y.
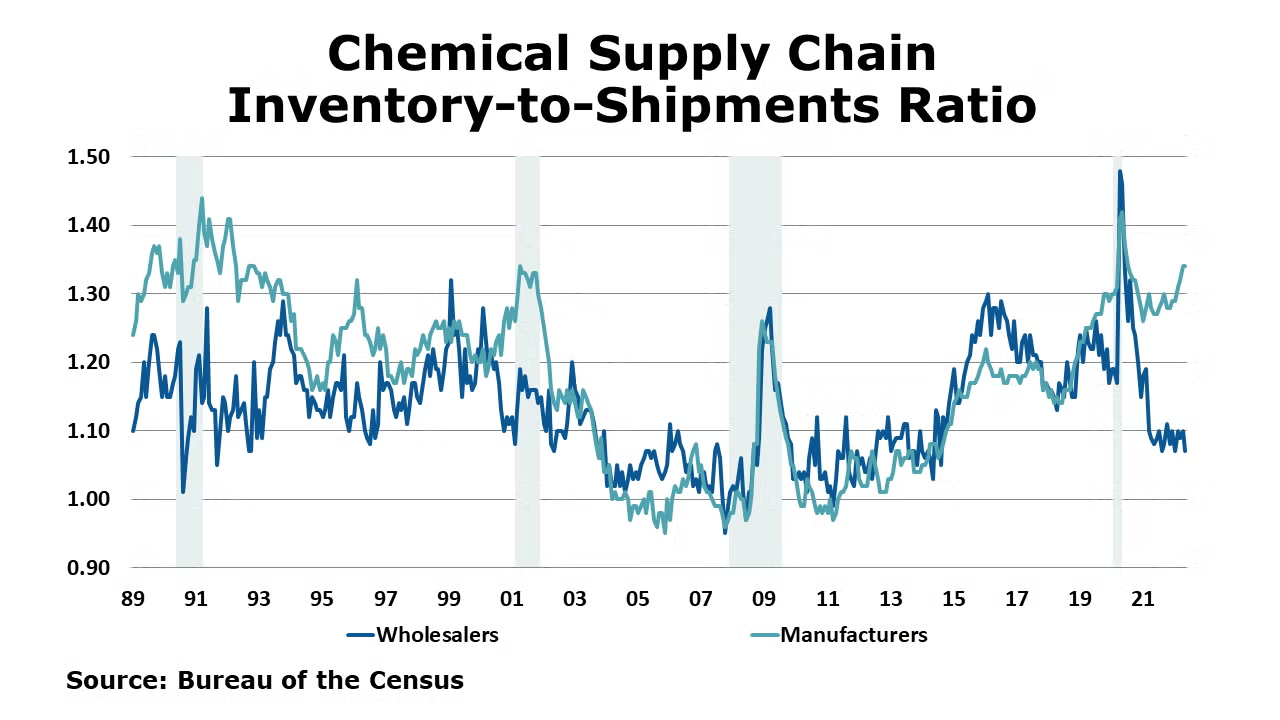
Sales of chemicals at the wholesale level rose by 3.0% in May following a smaller gain in April. Inventories also rose, by 0.2%. Compared to a year ago, wholesale inventories were up 24.5% Y/Y while sales were up by 27.4% Y/Y. The inventories-to-sales ratio dipped to 1.07 in May from 1.10 in April. A year ago, the ratio was 1.09. Wholesale inventories have been comparatively lean for more than a year as supply chain challenges have persisted.
Chemical industry construction spending rose for a second straight month, up by 1.5% to $28.1 billion. Compared to a year ago, construction spending was flat.
Note On the Color Codes
The banner colors represent observations about the current conditions in the overall economy and the business chemistry. For the overall economy we keep a running tab of 20 indicators. The banner color for the macroeconomic section is determined as follows:
Green – 13 or more positives
Yellow – between 8 and 12 positives
Red – 7 or fewer positives
For the chemical industry there are fewer indicators available. As a result we rely upon judgment whether production in the industry (defined as chemicals excluding pharmaceuticals) has increased or decreased three consecutive months.
For More Information
ACC members can access additional data, economic analyses, presentations, outlooks, and weekly economic updates through MemberExchange.
In addition to this weekly report, ACC offers numerous other economic data that cover worldwide production, trade, shipments, inventories, price indices, energy, employment, investment, R&D, EH&S, financial performance measures, macroeconomic data, plus much more. To order, visit https://store.americanchemistry.com/.
Every effort has been made in the preparation of this weekly report to provide the best available information and analysis. However, neither the American Chemistry Council, nor any of its employees, agents or other assigns makes any warranty, expressed or implied, or assumes any liability or responsibility for any use, or the results of such use, of any information or data disclosed in this material.
Contact us at ACC_EconomicsDepartment@americanchemistry.com