Running tab of macro indicators: 11 out of 20
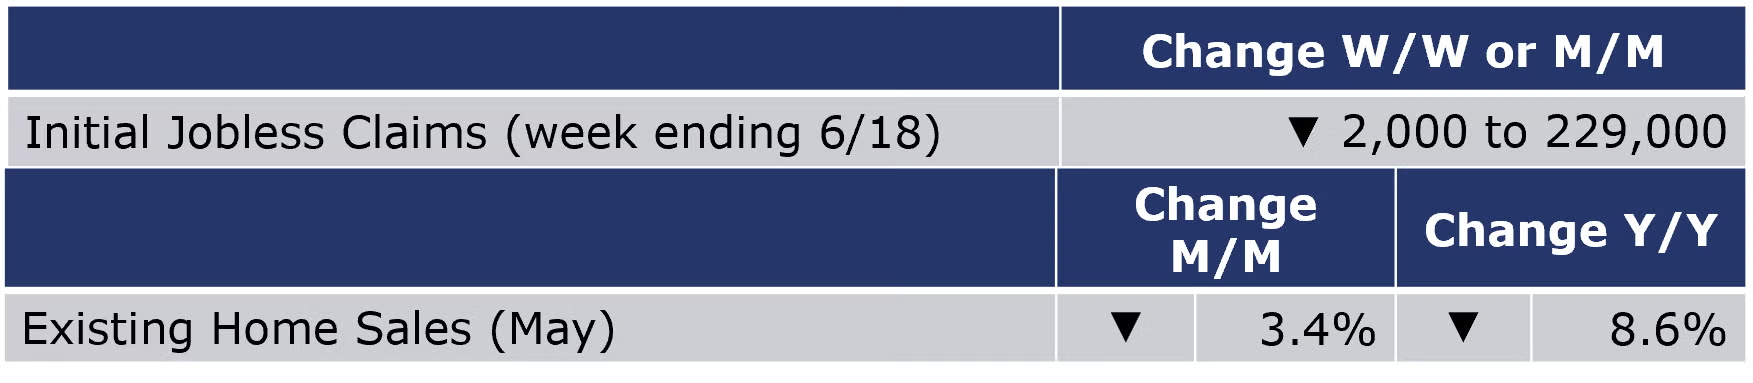
The number of new jobless claims fell by 2,000 to 229,000 during the week ending 18 June. Continuing claims increased by 5,000 to 1.32 million, and the insured unemployment rate for the week ending 11 June was unchanged at 0.9%.
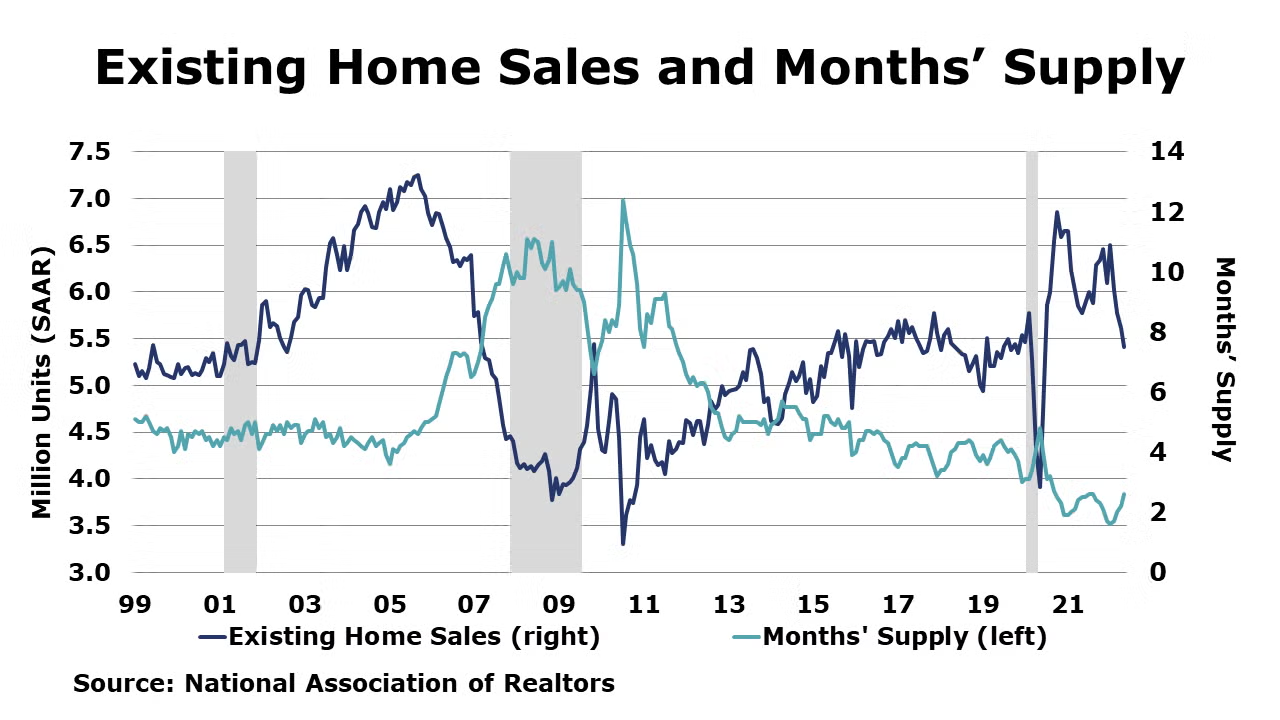
As widely expected, existing home sales fell 3.4% in May to a 5.41 million seasonally adjusted annual pace. This was the weakest rate since June 2020 and was 8.6% lower than a year ago. Inventories rose 12.6% to 1.16 million homes for sale or under contract, a level off 4.1% Y/Y. The level of inventories represents a lean 2.6-month supply. With historically lean inventories, the median sales price continued to rise, up 14.8% Y/Y to a record $407,600.
SURVEY OF ECONOMIC FORECASTERS
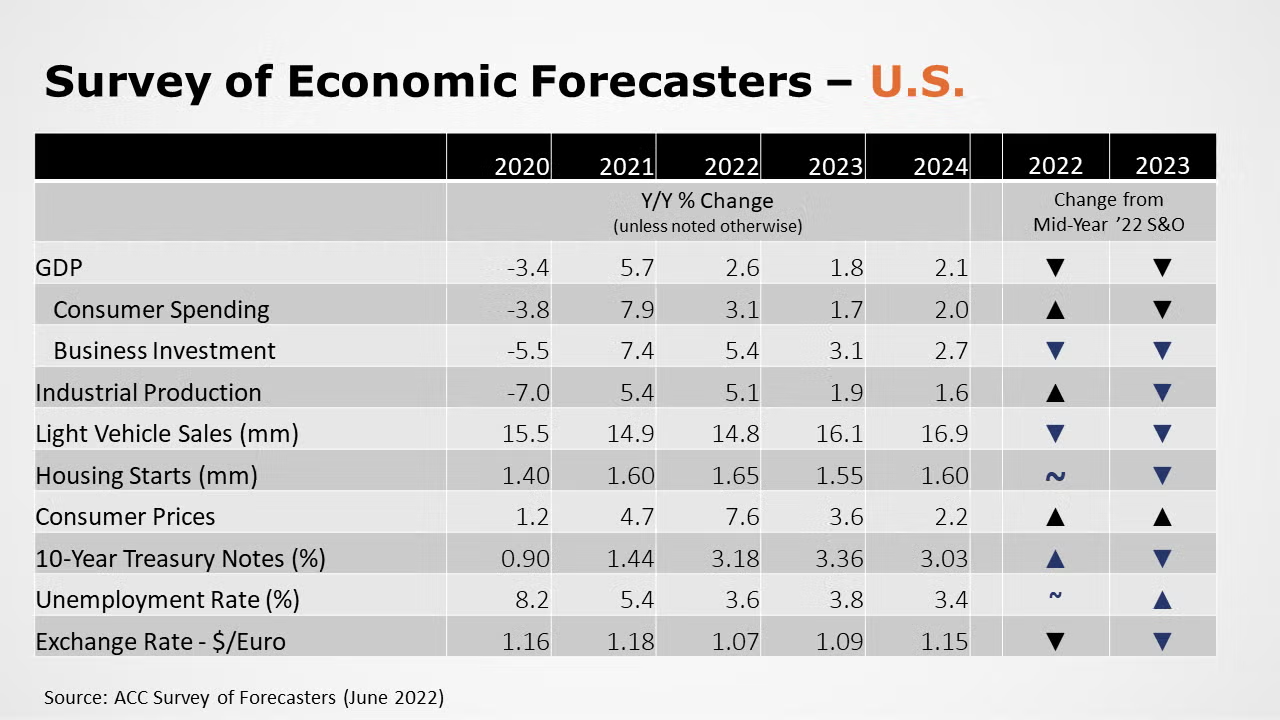
• The outlook for 2022 continued to weaken with ongoing inflationary pressures, disruptions related to the war in Ukraine, and aggressive tightening of monetary policy by the Federal Reserve.
• Expectations into 2023 were also lower for many indicators compared to a month ago.
• U.S. GDP is expected to grow by 2.6% in 2022 as the highest inflation in decades erodes spending and higher interest rates raise borrowing costs. In 2023, forecasters continue to expect the U.S. economy to grow by 1.8%, a pace below its long-term trend.
• Consumer spending is expected to increase by 3.1% in 2022 before slowing further to a 1.7% gain in 2023.
• Business fixed investment will be a larger contributor to GDP growth in 2022 with an expected 5.4% gain. In 2023, growth in business investment is expected to slow to a 3.1% Y/Y pace.
• Industrial production is expected to rise 5.1% in 2022 (as manufacturing continues its momentum and oil & gas activity expands) and 1.9% in 2023.
• With continued supply chain challenges for vehicle manufacturers, expectations for light vehicle sales were lowered again to 14.8 million in 2022 and rising to 16.1 million in 2023.
• Expectations for housing starts were the same compared to last month at 1.65 million in 2022 but lowered to 1.55 million in 2023.
• The unemployment rate is expected to average 3.6% in 2022 and 3.8% in 2023.
• Inflation continues to accelerate through mid-year. Expectations for gains in consumer prices continued to grow compared to our mid-year outlook with forecasters looking for inflation of 7.6% in 2022, before easing to a 3.6% pace in 2023, as constraints ease.
• Compared to last month, expectations for interest rates (10-year Treasury) continued to move higher for 2022, as the Fed implements aggressive tightening.
• Following the Russian invasion of Ukraine and Covid lockdowns in China, forecasters have downgraded their expectations for the global economy. Global GDP is expected to rise by 3.2% in 2022 and 2023. Global industrial production, hampered by ongoing supply chain challenges in addition to the disruptions from Chinese lockdowns and the war in Ukraine, will rise 3.9% in 2022 and 3.6% in 2023.
• In addition to ongoing supply chain challenges, slower growth in global GDP and industrial production will be reflected in softer projections for global trade. Following a 10.4% rebound in 2021, global trade volumes are expected to rise by 3.6% in 2022 and 3.2% in 2023, both lower than previously expected.
Energy prices moved lower during the week on mounting concerns about a potential recession in the U.S. Natural gas inventories rose by 74 BCF at the end of last week, but natural gas in storage remains 13.2% below the five-year average, an improving comparison. The combined oil and gas rig count rose by seven to 738 during the week ending June 17.
For the business of chemistry, the indicators still bring to mind a green banner for basic and specialty chemicals.
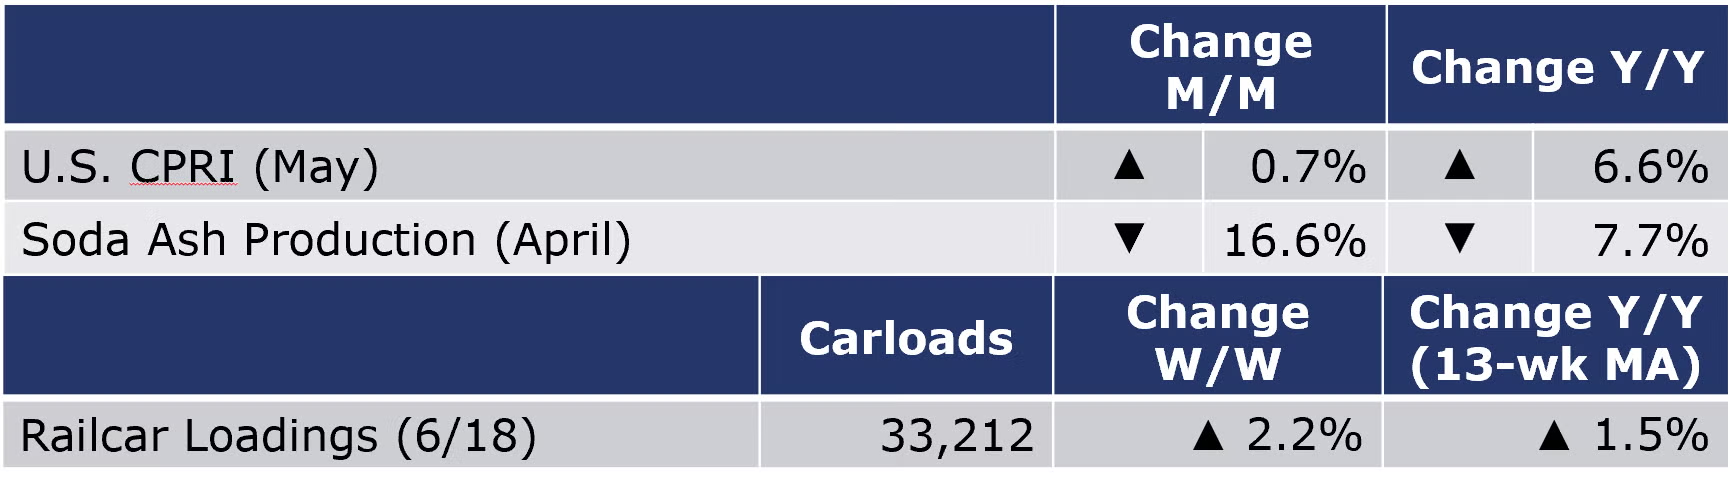
According to data released by the Association of American Railroads, chemical railcar loadings were up 2.2% W/W to 33,212 for the week ending 18 June. Loadings were up 1.5% Y/Y (13-week MA), up 5.3% YTD/YTD and have been on the rise for 7 of the last 13 weeks.
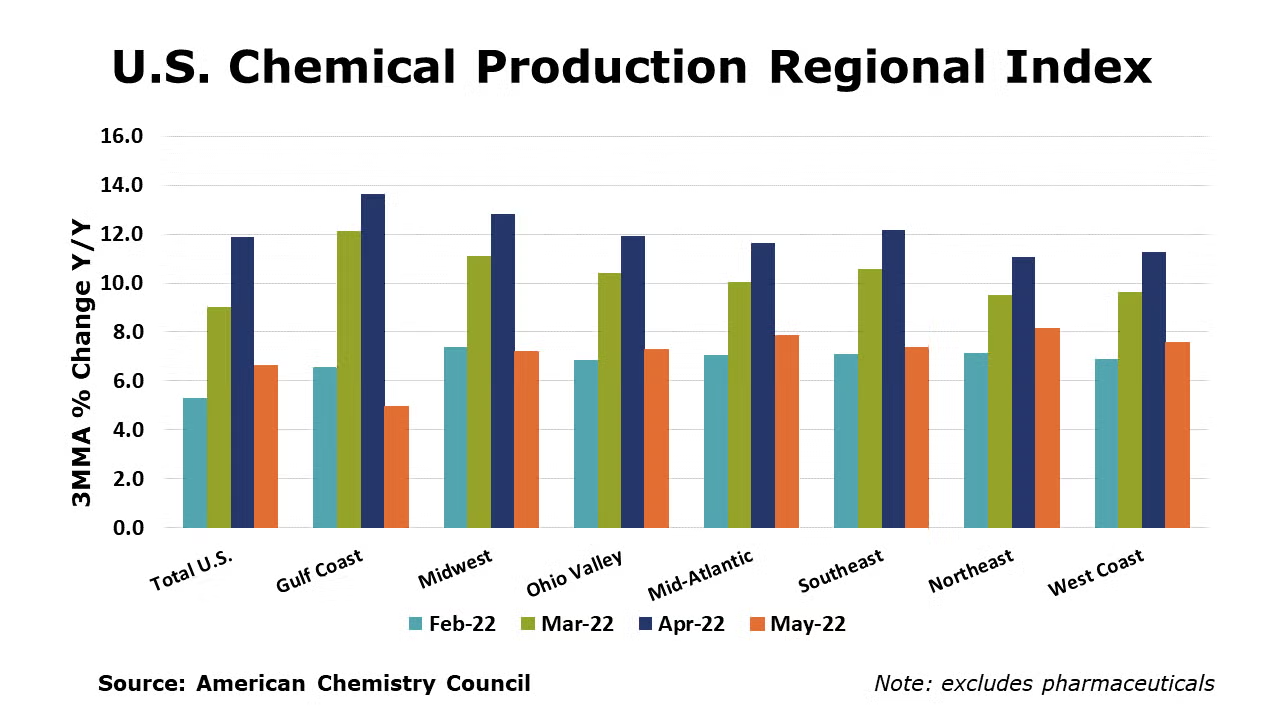
The U.S. Chemical Production Regional Index (U.S. CPRI) was 0.7% higher in May following gains of 1.3% in April and 0.6% in March. Chemical output rose across all regions. The U.S. CPRI is measured as a three-month moving average (3MMA). Compared with May 2021, U.S. chemical production was ahead by 6.6%, a slower comparison from last month, but continues to reflect the steep output losses in 2021 from winter storm Uri. Chemical production was higher than a year ago in all regions.
On a 3MMA basis, chemical production was higher in nearly all segments. The largest gains were in the production of coatings, adhesives, crop protection chemicals, inorganic chemicals, synthetic rubber, industrial gases, synthetic dyes and pigments, other specialty chemicals, manufactured fibers and consumer products. Output of organic chemicals edged lower, and output of plastic resins was flat.
As nearly all manufactured goods are produced using chemistry in some form, manufacturing activity is an important indicator for chemical demand. Manufacturing output continued to expand in May, by 0.5% (3MMA). The 3MMA trend in manufacturing production was broad-based, with gains in the output of motor vehicles, rubber products, oil & gas, aerospace, iron & steel, refining, printing, paper, apparel, electronics, structural panels, and furniture.
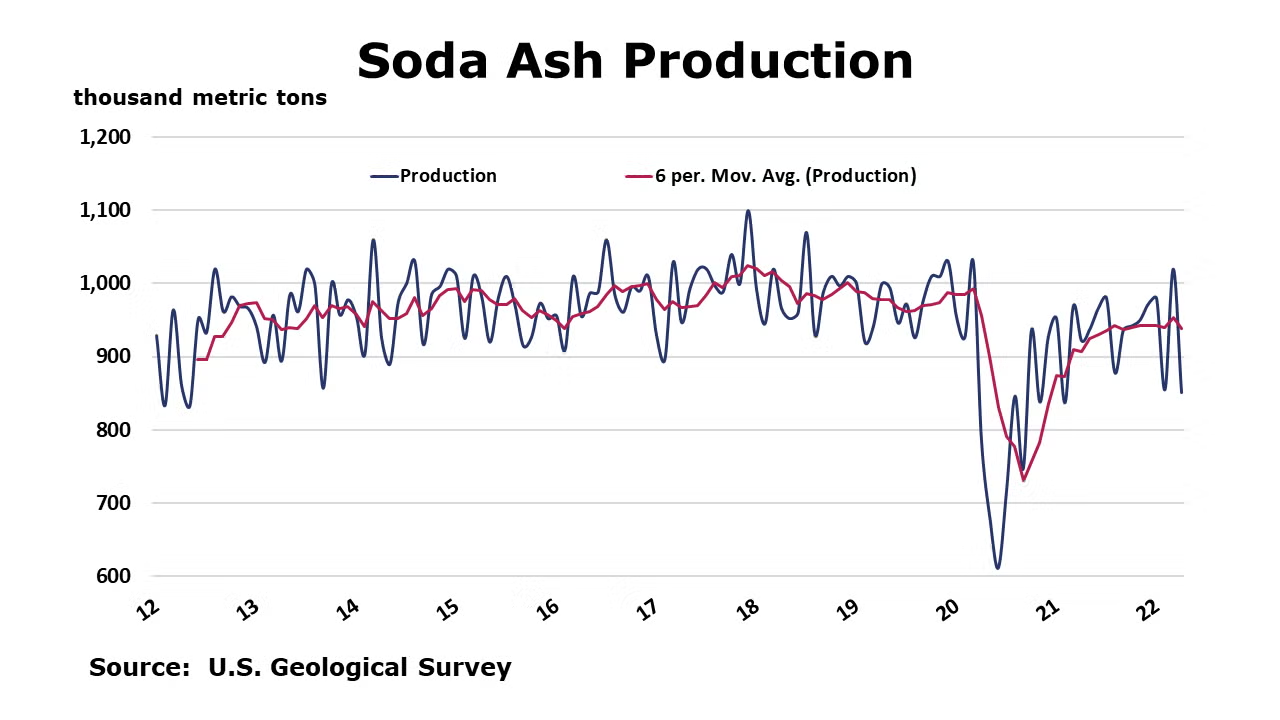
The U.S. Geological Survey reported that monthly production of soda ash in April was 851 thousand tons, down 16.6% compared to the previous month and down 7.7% Y/Y. Stocks fell 17.2% compared to March to 236 thousand tons at the end of the month, an 8-day supply. Ending stocks were down 16.0% Y/Y.
Note On the Color Codes
The banner colors represent observations about the current conditions in the overall economy and the business chemistry. For the overall economy we keep a running tab of 20 indicators. The banner color for the macroeconomic section is determined as follows:
Green – 13 or more positives
Yellow – between 8 and 12 positives
Red – 7 or fewer positives
For the chemical industry there are fewer indicators available. As a result we rely upon judgment whether production in the industry (defined as chemicals excluding pharmaceuticals) has increased or decreased three consecutive months.
For More Information
ACC members can access additional data, economic analyses, presentations, outlooks, and weekly economic updates through MemberExchange.
In addition to this weekly report, ACC offers numerous other economic data that cover worldwide production, trade, shipments, inventories, price indices, energy, employment, investment, R&D, EH&S, financial performance measures, macroeconomic data, plus much more. To order, visit https://store.americanchemistry.com/.
Every effort has been made in the preparation of this weekly report to provide the best available information and analysis. However, neither the American Chemistry Council, nor any of its employees, agents or other assigns makes any warranty, expressed or implied, or assumes any liability or responsibility for any use, or the results of such use, of any information or data disclosed in this material.
Contact us at ACC_EconomicsDepartment@americanchemistry.com


