
Nonfarm payrolls expanded by 50,000 in December, finishing the year on a soft note. Job growth slowed considerably during 2025. Previously published estimates for October and November were revised lower. Manufacturing jobs fell 8,000 and there were also declines in mining, construction, transportation & warehousing, and trade. Wage growth was essentially steady at 3.8% Y/Y. According to the separate household survey, the unemployment rate eased from a downwardly revised 4.5% in November (a four-year high) to 4.4% in December. The number of unemployed fell faster than the decline in the labor force. An alternative measure of unemployment, the U-6 (which includes a broader set of people that are working part-time or marginally attached to the labor force), also eased in December from November’s four-year high.
A proxy for the BLS nonfarm payrolls data, ADP reported that U.S. private sector employment rose by 41,000 in December after losing a revised 29,000 in November. For all of 2025, private employment gained 614,000, down from 1.7 million in 2024. December employment rose the most in education & health services, leisure & hospitality, and trade, transportation & utilities. Job losses were reported in professional & business services, information, and manufacturing, with the latter losing 5,000. All size classes saw increases in December, with mid-sized businesses gaining the most, up 34,000. The ADP National Employment Report is an independent and high-frequency view of the private-sector labor market based on the aggregated and anonymized payroll data of more than 26 million U.S. employees.
U.S. businesses announced plans for just over 35,500 layoffs in December, the lowest level since July 2024, according to Challenger, Gray & Christmas, an executive staffing firm. The December cuts were 50% down from November and 8% lower than a year earlier. December is typically a slow month in terms of layoffs (the data is not seasonally adjusted). In all of 2025, there were a total of 1.2 million announced job cuts, the highest annual number since 2020 and up 58% from 2024. The sectors that cut the most in 2025 include government, technology, warehousing, retail, services, and media. Hiring plans increased in December, though, rising 31% from a year earlier.
Job openings eased slightly in November, down by 303,000 to 7.1 million, but the number of job openings per unemployed person fell below one for the first time since March 2021. Quits, a measure of workers’ willingness to leave a job, were slightly higher compared to October.
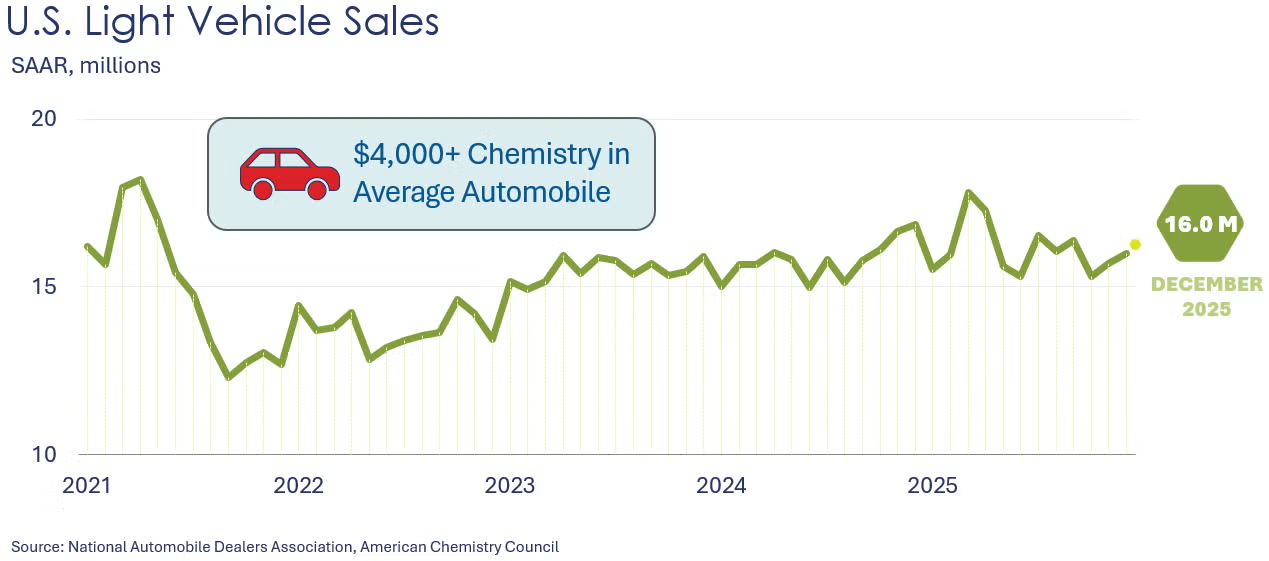
Light vehicle sales rose from a 15.7 million seasonally adjusted annual rate (SAAR) to a 16.0 million SAAR in December. That brings the year-end total to 16.2 million, the best year since 2019. The boost was driven by front-loading ahead of tariffs and the rush to buy EVs before tax credits expired at the end of September.
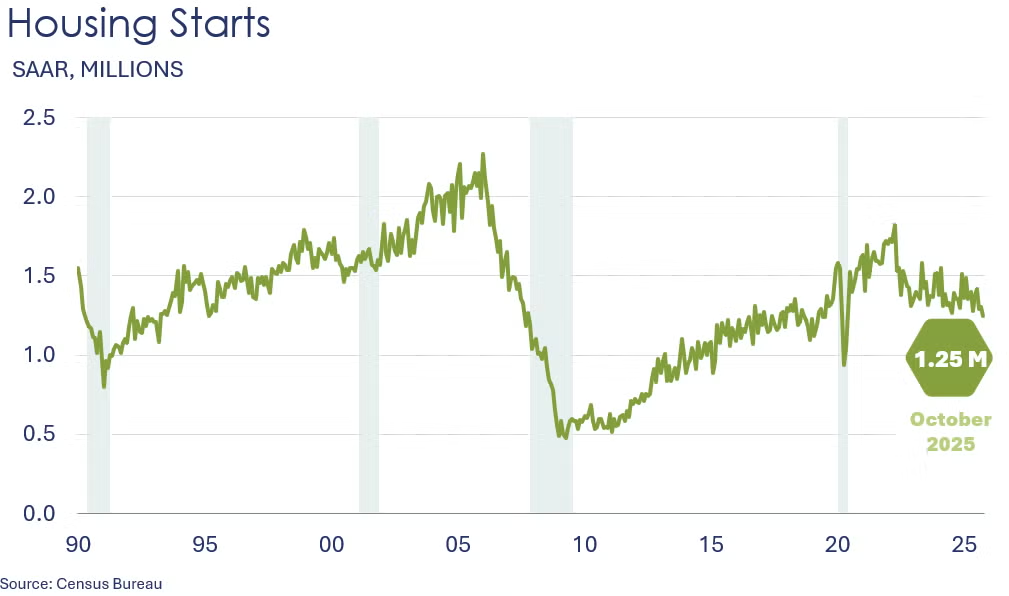
Headline housing starts fell 4.6% in October to 1.25 million units’ annual pace, the lowest level since May 2020. On the flip side, chemistry-intensive single-family starts gained 5.4%, with gains in all the regions except for the West. The October headline number was driven down by multifamily starts, which slumped 25.9%. Forward-looking building permits lost 0.2% in October after rising 6.4% in September. In August, permits reached their lowest level since May 2020. All the regions saw contractions in permits except for the West. Compared to a year ago, housing starts were down 7.8% Y/Y while building permits were off by 1.1% Y/Y.
The ISM Manufacturing PMI® fell 0.3 points in December to 47.9, the tenth month of contraction. New orders, employment, backlog of orders, and new export orders contracted at a slower pace. At the same time, inventories and imports also contracted but at a faster pace. Production grew at a slower rate while supplier deliveries shifted from faster to slower, suggesting increasing demand began to stretch supplier capacity. Prices kept increasing at the same rate as the previous month and customers’ inventories continued to be deemed “too low”, more so than the previous month. Only two industries (electrical equipment & appliances and computer & electronic products) reported expansion in December, while 15 industries reported contraction, including chemicals.
Headline factory orders fell 1.3% in October. The largest declines were in orders for aircraft, electrical equipment, mining & oilfield machinery, nondefense communications equipment, HVAC equipment, and aluminum. The largest gains were in industrial machinery; turbines and power generation & transmission equipment; ships and motor vehicles. Core business orders (nondefense capital orders, excluding aircraft) continued to expand, up 0.5%. Unfilled orders, a measure of the manufacturing pipeline, rose 0.2%. Shipments edged slightly higher after easing the previous two months. Manufacturing inventories were flat with little change among major segments. The ratio of inventories-to-shipments remained stable at 1.56 for a fourth consecutive month.
Looking abroad, the JP Morgan Global Manufacturing PMI edged lower by 0.1 points to 50.4, signaling expansion for a fifth consecutive month. There was expansion in 18 of 29 nations with the fastest expansions in India, Vietnam, and Greece. New export business decreased for the ninth month in a row.
The ISM Services PMI® increased 1.8 points to 54.4 in December (a level above 50 corresponds to an expansion while a level below 50 indicates a contraction in the services sector). The increase was led by new export orders, imports, and employment, all shifting from contracting to growing, as well as new orders, inventories, and business activity/production, which grew faster than the previous month. Inventory sentiment remained “too high” while supplier deliveries slowed further. Prices continued to increase but at a slightly slower pace. Only order backlogs contracted, doing so faster than the previous month.
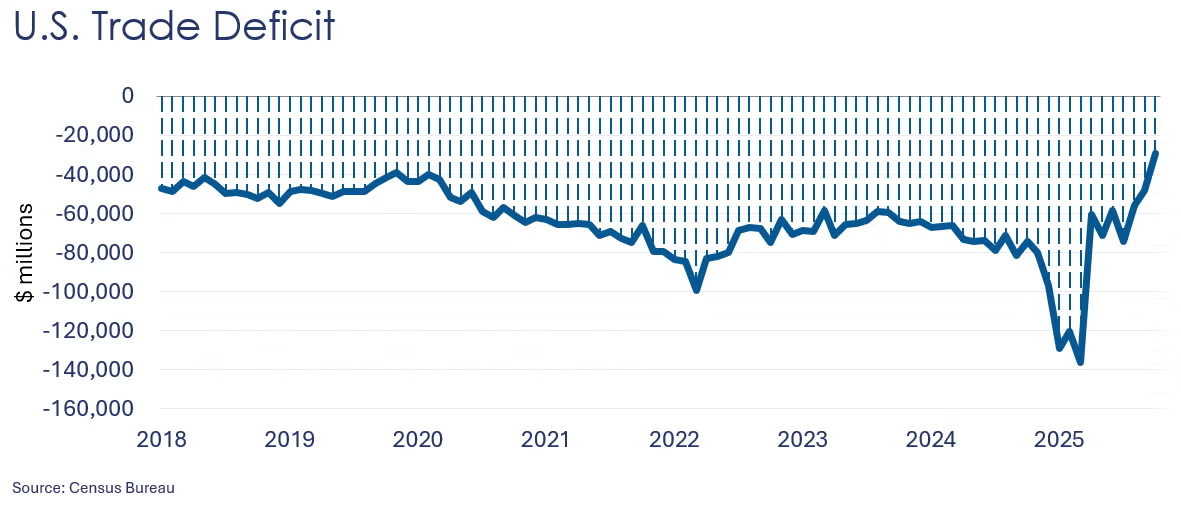
U.S. trade deficit fell by $18.8 billion in October to $29.4 billion, the lowest deficit since June 2009. The decline in the trade deficit reflected growth of 2.6% in exports versus a 3.2% drop in imports. Exports of industrial supplies & materials increased while exports of consumer goods declined. On the other hand, imports of capital goods (particularly computer and telecommunications equipment) rose while imports of consumer goods and industrial supplies & materials declined.
Wholesale inventories rose 0.2% in October following a revised 0.5% increase in September. The largest gains were in farm products, pharmaceuticals, chemicals, and electrical equipment. On the flip side, computer equipment stocks dropped the most. Wholesale sales declined 0.4%, driven down by machinery, lumber, hardware, furniture, alcoholic products, and chemicals. Sales of metals, electrical equipment, and groceries rose. Compared to a year ago, sales were up 4.6% Y/Y while inventories gained 1.7% Y/Y. The inventories-to-sales ratio rose to 1.33 from 1.29 in September.
Borrowing rose in November as consumer debt climbed at a 1.0% annual rate, down from a revised gain of 2.2% in October. Credit card balances fell 1.9% after gaining 4.9% the prior month, while balances on nonrevolving debt, such as student loans and car loans, grew 2.0% on top of a 1.2% rise in October.
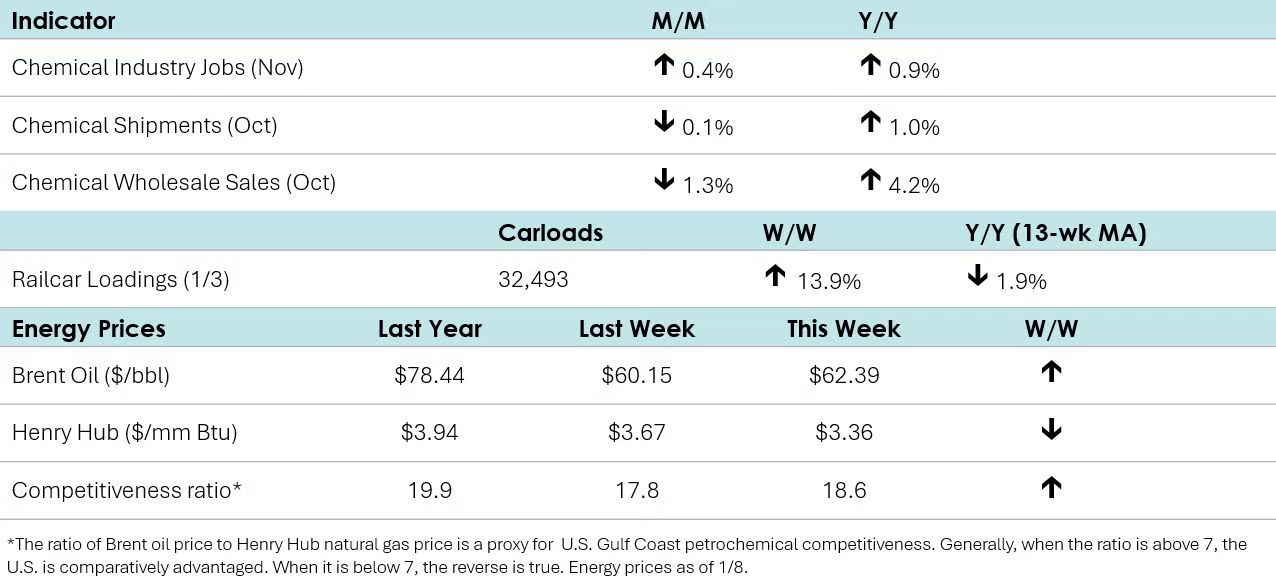
According to data released by the Association of American Railroads, chemical railcar loadings were up to 32,493 for the week ending January 3rd. Loadings were down 1.9% Y/Y (13-week MA) and were up 0.8% YTD/YTD.

Within the details of the ISM Manufacturing PMI® report, the chemical industry was again reported to be in contraction. One chemical industry respondent noted, “Winding up the year with mixed results. It has not been a great year. We have had some success holding the line on costs; however, real consumer spending is down and tariffs are ultimately to blame.” Another chemical industry respondent pointed out, “Orders continue to drop for most of our businesses. Many plants are not running near full capacity. Make to order being utilized where possible.” There was contraction in new orders, production, employment, inventories, order backlogs, new export orders, and imports. Chemical industry respondents indicated paying lower prices for raw materials in December, while customer inventories were deemed “too low”. The chemical industry was one of four that reported faster supplier deliveries, an indicator of slackness in the distribution network.
Chemical shipments eased by 0.1% in October, following a 0.5% decline in September. Shipments drifted lower for agricultural chemicals, coatings & adhesives, and other chemicals. Chemical inventories also moved lower for a second month, down by 0.3%, as inventories fell along all three major segments. Compared to a year ago, chemical shipments were up 1.0% Y/Y while inventories were flat. The inventories-to-shipments ratio remained stable at 1.24 for the fourth month.
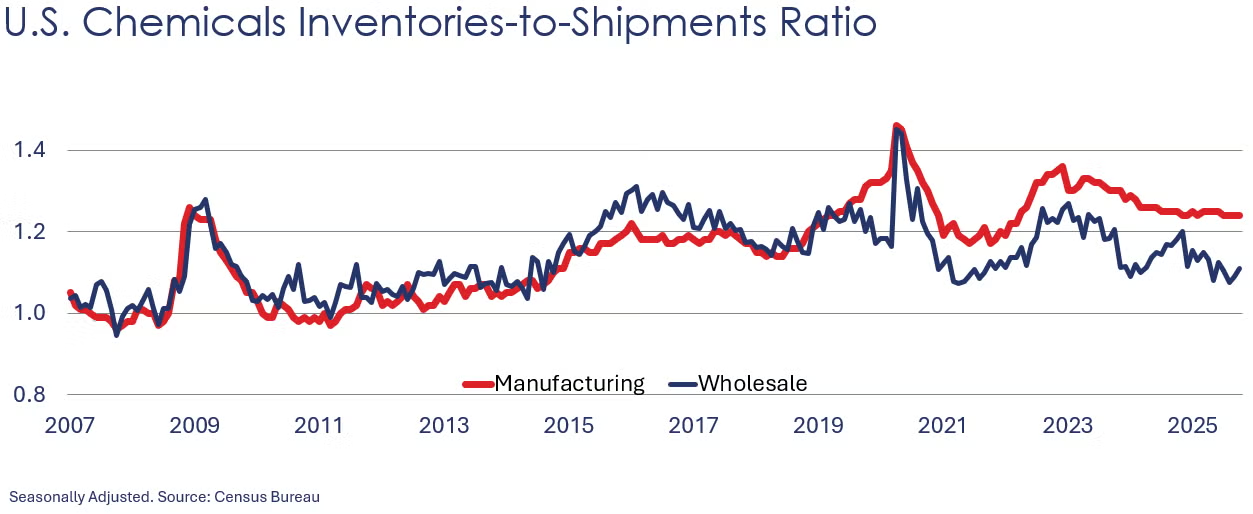
Chemical wholesale sales fell 1.3% in October following a similar decline in September. Wholesale inventories of chemicals moved higher, however, for a second month, up 0.4%. Compared to a year ago, chemical inventories were down by 1.7% while sales were up 4.2%. The inventories-to-sales ratio rose from 1.09 in September to 1.11 in October. A year ago, the ratio was 1.18.
Chemical industry employment rose in November, up 0.4% to 554,700 (up 0.9% Y/Y). Employment in plastic resin manufacturing eased, however, off by 0.2% to 62,700, a level 2.5% higher than last November. (Note that data at the detailed industry level are lagged one month behind the headline jobs report.)
In December, combined chemical and pharmaceutical jobs declined by 3,100 to 907,100, a level up 0.8% Y/Y. A slight gain in the number of production workers offset declines in supervisory & non-production workers. Average hourly earnings for production workers were essentially flat compared to a year ago (off 0.2%) at $31.46. The average workweek for production workers fell to 42.3 hours in December. With a slight gain in the number of production workers and a decline in the average workweek, the implied labor input into the chemical industry eased in December, consistent the ISM PMI® report which reported that the chemical industry contracted.
Energy Wrap-Up
• Oil prices were slightly higher than last Friday on emerging supply risks in Russia (following a drone attack on a tanker in the Black Sea), Iraq (announcement of nationalization of one of the world’s largest oilfields) and Iran (ongoing protests).
• U.S. natural gas prices eased from a week ago and were below year ago levels.
• Natural gas inventories fell by 119BCF last week. Gas inventories were 3.6% lower than the same week last year, but remain 1.0% ahead of the five-year historical average.
• The combined oil & gas rig count was 537 on December 30th. At the end of 2024, the rig count was 585.
For More Information
ACC members can access additional data, economic analyses, presentations, outlooks, and weekly economic updates through ACCexchange: https://accexchange.sharepoint.com/Economics/SitePages/Home.aspx
In addition to this weekly report, ACC offers numerous other economic data that cover worldwide production, trade, shipments, inventories, price indices, energy, employment, investment, R&D, EH&S, financial performance measures, macroeconomic data, plus much more. To order, visit http://store.americanchemistry.com/.
Every effort has been made in the preparation of this weekly report to provide the best available information and analysis. However, neither the American Chemistry Council, nor any of its employees, agents or other assigns makes any warranty, expressed or implied, or assumes any liability or responsibility for any use, or the results of such use, of any information or data disclosed in this material.
Contact us at ACC_EconomicsDepartment@americanchemistry.com.


