Running tab of macro indicators: 14 out of 20
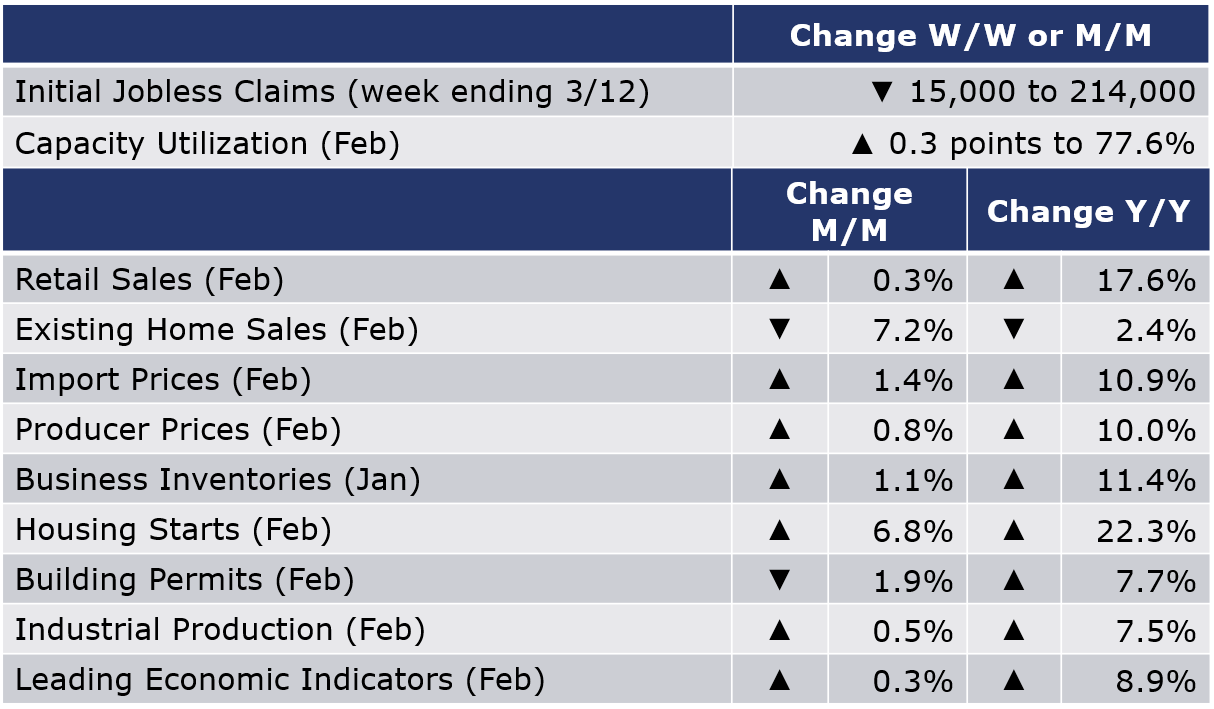
The number of new jobless claims fell by 15,000 to 214,000 during the week ending 12 March. Continuing claims decreased by 71,000 to 1.4 million, and the insured unemployment rate for the week ending 5 March was down 0.1 percentage point to 1.0%.
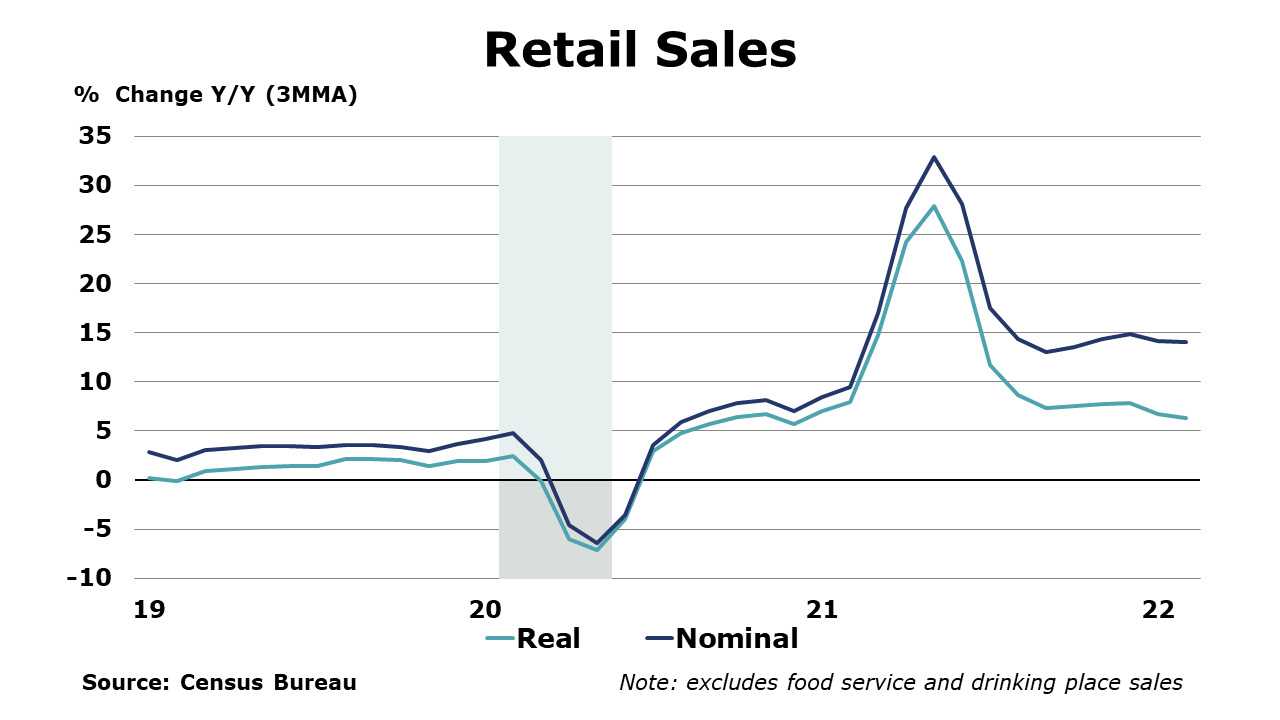
Following a 4.9% gain in January, growth in retail sales moderated in February, up by 0.3%. Adjusted for inflation, however, sales were lower. Results were mixed within segments, suggesting that higher prices at the pump may be eating into sales of other segments. Online sales eased and restaurant sales rose as the impact from Omicron faded. Sales were lower for furniture, electronics, food & beverage, and health & personal care. Compared to a year ago, retail sales were up 17.6%.
Headline producer prices continued to climb in February, up an expected 0.8%, a more moderate pace than January’s 1.2% gain. Prices for final demand goods jumped by 2.4%, the largest advance since the data were first calculated in 2009. Accounting for two-thirds of the gain, energy prices continued to rise sharply during February on growing concern that Russia would invade Ukraine (which it did on February 24th). Core producer prices continued to rise by 0.7%, the same as in January, suggesting price pressures continued to build before Russia’s invasion. Compared to a year ago, headline producer prices were up 10.0% (the same as last month) while core prices were up by 6.6% Y/Y (slightly lower than last month’s Y/Y comparison). U.S. import prices rose 1.4% in February, after advancing 1.9% in January. Higher fuel and nonfuel prices drove the increases in both months. Prices for U.S. exports advanced 3.0% in February following a 2.8% rise the previous month.
Housing activity expanded in February with housing starts up 6.8% to a 1.78 million unit pace, the fastest pace of homebuilding since 2006. Chemistry-intensive single-family starts were up 5.7% to a 1.215 million pace. Starts rose in all regions except the West. Following four months of gains, forward-looking building permits eased, however, off by 1.9%. Compared to a year ago, housing starts were up 22.3% while building permits were up 7.7% Y/Y. Separately, homebuilder confidence fell by two points to 79 in March according to the NAHB/Wells Fargo Housing Market Index. While buyer traffic increased, confidence about current and prospective sales declined.
Existing home sales surprised to the downside with a 7.2% loss to a 6.02 million annual pace in February. Compared to a year ago, sales were off 2.4%. The inventory of unsold homes at the end of the month increased by 2.4% and now represents a 1.7-month supply at the current sales pace. This is higher than last month and lower than a year ago. The median sales price was up 15.0% Y/Y.
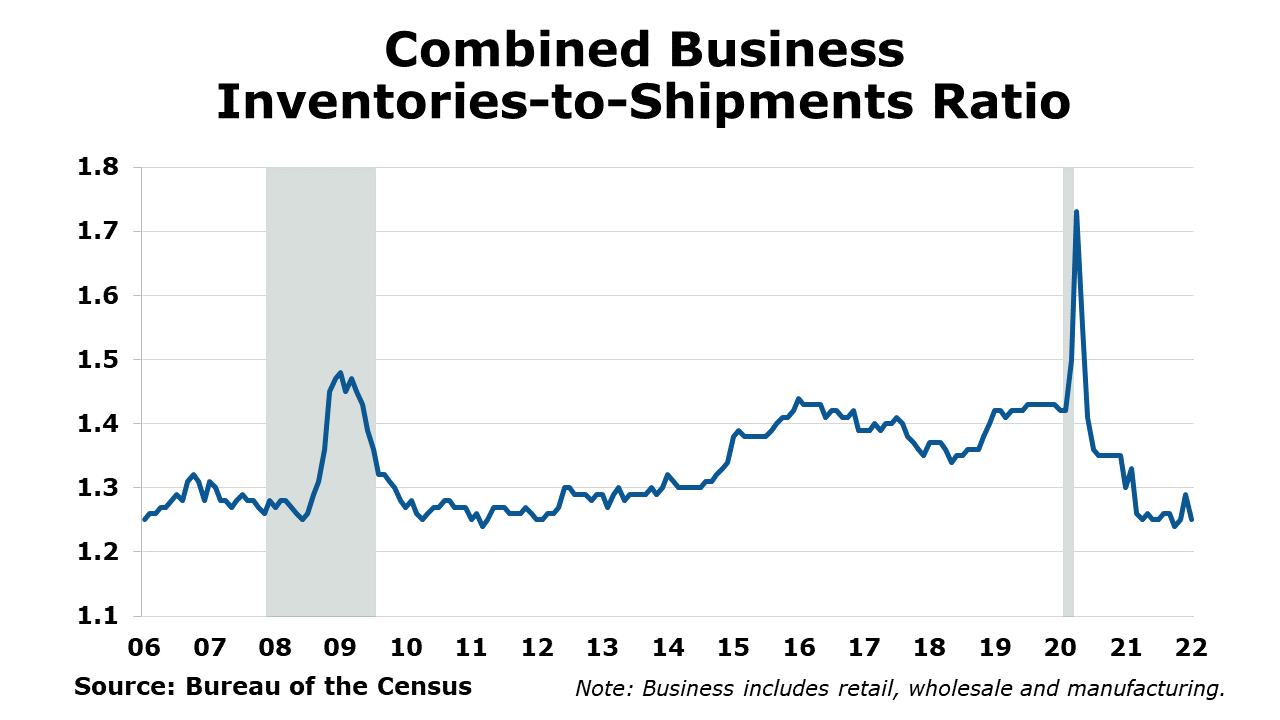
Combined business inventories rose by 1.1% in January with gains in retail, wholesale, and manufacturing inventories. Combined business sales increased 3.7% with gains in manufacturing, retail, and wholesale. Compared to a year ago, business sales were up 15.5% while inventories were up 11.4% Y/Y. The combined inventories-to-sales ratio was lower at 1.25 compared to 1.29 in December.
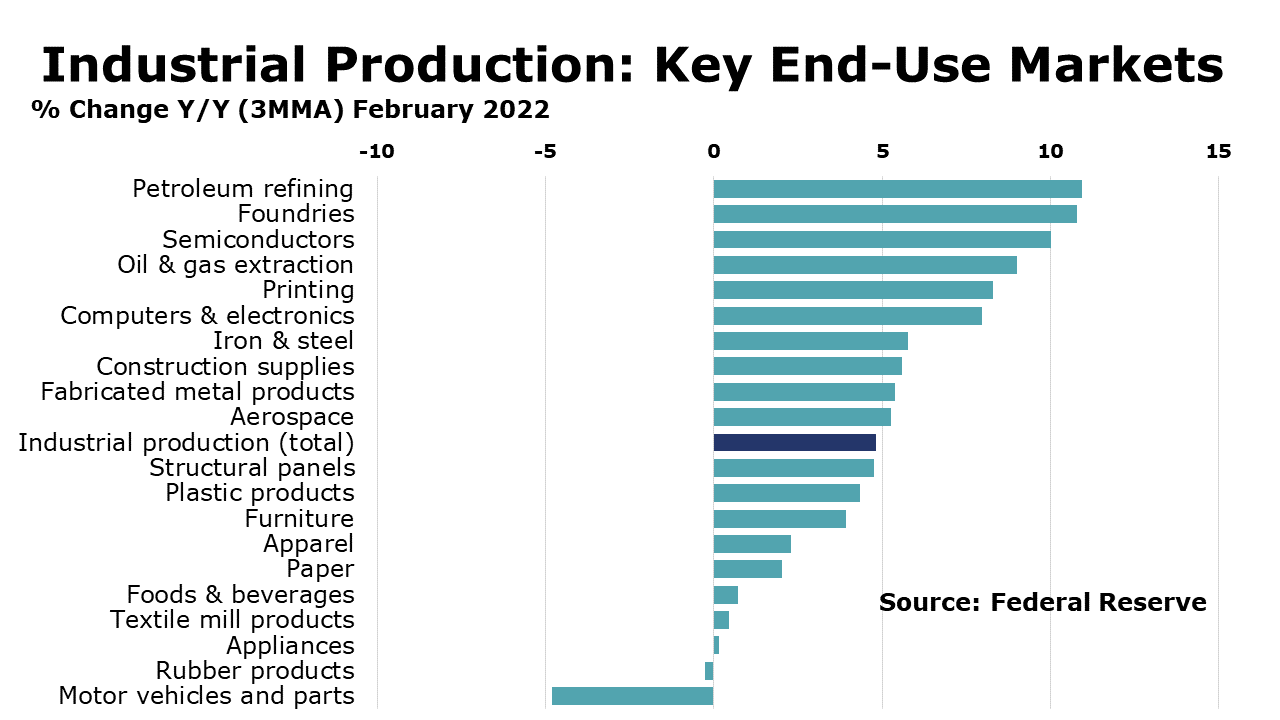
As expected, industrial production expanded by 0.5% in February. This follows a 1.4% gain in January. Mining output ticked up slightly higher while utility output fell with milder temperatures. Manufacturing output expanded by 1.2%, the largest gain since October. Gains were broad based with the largest increases in nonmetallic mineral products, wood products, metals and metal products, aerospace, furniture, apparel, and petroleum products. Facing ongoing supply chain challenges, output of motor vehicles and parts declined for a third month. Compared to a year ago, overall industrial production was up 7.5%. Capacity utilization tightened by 0.3 points to 77.6%, much higher than last year’s 72.7% which reflected widespread damage from winter storm Uri.
The Conference Board Leading Economic Index® (LEI) increased by 0.3% in February to 119.9, following a 0.5% decrease in January and an 0.8% increase in December. However, the impacts of the Russian invasion of Ukraine are not fully reflected in February’s index. In addition, supply chain challenges, inflation, labor shortages, rising costs (particularly in energy, food, and metals), and rising interest rates pose headwinds to U.S. economic growth and could signal lower-than-anticipated growth in the first half of 2022.
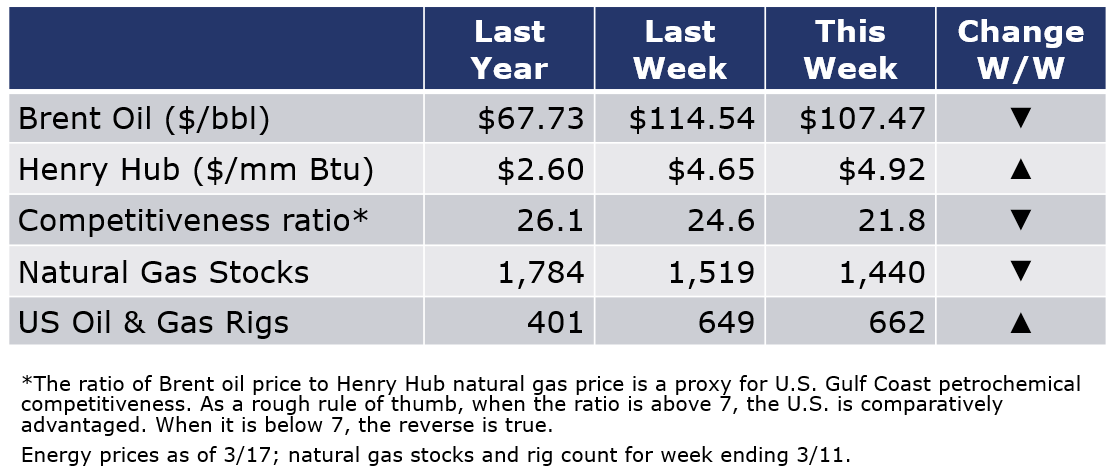
The combined oil and gas rig count rose to by 13 to 662 during the week ending 11 March. Oil prices eased this week as surging cases of the BA.2 Omicron subvariant, also known as “stealth Omicron,” in China have closed factories and the Fed began raising interest rates; however, prices were up again on Thursday following an IEA report that highlighted the impact of sanctions on Russian oil supplies. Natural gas prices were higher this week on a larger-than-expected 79 BCF inventory draw.
For the business of chemistry, the indicators still bring to mind a green banner for basic and specialty chemicals.
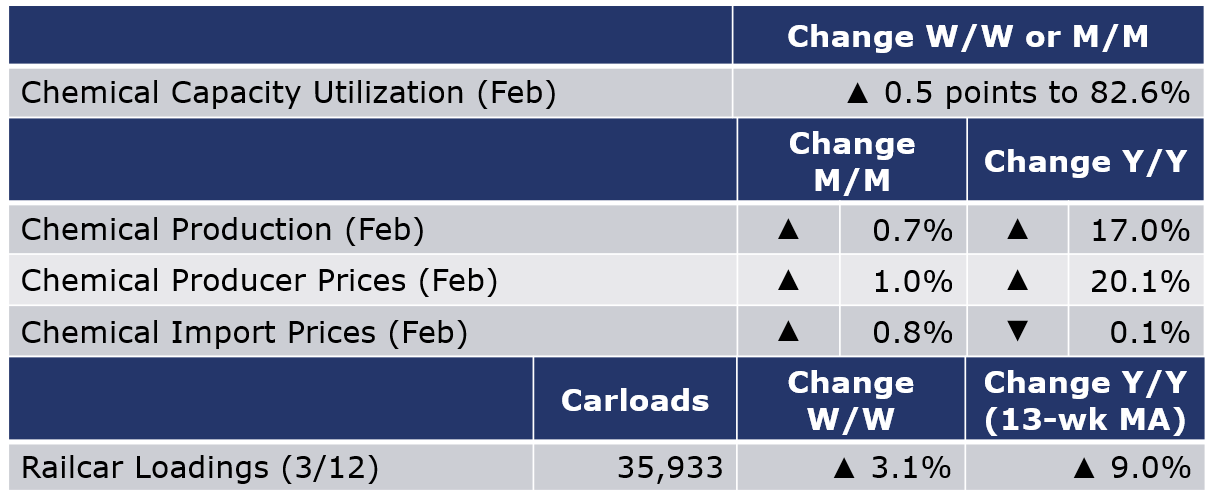
According to data released by the Association of American Railroads, chemical railcar loadings rose 3.1% to 35,933 carloads for the week ending 12 March (week 10). Loadings were up 9.0% Y/Y (13-week MA), up 10.1% YTD/YTD and have been on the rise for 8 of the last 13 weeks.
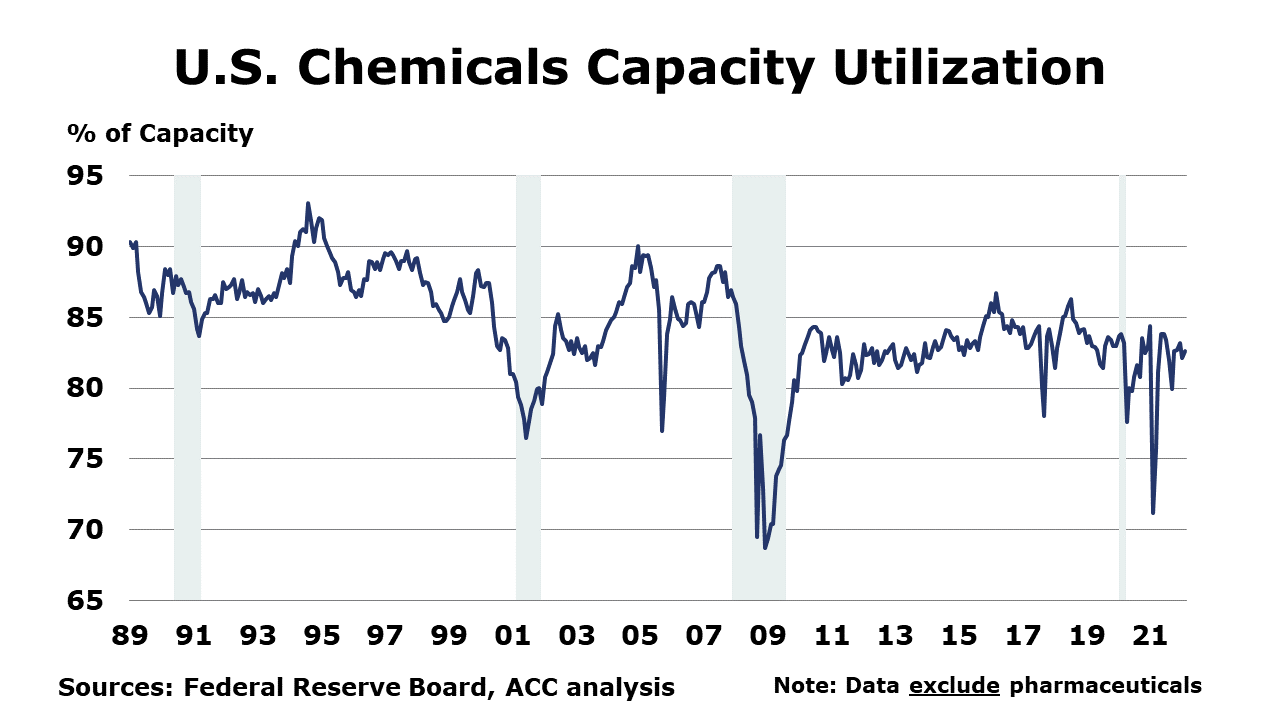
Following a 1.3% decline in January, chemical production expanded by 0.7% in February. There were gains in the production of organic chemicals, inorganic chemicals, industrial gases, plastic resins, synthetic rubber, manufactured fibers, and other specialty chemicals. These gains were offset by lower production of pesticides, fertilizers, coatings, and adhesives. Compared to a year ago when winter storm Uri devastated the U.S. Gulf Coast, chemical production was up by 17.0%. Chemical capacity utilization tightened from 82.1% in January to 82.6% in February; a year ago, capacity utilization stood at 71.2%.
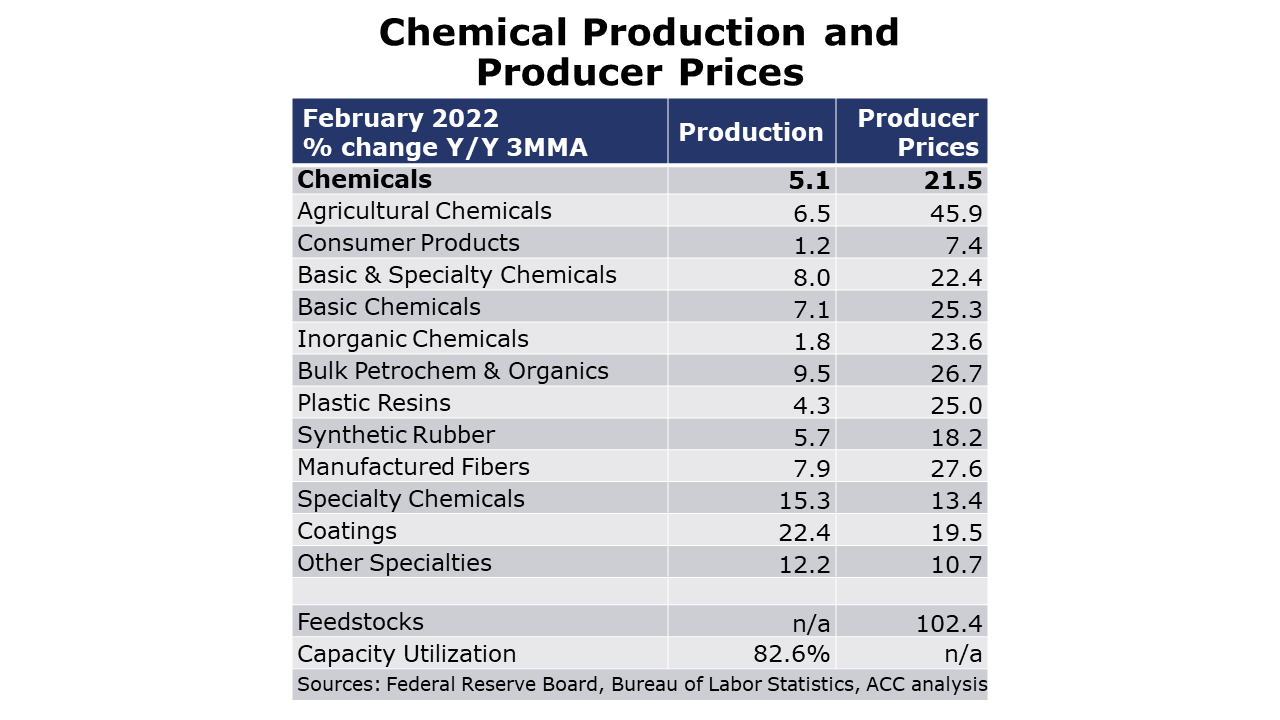
Chemical producer prices advanced for a 21st consecutive month in February, up by 1.0%. There were sequential gains in all segments, except petrochemicals, plastic resins, and synthetic rubber which edged slightly lower. Compared to a year ago, chemical prices were up 21.5% with double-digit gains across all major segments except consumer products. U.S. chemical import prices rose 0.8% in February, after advancing 2.6% in January. Chemical imports prices have also risen for 21 consecutive months. Prices for U.S. chemical exports declined 0.1% in February following a 0.6-percent rise the previous month. Year-over-year comparisons have been high for both import and export prices. In February, chemical import prices were up 26.3% Y/Y and export prices were up 19.0% Y/Y.
Note On the Color Codes
The banner colors represent observations about the current conditions in the overall economy and the business chemistry. For the overall economy we keep a running tab of 20 indicators. The banner color for the macroeconomic section is determined as follows:
Green – 13 or more positives
Yellow – between 8 and 12 positives
Red – 7 or fewer positives
For the chemical industry there are fewer indicators available. As a result we rely upon judgment whether production in the industry (defined as chemicals excluding pharmaceuticals) has increased or decreased three consecutive months.
For More Information
ACC members can access additional data, economic analyses, presentations, outlooks, and weekly economic updates through MemberExchange.
In addition to this weekly report, ACC offers numerous other economic data that cover worldwide production, trade, shipments, inventories, price indices, energy, employment, investment, R&D, EH&S, financial performance measures, macroeconomic data, plus much more. To order, visit https://store.americanchemistry.com/.
Every effort has been made in the preparation of this weekly report to provide the best available information and analysis. However, neither the American Chemistry Council, nor any of its employees, agents or other assigns makes any warranty, expressed or implied, or assumes any liability or responsibility for any use, or the results of such use, of any information or data disclosed in this material.
Contact us at ACC_EconomicsDepartment@americanchemistry.com

