Running tab of macro indicators: 9 out of 20
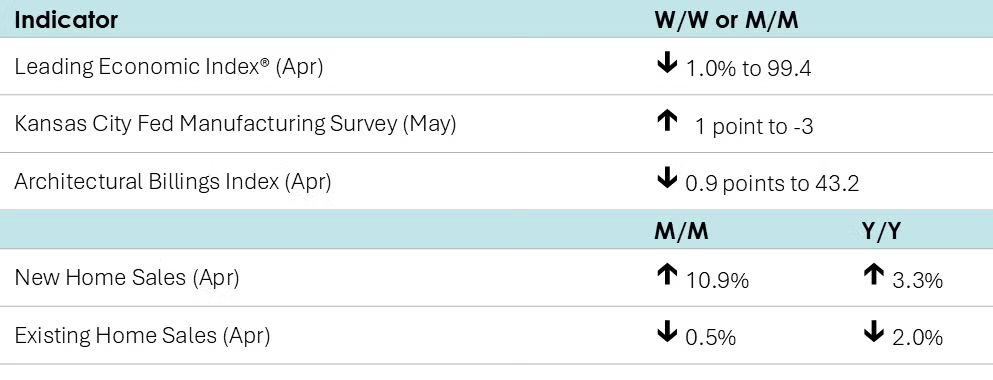
The Conference Board’s Leading Economic Index® (LEI) fell sharply by 1.0% in April. It was the largest monthly decline in more than two years. Over the six month period ending in April, the LEI was down 2.0%, the same rate of decline as over the previous six-month period. Most components deteriorated. In particular, consumers’ expectations have become steadily more pessimistic since the beginning of the year.
Following a downward revision to March, new home sales rose by a better-than-expected 10.9% in April. At 743,000, it was the highest pace in three years. There were gains across all regions except the Northeast. New home inventories eased 0.6% bringing the months’ supply of new homes to 8.1 in April, down from 9.1 in March. The median sales price fell 2.0% Y/Y to $407,200. Compared to a year ago, new home sales were up 3.3% while inventories were up 8.6%. Mortgage rates were lower during the first part of the month before moving higher. Rates remained below the mid-January peak.
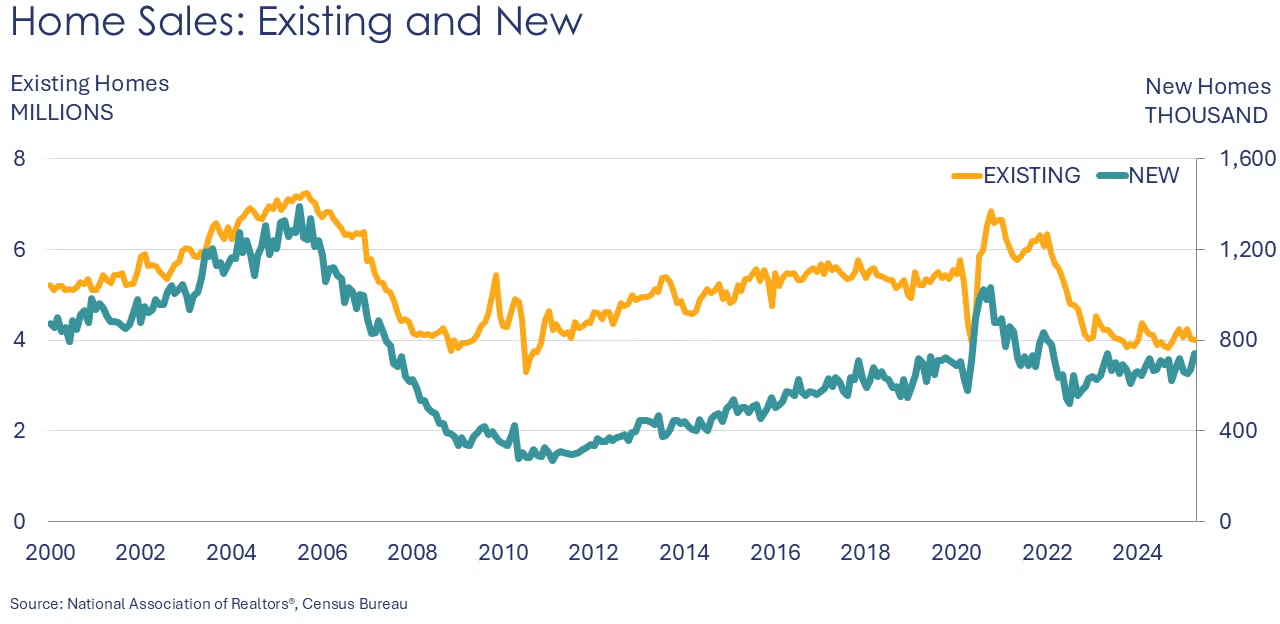
Existing home sales continued to move lower, down 0.5% in April to a 4.0 million pace, the lowest since 2009. Sales were 2.0% lower than April 2024. Inventories rose 9.0% over the course of the month, representing a 4.4-month supply at the current sales pace, up from 4.0 months in March and 3.4 months a year ago. The median sales price rose 1.8% Y/Y to $414,000.
An indicator of leading activity in the nonresidential construction sector, the AIA/Deltek Architectural Billings Index (ABI) fell 0.9 points to 43.2 in April, reflecting an accelerated decrease in billing activity at architectural firms. The index for design contracts declined for a 14th consecutive month.
Manufacturing activity in the Tenth Federal Reserve District (Kansas City) continued to contract as the composite index rose by 1 point to -3 (a reading below zero signals contraction). Expectations for conditions six months ahead remained somewhat positive, however.
ACC Survey of Economic Forecasters
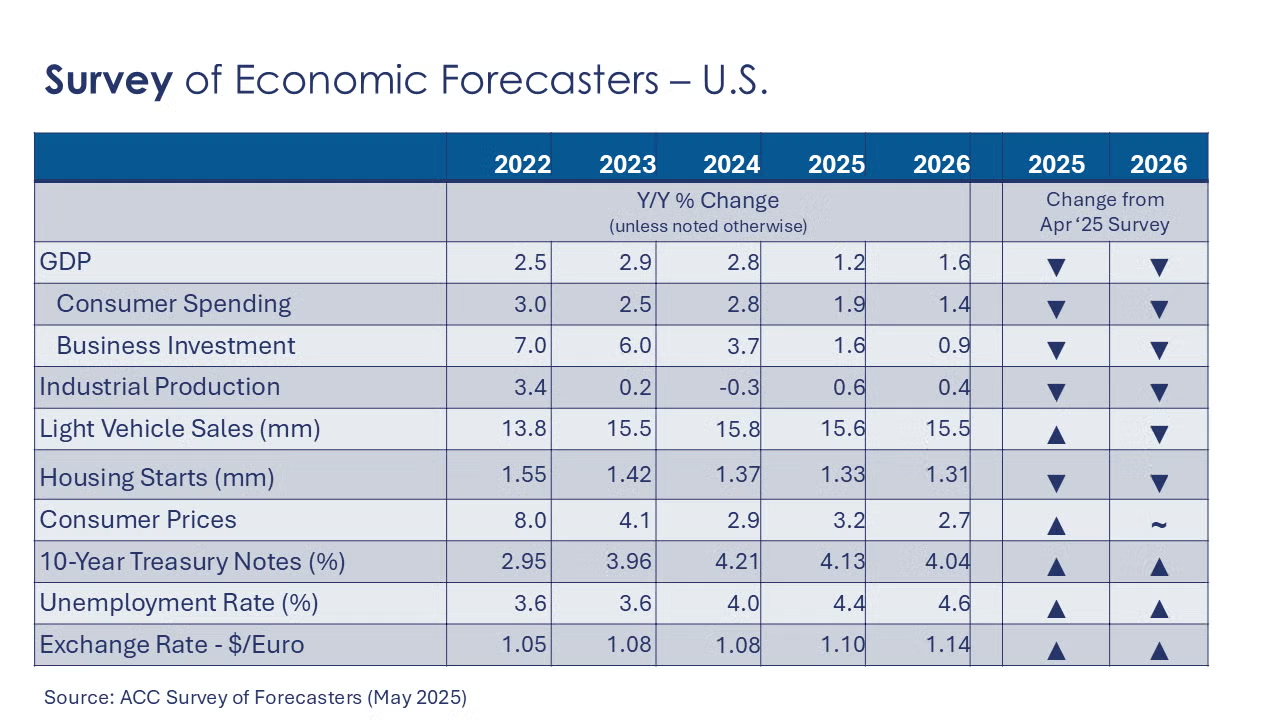
The U.S. economy continues to struggle with high levels of uncertainty, raising the risk of a downturn. While a recession is not in the forecast, the odds have risen since the beginning of the year. As a result, the majority of indicators in our Survey of Forecasters continued to deteriorate in May.
- U.S. GDP is expected to grow by 1.2% in 2025 and by 1.6% in 2026.
- Growth in consumer spending is expected to moderate to a 1.9% pace in 2025 before easing further to a 1.4% gain in 2026.
- Business investment growth is expected to slow to 1.6% in 2025 before easing further to 0.9% in 2026.
- Following a 0.3% decline in 2024, we look for industrial production to grow only 0.6% in 2025 (and 0.4% in 2026. Certain industries will be more impacted by tariffs than others.
- Sales of autos and light trucks rose to 15.8 million in 2024 (still below trend). In 2025, vehicle sales are expected to ease to a 15.6 million pace, before slipping further to a 15.5 million pace in 2026, as affordability constraints persist.
- Also struggling with affordability, housing starts fell to 1.37 million in 2024 and are expected to be fall further to 1.33 million in 2025. Further easing is expected in 2026 with 1.31 million housing starts.
- The unemployment rate is expected to move higher as the labor market continues to rebalance and a downturn reduces labor demand. The unemployment rate is expected to average 4.4% in 2025 and 4.6% in 2026.
- Prior to the tariff announcements, there had been further progress on inflation. Growth in consumer prices is now expected to accelerate in 2025 to a 3.2% pace before continuing its downward glidepath to a 2.7% pace in 2026.
- Expectations for the 10-year Treasury were higher for 2025 and 2026.
The Survey of Economic Forecasters data are available to ACC members on ACC Exchange.
Indicators for the business of chemistry suggest a yellow banner.
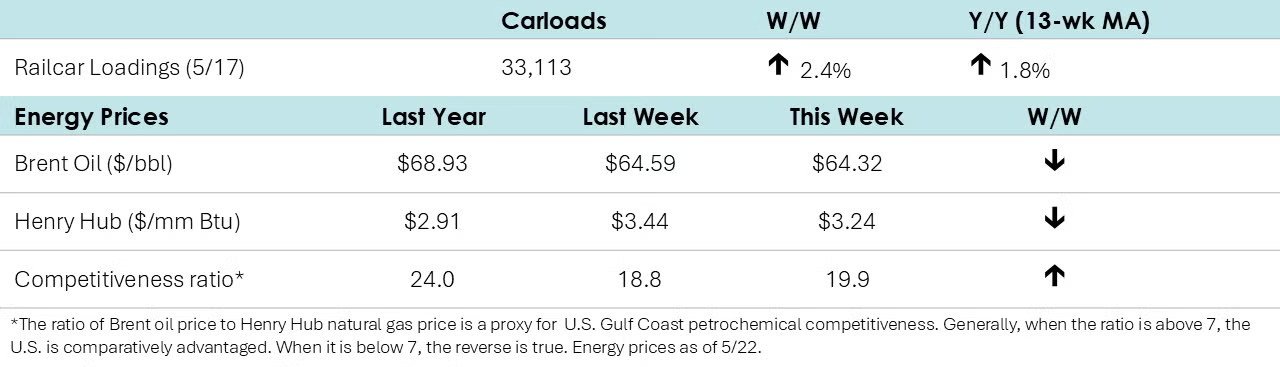
According to data released by the Association of American Railroads, chemical railcar loadings were up to 33,113 for the week ending May 17th. Loadings were up 1.8% Y/Y (13-week MA), up (2.0%) YTD/YTD and have been on the rise for eight of the last 13 weeks.

Energy Wrap-Up
- The combined oil and gas rig count fell for a third straight week, down by 2 to 573.
- Oil prices eased slightly from a week ago.
Note On the Color Codes
Banner colors reflect an assessment of the current conditions in the overall economy and the business chemistry of chemistry. For the overall economy we keep a running tab of 20 indicators. The banner color for the macroeconomic section is determined as follows:
Green – 13 or more positives
Yellow – between 8 and 12 positives
Red – 7 or fewer positives
There are fewer indicators available for the chemical industry. Our assessment on banner color largely relies upon how chemical industry production has changed over the most recent three months.
For More Information
ACC members can access additional data, economic analyses, presentations, outlooks, and weekly economic updates through ACC Exchange.
In addition to this weekly report, ACC offers numerous other economic data that cover worldwide production, trade, shipments, inventories, price indices, energy, employment, investment, R&D, EH&S, financial performance measures, macroeconomic data, plus much more. To order, visit http://store.americanchemistry.com/.
Every effort has been made in the preparation of this weekly report to provide the best available information and analysis. However, neither the American Chemistry Council, nor any of its employees, agents or other assigns makes any warranty, expressed or implied, or assumes any liability or responsibility for any use, or the results of such use, of any information or data disclosed in this material.
Contact us at ACC_EconomicsDepartment@americanchemistry.com.

