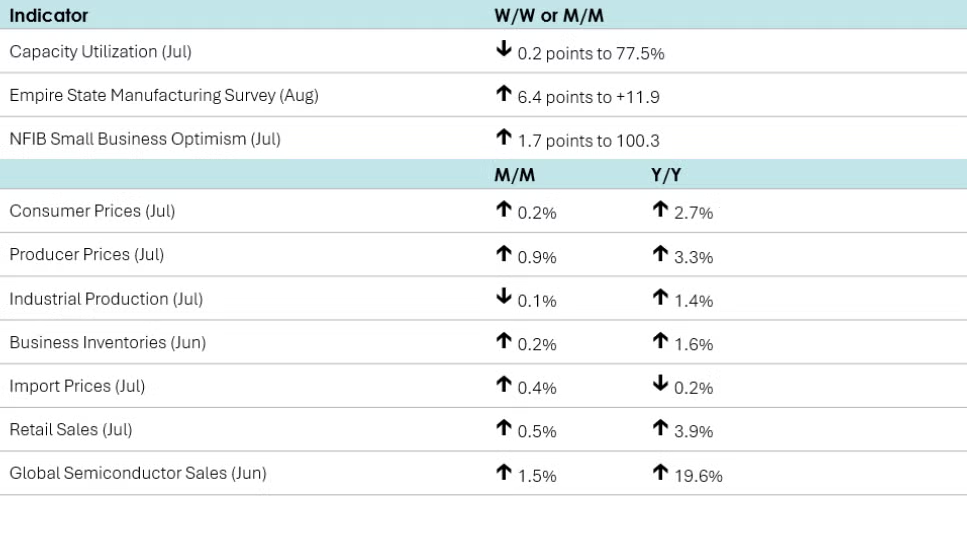
Consumer prices rose 0.2% in July, easing from a 0.3% uptick in June. An increase in shelter prices primarily drove the overall monthly rise. Excluding food and energy, core prices leaped 0.3% after gaining 0.2% in June, as prices for healthcare, airfare, furniture, and used cars and trucks moved up. Compared to a year ago, headline consumer prices increased by 2.7% Y/Y, unchanged from the June reading. On the other hand, core consumer prices advanced 3.1% Y/Y in July, accelerating from June’s 2.9% Y/Y increase.
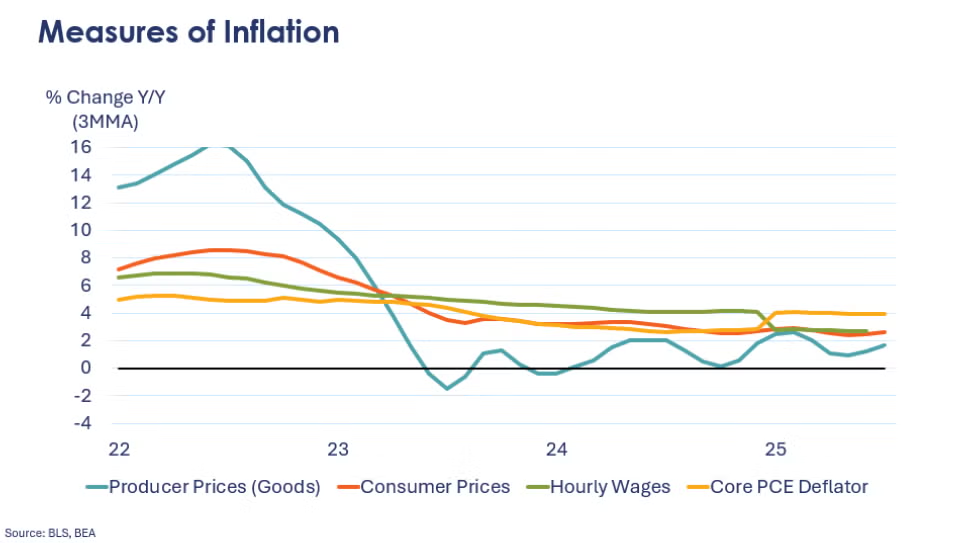
Producer prices leaped 0.9% in July after being flat in June. July’s increase was the largest since June 2022. Prices for both final demand services and final demand goods increased. Compared to a year ago, headline producer prices were up 3.3% Y/Y, accelerating from June’s 2.4% Y/Y gain. Prices for final demand goods rose 2.0% Y/Y after advancing 1.7% Y/Y in June. At the same time, prices for final demand services advanced 4.0% Y/Y in July, the largest Y/Y increase since March of this year.
Import prices (which do not include tariffs) rose 0.4% in July after losing 0.1% in June. Prices for imported fuels leaped 2.7% while prices of nonfuel imports rose 0.3%. After advancing 0.5% in June, prices for exported goods inched up 0.1% in July as agricultural export prices were flat and non-agricultural prices increased 0.1%. Compared to a year ago, import prices were down 0.2% while export prices were 2.2% higher.
Headline retail and food service sales rose 0.5% in July, following a revised 0.9% rise in June. Sales in July were higher at motor vehicle & parts dealers, furniture & home furnishing stores, grocery stores, health & personal care stores, gas stations, clothing & accessory stores, sporting goods & hobby stores, general merchandise stores, department stores, and online platforms. On the other hand, sales fell at electronics retailers, building & garden centers, restaurants & bars, and miscellaneous retailers. Core retail sales (excluding vehicle & gas station sales) increased 0.2% after adding 0.8% in June.
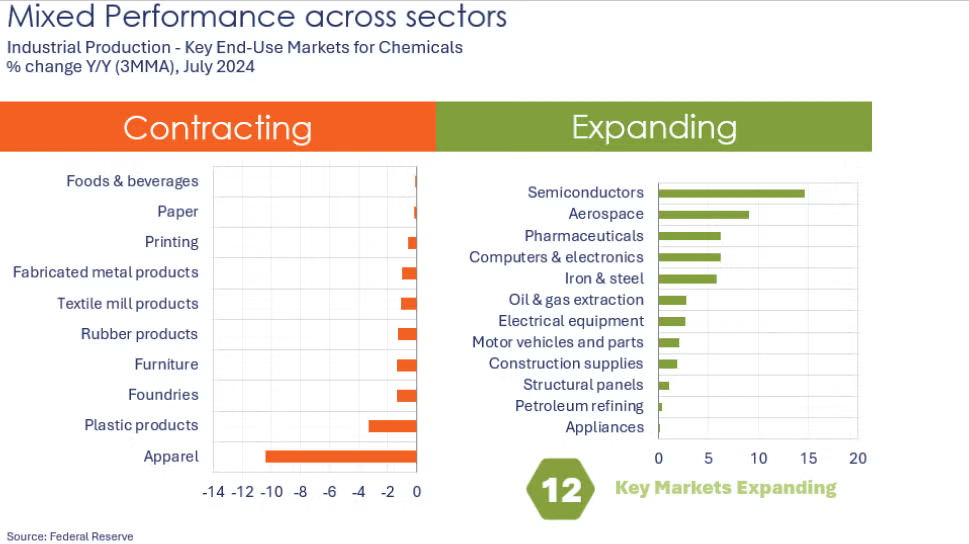
Following gains in May and June, industrial production edged lower in July, down 0.1%. The decline was led by lower mining and utility output. Manufacturing output was flat. Within manufacturing, performance was mixed. The largest output gains were in aerospace, electrical equipment, and furniture. Production declined across all major nondurable categories, including chemicals. Compared to a year ago, industrial production was up 1.4% Y/Y. Capacity utilization also eased, down 0.2 points to 77.5%, slightly below last July’s 77.6% rate. Over the past year, overall industrial capacity was up 1.5% Y/Y.
Combined business inventories rose 0.2% in June driven by gains in retail, manufacturing, and wholesale inventories. Combined business sales increased by 0.5%, with retail, wholesale, and manufacturing sales also rising in June. The inventories-to-sales ratio ticked lower to 1.38 from 1.39 in May. A year ago, the ratio was 1.41.
A first look at manufacturing activity in August, business activity grew modestly in New York State, according to the NY Fed’s Empire State Manufacturing Outlook Survey. The general business conditions index rose 6.4 points to 11.9, signaling expansion. New orders and shipments continued to expand, while inventories contracted.
Small business optimism rose in July, up by 1.7 points to 100.3. Respondents reported better business conditions and that it is a good time to expand. Offsetting those sentiments, the uncertainty index rose and the share of small business owners reporting poor sales as their top business problem rose to 11%, the highest since February 2021.
Global semiconductor sales rose 1.5% to $59.91 billion in June. Sales in China and other Asia Pacific/Other rose while sales in the Americas, Europe, and Japan were lower. Compared to a year ago, sales were up 19.6% Y/Y.
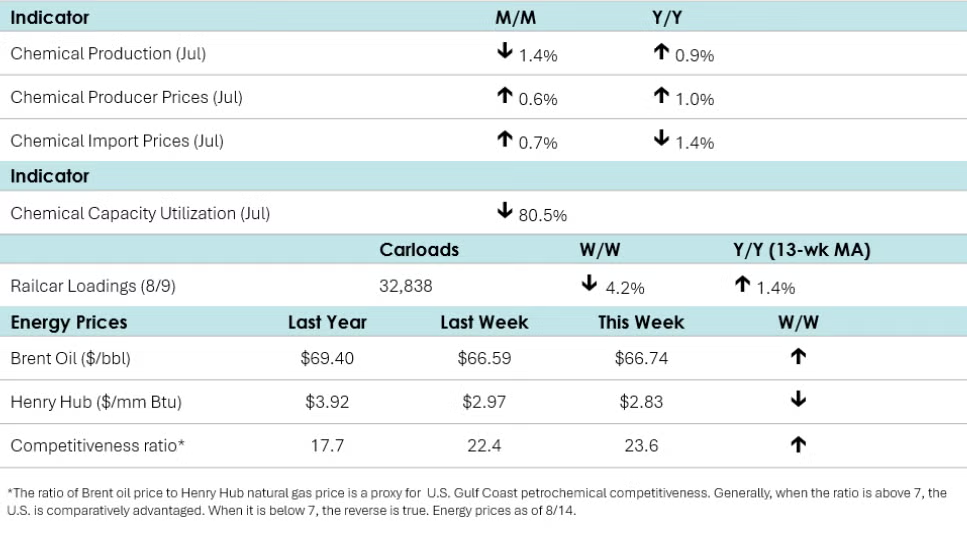
According to data released by the Association of American Railroads, chemical railcar loadings were down to 32,838 for the week ending 9 August. Loadings were up 1.4% Y/Y (13-week MA), up 1.8% YTD/YTD and have been on the rise for seven of the last 13 weeks.
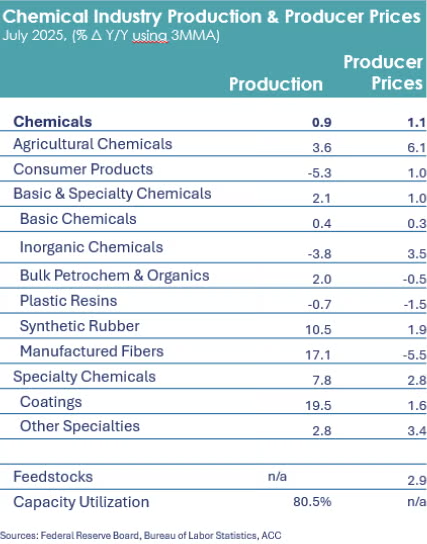
Chemical producerprices rose 0.6% in July, higher than June’s 0.2% uptick. July’s rise was led by a strong gain in manufactured fibers prices, up 7.5%. Other categories witnessed more modest gains (of one percent or less), such as agricultural chemicals, bulk petrochemicals and organics, basic chemicals, basic and specialty chemicals, inorganic chemicals, specialty chemicals, and other specialties. Prices for consumer products and plastic resins were essentially flat, while synthetic rubber declined 1.5%. Compared to a year ago, chemical producer prices were up 1.0% Y/Y.
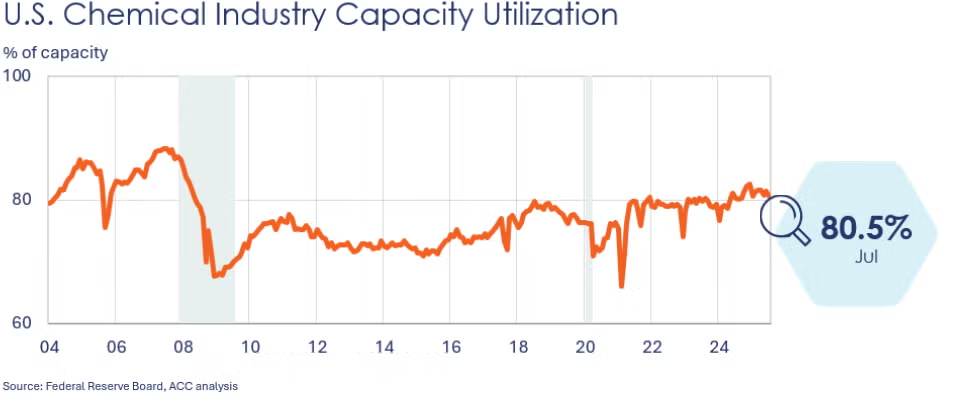
Chemical production fell 1.4% in July, following a gain in June. Production declined nearly across the board, except for output of organic chemicals which rose 0.5%. There were declines from June output levels for inorganic chemicals, synthetic materials, coatings, other specialty chemicals and agricultural chemicals. Chemical capacity utilization also eased from 81.4% in June to 80.5% in July. Compared to a year ago, chemical production remained ahead by 0.9% Y/Y.
Chemical import prices (which do not include tariffs) rose 0.7% in July but remained lower compared to a year earlier for a 32nd straight month.
Energy Wrap-Up
• Oil prices were slightly higher than a week ago, leading up to the Trump-Putin summit.
• U.S. natural gas prices eased as the summer cooling season starts to wind down.
• The combined oil & gas rig count was flat at the end of last week at 534.
For More Information
ACC members can access additional data, economic analyses, presentations, outlooks, and weekly economic updates through ACCexchange: https://accexchange.sharepoint.com/Economics/SitePages/Home.aspx
In addition to this weekly report, ACC offers numerous other economic data that cover worldwide production, trade, shipments, inventories, price indices, energy, employment, investment, R&D, EH&S, financial performance measures, macroeconomic data, plus much more. To order, visit http://store.americanchemistry.com/.
Every effort has been made in the preparation of this weekly report to provide the best available information and analysis. However, neither the American Chemistry Council, nor any of its employees, agents or other assigns makes any warranty, expressed or implied, or assumes any liability or responsibility for any use, or the results of such use, of any information or data disclosed in this material.
Contact us at ACC_EconomicsDepartment@americanchemistry.com.