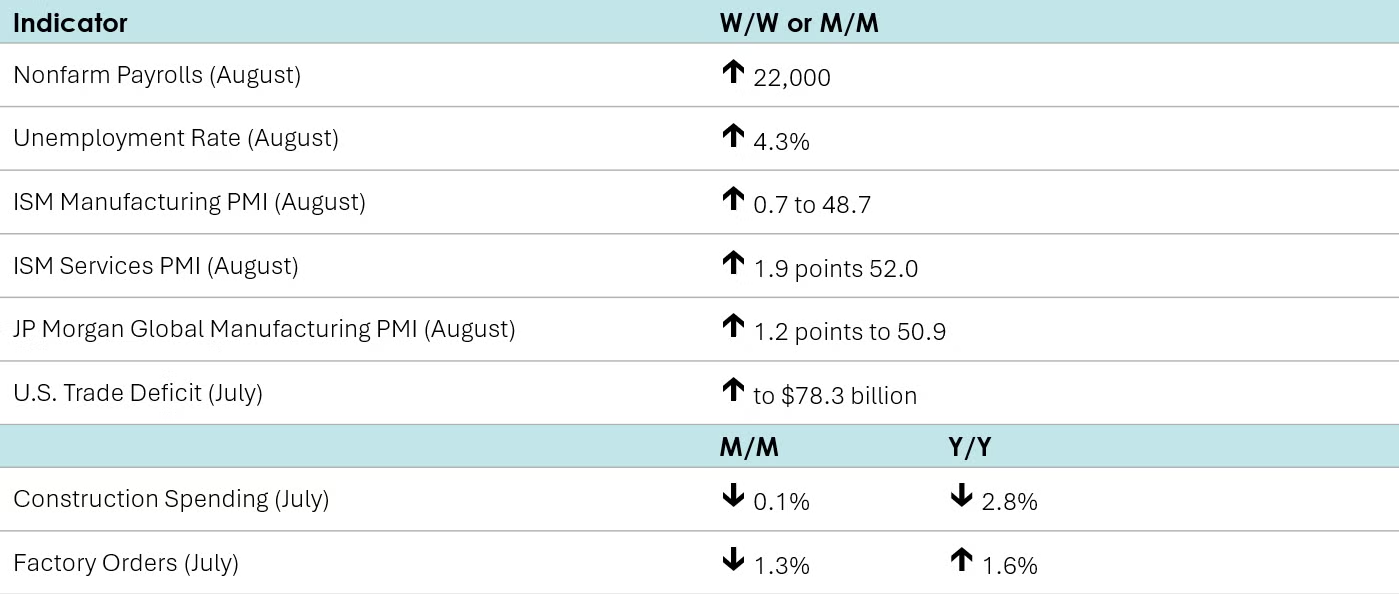
Nonfarm payrolls increased by 22,000 in August, down from a slightly revised gain of 79,000 in July. Since the beginning of the year, the economy has added on average just under 75,000 jobs per month. Jobs in manufacturing fell 12,000 and have shrunk 78,000 since the beginning of the year. Construction jobs slid by 7,000 while the services sector added 63,000, led by modest gains in healthcare, leisure and hospitality, and retail trade. Average hourly earnings rose 3.7% Y/Y, down from a 3.9% Y/Y increase in July and the lowest reading since July 2024. From the separate household survey, the unemployment rate ticked higher to 4.3%. Although still historically low, the August unemployment rate is the highest since October 2021. The labor participation rate moved slightly higher to 62.3%, up from 62.2 in July, which itself was the lowest rate since November 2022.
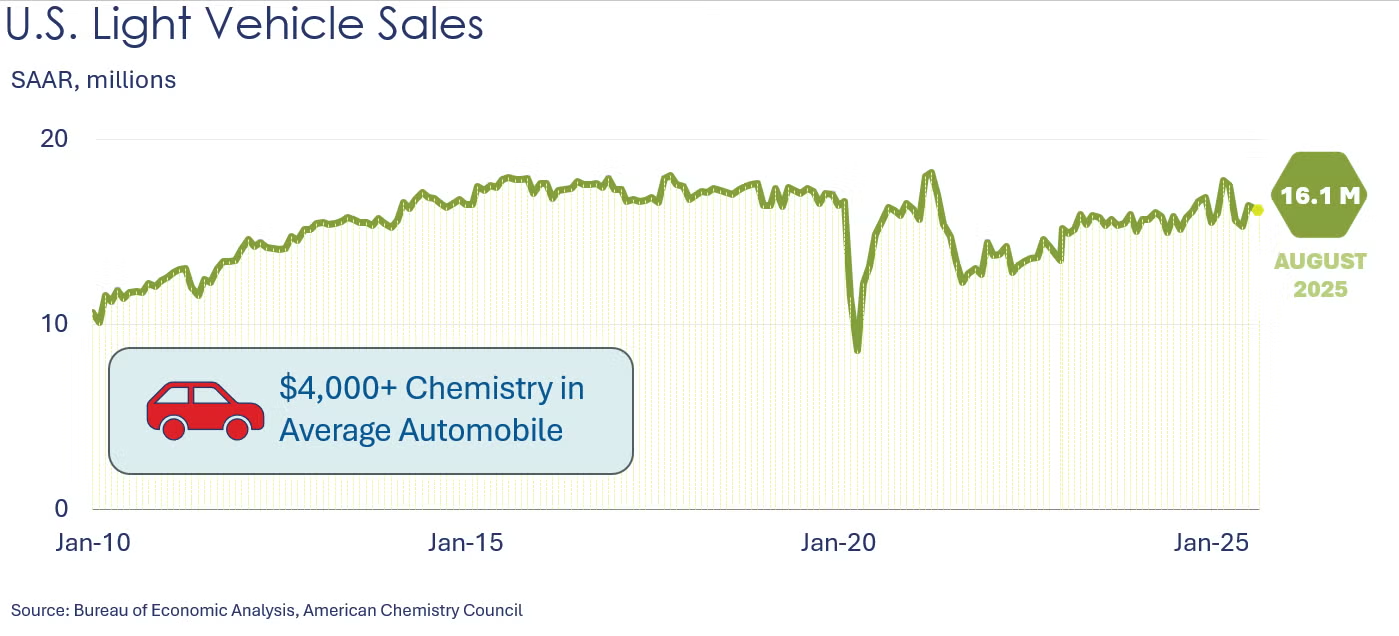
Light vehicle sales totaled 16.1 million units in August, with light truck sales reaching 13.4 million and auto sales coming in at 2.7 million (all at a seasonally adjusted annual rate, or SAAR). Total light vehicle sales shrank 2.9% on the month after having gained 8.0% in July. Excluding July, sales dropped each month starting in April of this year. Total light vehicle sales in August were pulled down by a 3.8% drop in light truck sales, which retreated from a 9% gain in July. On the flip side, auto sales grew 2.1% in August on top of a 2.8% gain in July. This may reflect the expiration of EV tax credits at the end of September. Both auto and light truck sales lost ground each month between April and June. Compared to a year ago, total light vehicle sales increased 6.2% Y/Y in August. Light trucks added 9.4% Y/Y, the 12th consecutive Y/Y increase. Autos, however, lost 7.6% Y/Y, their fifth consecutive Y/Y decline.
Construction spending dipped 0.1% in July after losing 0.4% in June. Excluding April, spending has dropped each month since September of last year. July’s small decline was led by a 0.5% drop in spending on privately-funded nonresidential projects. On the flip side, privately-funded residential and publicly-funded nonresidential projects edged slightly higher. Compared to a year ago, total construction spending was down by 2.8% Y/Y.
After dropping 4.8% in June, factory orders fell a further 1.3% in July, pulled down by transportation equipment, specifically nondefense aircraft which tumbled 32.7%, following a 52.7% slump in June. Maritime vessel orders also shrank significantly over the two months. On the flip side, motor vehicle orders increased in July. Orders for IT equipment rose slightly, driven by computers and nondefense communications equipment. Electrical equipment and construction machinery and materials orders also increased. Orders for core business goods (nondefense capital goods, excluding aircraft) advanced 1.1%, following a 0.6% drop in June. Unfilled orders (a measure of the manufacturing pipeline) were flat following a 0.9% rise in June. Manufacturing shipments grew by 0.9% in July while manufacturing inventories were 0.3% higher. The inventories-to-shipments ratio dipped to 1.56 from 1.57 in June.
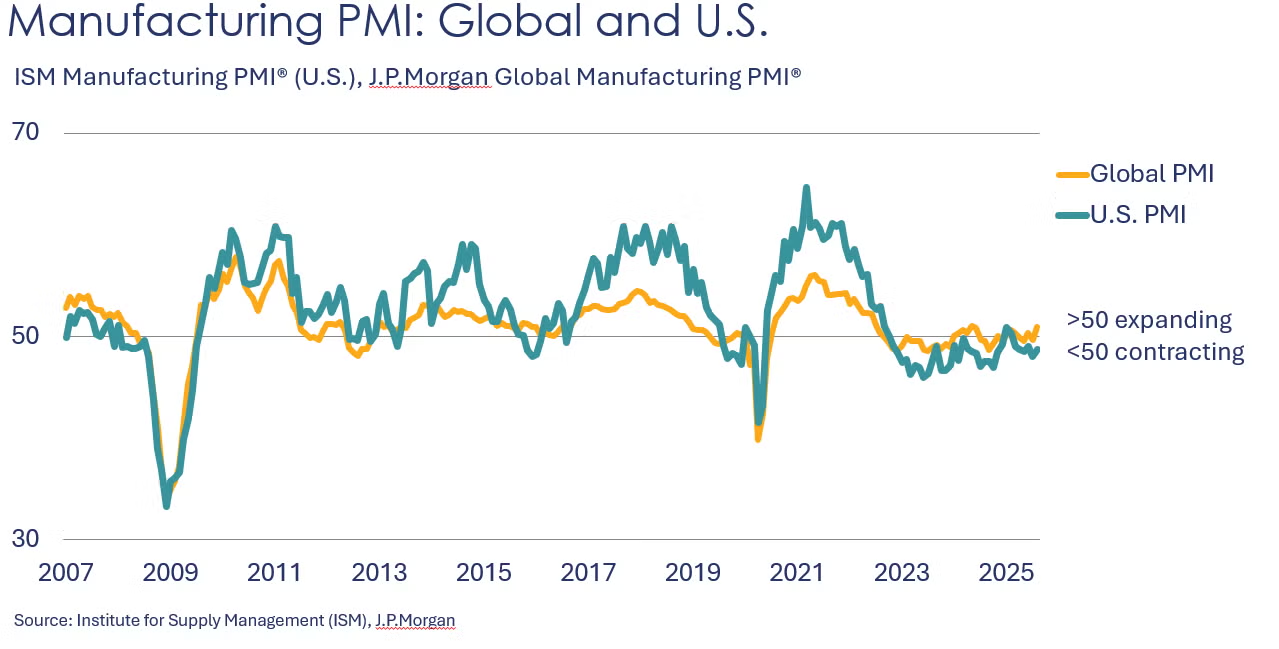
The ISM Manufacturing PMI rose 0.7 points to 48.7 in August, the sixth consecutive month below 50 which indicates manufacturing activity contracted, though at a slower pace than in July. While production declined (after a small expansion in July), new orders expanded for the first time since January. Export orders, employment and inventories continued to contract at a slower pace and order backlogs and imports contracted at a faster pace. Supplier deliveries slowed suggesting some friction in supply chains. Seven manufacturing industries reported growth while 10 reported contraction, including chemicals. Many of the comments continued to cite headwinds from tariffs, uncertainty, and weak sales.
Global manufacturing expanded in August according to the JP Morgan Global Manufacturing PMI, which rose 1.2 points to 50.9. Eurozone manufacturing expanded for the first time in more than three years and in the ASEAN region, manufacturing expanded at its fastest pace in 14 years.
The ISM Services PMI® rose 1.9 points to 52.0 in August to a six-month high led by an acceleration in new orders as firms moved to get merchandise into the U.S. ahead of tariff increases. Other indicators also expanded at a faster rate, including business activity/production and inventories. Employment, order backlogs, and new export orders continued to contract.
Job openings fell to 7.18 million in July, the lowest level since last September and, except for one month, the lowest since the pandemic. For the first time in four years, the labor supply (civilian labor force) exceeded labor demand (the number of job openings plus the number employed).
The U.S. trade deficit rose by $19.2 billion to $78.3 billion in July. Exports rose 0.3% to $280.5 while imports rose 5.9% to $358.8 billion. Exports of capital goods rose to an all-time high, but were offset by lower exports of industrial supplies and materials and other goods. Imports were higher for industrial supplies and materials, capital goods, consumer goods, but auto imports were lower. The goods deficit with China rose to $17.1 billion on a strong gain in imports ahead of expected tariff increases. The deficit was lower than a year ago, however.
Fed Beige Book
Published two weeks in advance of each FOMC meeting, the Beige Book presents a summary of recent economic conditions around the twelve Federal Reserve districts.
• Most of the twelve Federal Reserve Districts reported little or no change in economic activity since the prior Beige Book period—the four Districts that differed reported modest growth.
• Across Districts, contacts reported flat to declining consumer spending because, for many households, wages were failing to keep up with rising prices.
• Contacts frequently cited economic uncertainty and tariffs as negative factors.
• Retail and hospitality sectors offered deals and promotions to help price-sensitive consumers stretch their dollars—supporting steady demand from domestic leisure tourists but not offsetting falling demand from international visitors.
• The auto sector noted flat to slightly higher sales, while consumer demand increased for parts and services to repair older vehicles.
• Manufacturing firms reported shifting to local supply chains where feasible and often using automation to cut costs.
• The push to deploy AI partly explains the surge of data center construction.
• Overall, sentiment was mixed among the Districts. Most firms either reported little to no change in optimism or expressed differing expectations about the direction of change from their contacts.
Within the details of the ISM Manufacturing PMI, the chemical industry was reported to have contracted. Production, employment, inventories order backlogs, new export orders, and imports were lower in August. Customers’ inventories were deemed to be “too low” and supplier deliveries were slower. One chemical industry respondent noted, “Orders across most product lines have decreased. Financial expectations for the rest of 2025 have been reduced. Too much uncertainty for us and our customers regarding tariffs and the U.S./global economy.”
Several chemical industry-specific comments in the Fed Beige Book, including:
• “…industrial carloads were described as sluggish amid a recent deceleration in chemicals and metals shipments” (6th District - Atlanta)
• “Housewares, beverages, and chemicals producers noted weaker orders and sales, partially attributed to ongoing uncertainty surrounding trade policy.” (6th District - Atlanta)
• “Chemical manufacturers described flat to softening demand, particularly for compounds used in the production of consumer paper and pulp products.” (6th District - Atlanta)
• “…overall manufacturing employment grew moderately, although some transportation equipment and petrochemical manufacturers reported reducing staff to contain costs.” (11th District – Dallas)
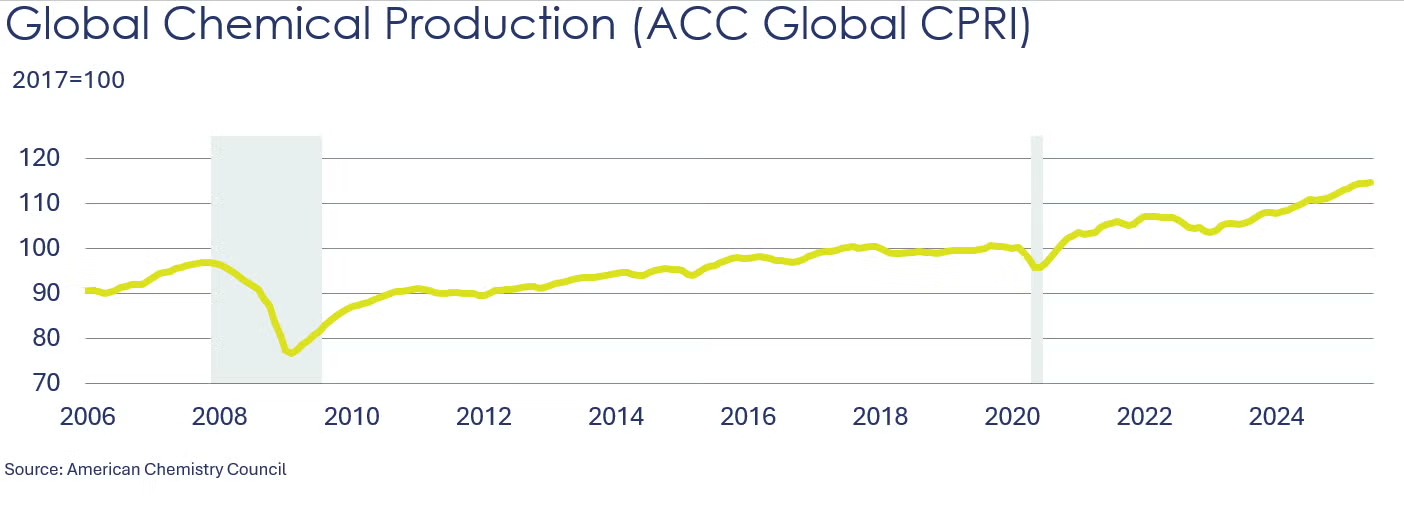
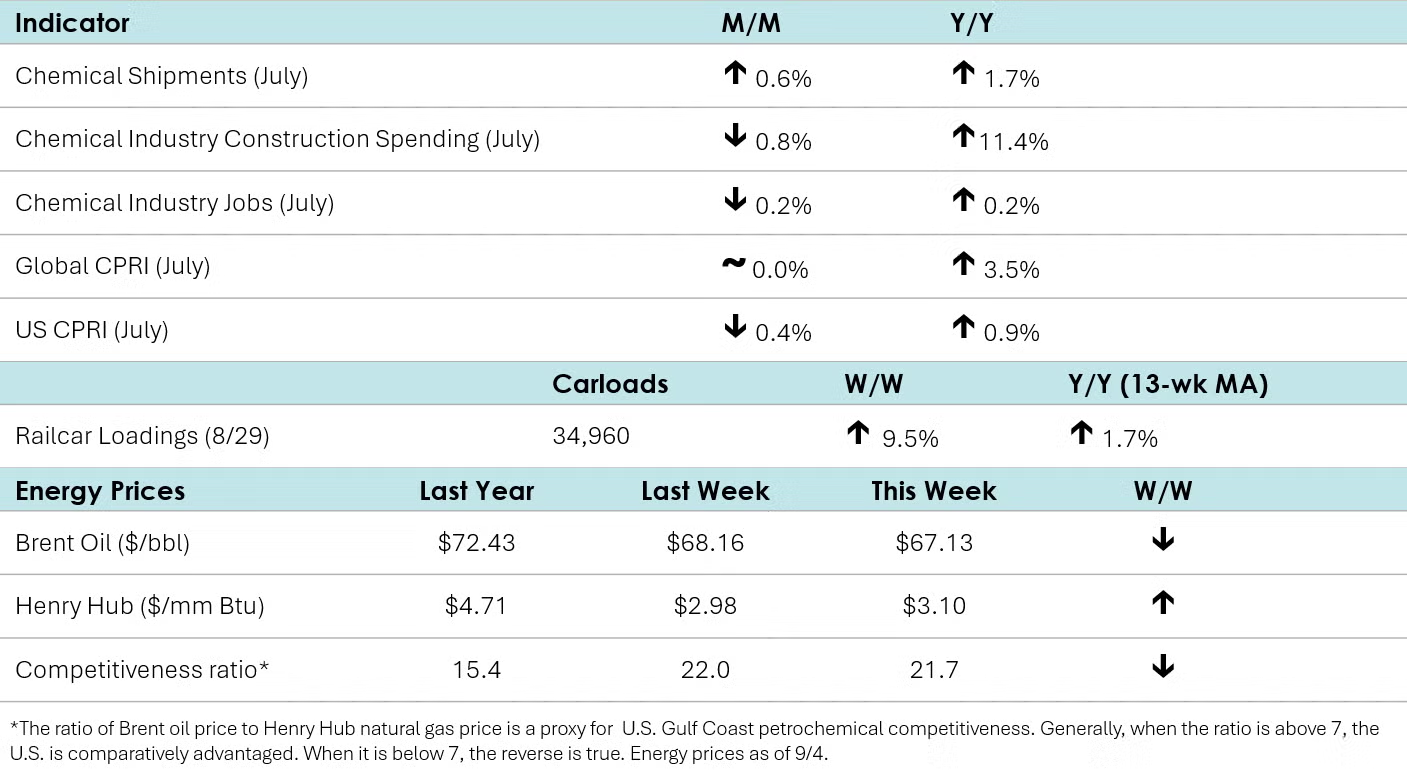
ACC’s Global Chemical Production Regional Index (Global CPRI) stalled (0.0%) in July after a modest 0.1% gain in June. Production increased in Asia and South America but declined elsewhere. Output in the Asia-Pacific region advanced as China’s robust export performance and stockpiling ahead of upcoming national events drove production in the country. European output remained weak as trade-related uncertainties continued to weigh down European orders. Output in North America decreased as U.S. production continued to decline. Growth in South American production cooled. Most segments weakened, except for agricultural chemicals and specialty chemicals. Year-over-year production rose by 3.5%.
For more details, check out our new CPRI Dashboard.
The U.S. CPRI edged down by 0.4% in July. This index measures chemical production trends based on a three-month moving average to smooth out month-to-month volatility. Production declined in most regions, except the Gulf Coast, where production increased. Overall, the U.S. CPRI was 0.9% higher than it was a year ago.
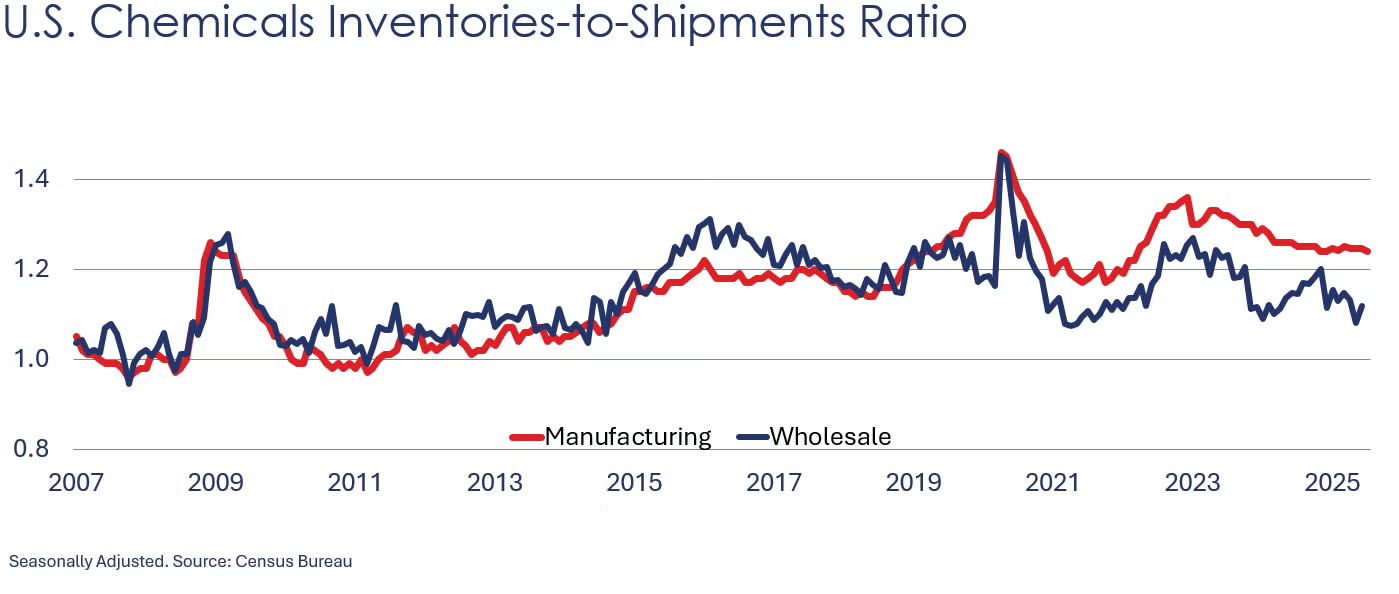
Chemical shipments rose to $57.7 billion in July, up 0.6% from June. Increases in agricultural chemicals and other chemicals were partly offset by declines in coatings & adhesives. Chemical inventories were flat, with all the categories remaining virtually unchanged. Compared to a year ago, chemical shipments were up 1.7% Y/Y (same increase as in June) while inventories were up 1.2%. The inventories-to-shipments ratio for chemicals dipped to 1.24 from 1.25 in June.
According to data released by the Association of American Railroads, chemical railcar loadings were up to 34,960 for the week ending August 30th. Loadings were up 1.7% Y/Y (13-week MA), up 1.8% YTD/YTD and have been on the rise for eight of the last 13 weeks.
Chemical construction spending fell by 0.8% in July to a $43.3 billion annual pace. Spending was up 11.4% Y/Y, however. As a share of overall manufacturing construction, chemicals accounted for 19.4%.
Chemical industry employment fell in July, down 0.2% to 548,600 (up 0.2% Y/Y). Employment in plastic resin manufacturing rose, however, up by 0.5% to 62,600, a level 2.6% higher than last July. (Note that data at the detailed industry level are lagged one month behind the headline jobs report.)
In August, combined chemical and pharmaceutical jobs rose by 2,400 to 906,700, a level up 0.8% Y/Y. There were gains in both the number of supervisory & non-production and production workers. Average hourly earnings for production workers rose 2.5% Y/Y to $31.65. The average workweek for production workers moved higher by 12 minutes to 42.2 hours in August. With the gain in both production workers and the average workweek, the implied labor input into the chemical industry rose in August, in contrast to the ISM PMI® report which reported that the chemical industry contracted.
Energy Wrap-Up
• Oil prices slid as OPEC+ announced it would consider another output hike.
• U.S. natural gas prices edged slightly higher.
• The combined oil & gas rig count fell by two to 529 during the week ending August 29th.
For More Information
ACC members can access additional data, economic analyses, presentations, outlooks, and weekly economic updates through ACCexchange: https://accexchange.sharepoint.com/Economics/SitePages/Home.aspx
In addition to this weekly report, ACC offers numerous other economic data that cover worldwide production, trade, shipments, inventories, price indices, energy, employment, investment, R&D, EH&S, financial performance measures, macroeconomic data, plus much more. To order, visit http://store.americanchemistry.com/.
Every effort has been made in the preparation of this weekly report to provide the best available information and analysis. However, neither the American Chemistry Council, nor any of its employees, agents or other assigns makes any warranty, expressed or implied, or assumes any liability or responsibility for any use, or the results of such use, of any information or data disclosed in this material.
Contact us at ACC_EconomicsDepartment@americanchemistry.com.

