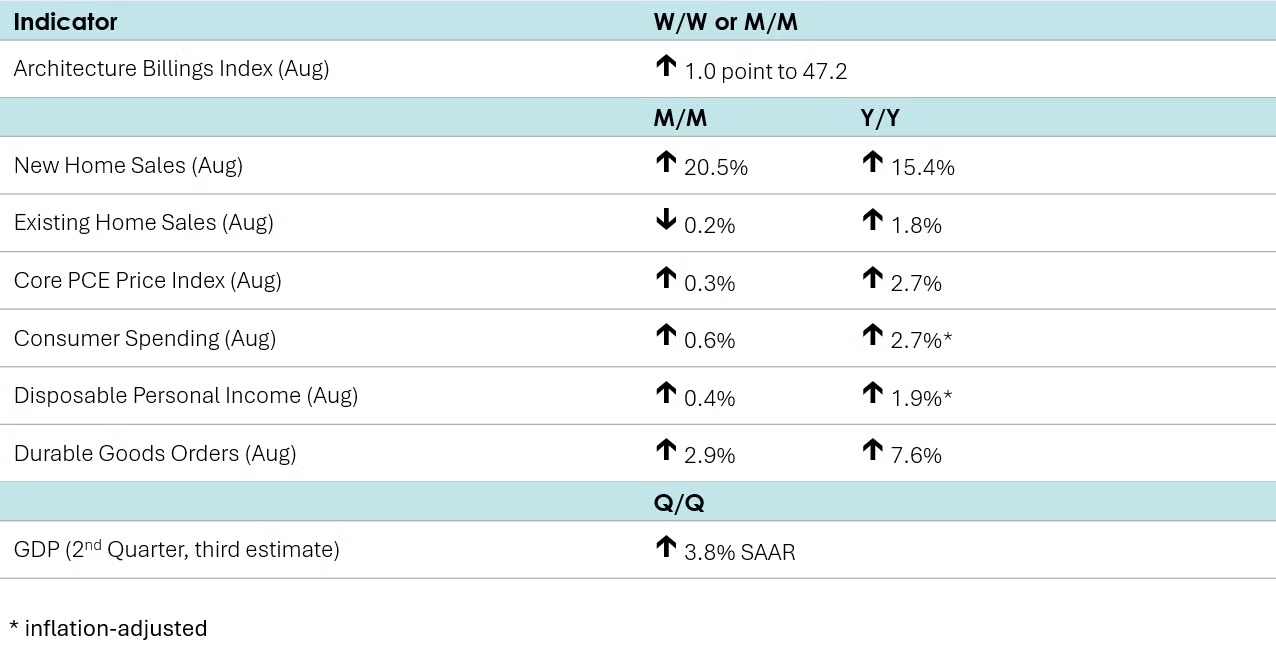
A leading indicator of nonresidential construction, the Architectural Billings Index (ABI) rose one point in August to 47.2. An index reading below 50 indicates that a majority of firms are still seeing declining billings. August was the 10th consecutive month of contraction. At the same time, the value of newly signed design contracts at firms fell for the 18th straight month. However, looking ahead, inquiries into new work expanded for the fourth straight month, a sign that the ongoing weakness in the nonresidential construction business may be approaching a bottom.
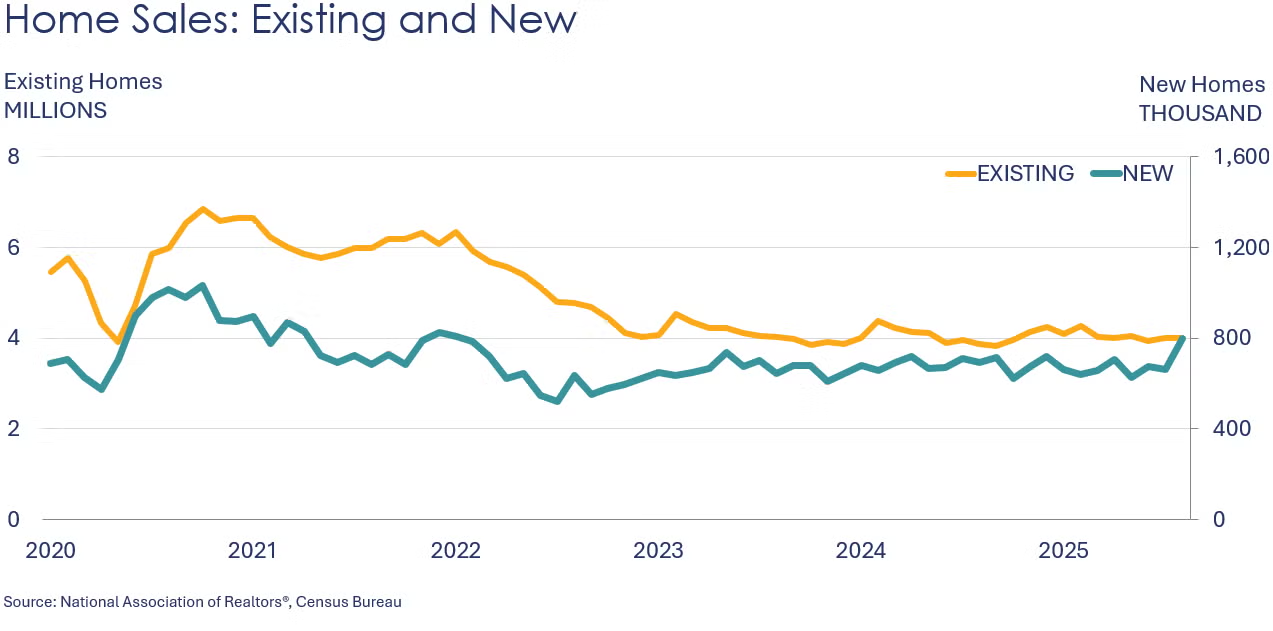
New home sales surged in August, up by 20.5%, with gains across all regions. Builders offered increased incentives and cut prices to clear inventories, which were lower by 4.0% from a year ago. At the current sales pace, inventories represent a 7.4-month supply, down from 9.0 months in July. The median sales price was up 1.9% Y/Y to $413,500.
Existing home sales slid 0.2% in August to a 4.0 million seasonally adjusted annual rate (SAAR), essentially unchanged from July. Inventories dropped 1.3%. Sales and inventories grew 1.8% Y/Y and 11.7% Y/Y, respectively. At the current sales pace, inventories represent 4.6 months’ supply, higher than the 4.2-month mark a year ago. The median sales price rose 2.0% Y/Y to $422,600.
Headline durable goods orders rose 2.9% in August, following a revised 2.7% drop in July. The increase was led by strong gains in the volatile defense and nondefense aircraft and parts categories, as well as more tame increases in communications equipment, motor vehicles and parts, machinery, and fabricated metals. On the other hand, orders for computers and electronic products (i.e., semiconductors) as well as electrical equipment declined. Core business orders (nondefense capital goods, excluding aircraft) gained 0.6% after adding 0.8% in July. Compared to a year ago, core orders were up 4.0% Y/Y while headline orders were up 7.6% Y/Y.
Consumer spending rose 0.6% in August, led by higher spending on transportation services, food services and accommodations, recreational goods and vehicles, and financial services & insurance. Disposable personal income also rose, up by 0.4%, driven by higher employee compensation and personal current transfer receipts. The savings rate dropped to 4.6% from 4.8% in July, now standing at its lowest level since December 2024. Compared to a year ago, inflation-adjusted consumer spending was up 2.7% Y/Y (the highest increase since April) while income was 1.9% Y/Y higher.
The headline personal consumption expenditures (PCE) price index rose 2.7% Y/Y, up from 2.6% Y/Y in July. Excluding food and energy, the core PCE price index added 2.9% Y/Y, the same increase seen in July and the highest since February.
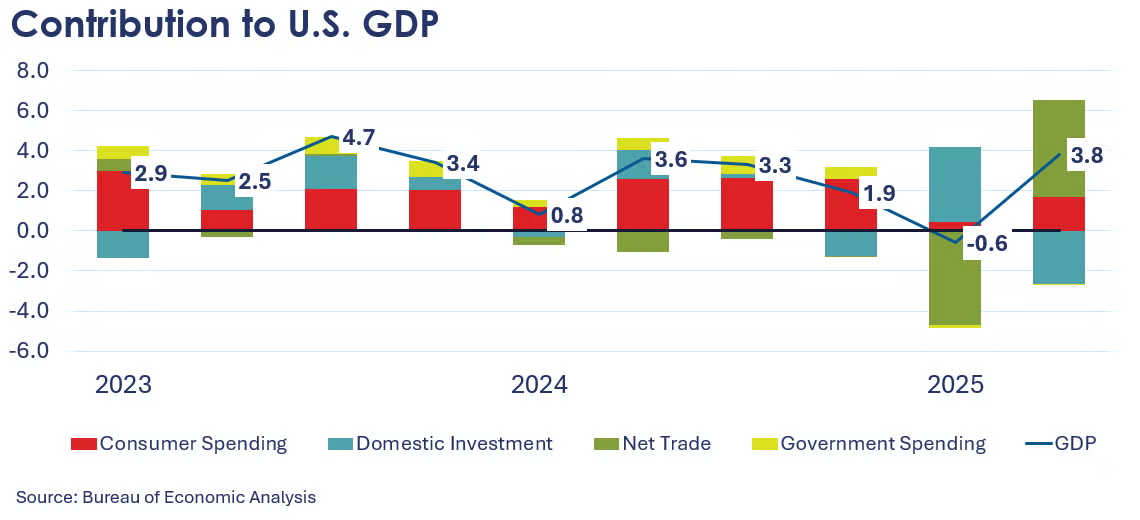
U.S. GDP for the second quarter rose at a 3.8% seasonally adjusted annual rate (SAAR) according to BEA’s third and final estimate. The upward revision reflected higher contributions from consumer spending and a lower decline in investment. As with previous estimates, the largest positive contribution came from sharply lower imports (which count as a negative in GDP accounting). U.S. GDP was up 2.1% Y/Y.
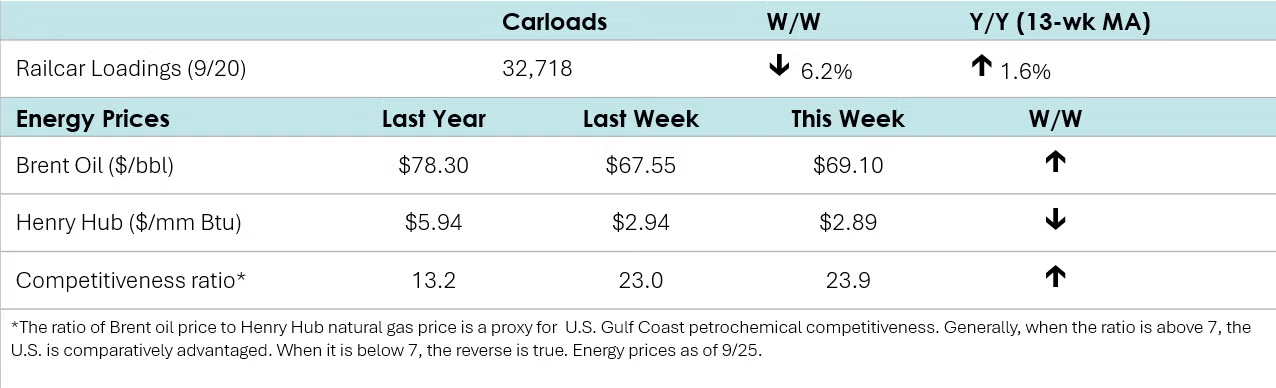
According to data released by the Association of American Railroads, chemical railcar loadings were up/down to 32,718 for the week ending September 20th. Loadings were up 1.6% Y/Y (13-week MA), up 1.6% YTD/YTD and have been on the rise for seven of the last 13 weeks.
Energy Wrap-Up
• Oil prices hit a seven-week high earlier in the week as geopolitical tensions escalated.
• U.S. natural gas prices remained below $3/mmbtu.
• The combined oil & gas rig count rose by two to 536 at the end of last week.
For More Information
ACC members can access additional data, economic analyses, presentations, outlooks, and weekly economic updates through ACCexchange: https://accexchange.sharepoint.com/Economics/SitePages/Home.aspx
In addition to this weekly report, ACC offers numerous other economic data that cover worldwide production, trade, shipments, inventories, price indices, energy, employment, investment, R&D, EH&S, financial performance measures, macroeconomic data, plus much more. To order, visit http://store.americanchemistry.com/.
Every effort has been made in the preparation of this weekly report to provide the best available information and analysis. However, neither the American Chemistry Council, nor any of its employees, agents or other assigns makes any warranty, expressed or implied, or assumes any liability or responsibility for any use, or the results of such use, of any information or data disclosed in this material.
Contact us at ACC_EconomicsDepartment@americanchemistry.com.