Note: Due to the Thanksgiving holiday, we will publish the Weekly Chemistry and Economic Trends report on Wednesday, November 26th.
The U.S. Census Bureau announced that is updating its economic indicator release calendar in coordination with other agencies and the Office of Management and Budget in the aftermath of the federal government shutdown. New economic release dates may differ from the schedule published prior to the shutdown.
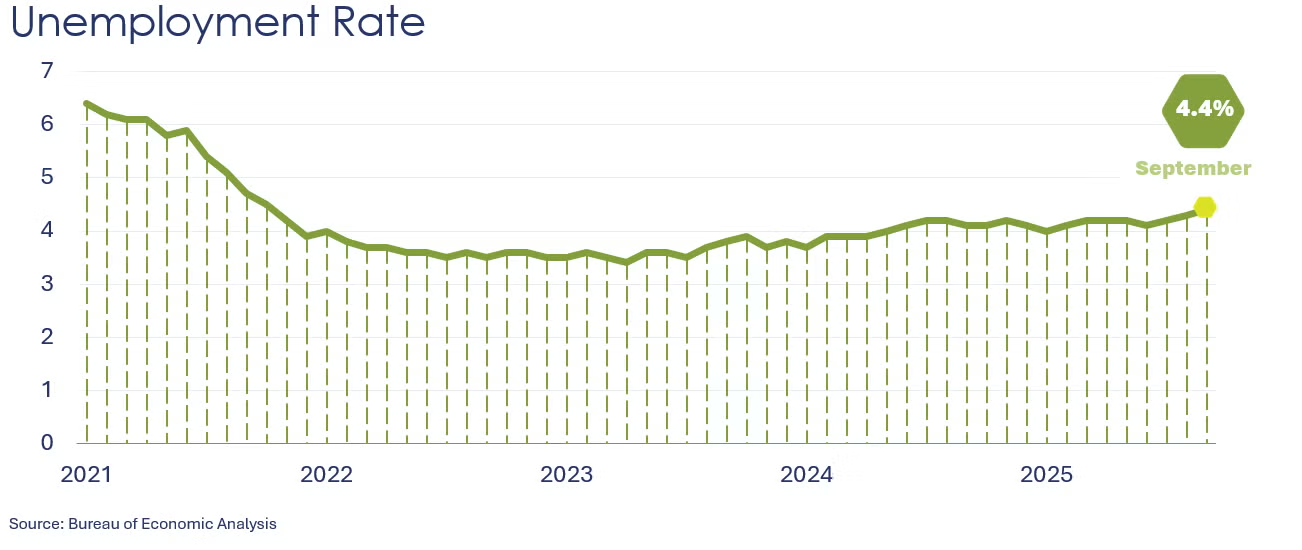
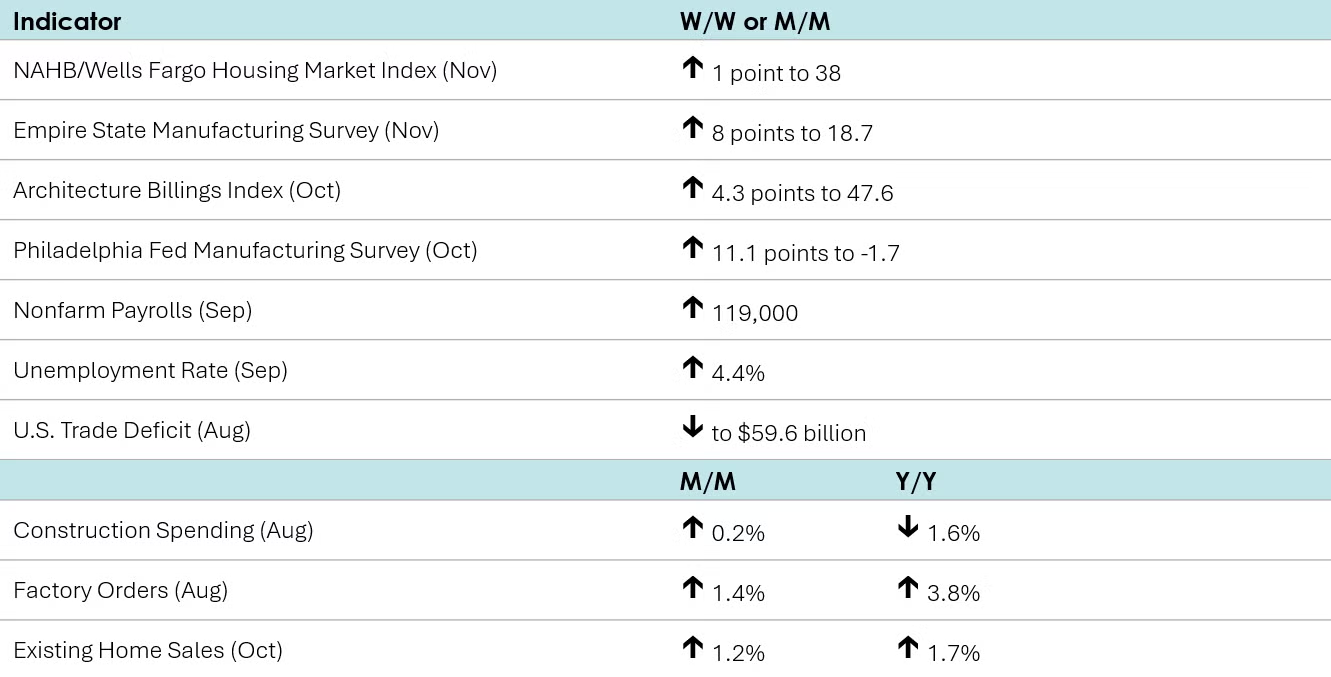
Nonfarm payrolls increased by 119,000 in September, up from a downwardly revised 4,000 decline in August. Jobs in manufacturing fell for a fifth straight month, down by 6,000. Construction jobs rose, however, by 19,000 and the services sector added 87,000, by gains in healthcare, leisure and hospitality, and trade services. Average hourly earnings rose 3.8% Y/Y a similar increase to August. From the separate household survey, the unemployment rate continued to move higher to 4.4%, the highest rate in four years. The labor participation rate moved slightly higher to 62.4%, up from 62.3% in August, which was the lowest rate since November 2022.
According to the NY Fed’s Empire State Manufacturing Survey, manufacturing activity increased moderately in New York State in November, registering its fourth positive reading in the last five months. The general business conditions index rose eight points to 18.7. The new orders, shipments, inventory, and employment indexes also climbed. Capital spending plans increased as firms expect business conditions to improve in the next few months, although optimism was higher in October. Price indexes dipped but remain elevated.
In contrast to the New York survey, manufacturing activity continued to decline at a slower pace in the Philadelphia region, with the current general activity index registering -1.7 in November (up from -12.7 in October), according to the Philadelphia Fed’s Manufacturing Business Outlook Survey. The shipments index dropped 14.7 points to -8.7 (signaling contraction), while the new orders index tumbled 26.8 points to -8.6. Employment and prices continued to increase. Expectations for activity over the next six months remained positive and improved from October’s reading. When asked about capital expenditures in 2026, 26.7% of firms indicated they planned to increase spending while none expected a decrease.
Homebuilder confidence improved slightly in November as the NAHB/Wells Fargo Housing Market Index increased one point to 38, the highest level since April. Current sales activity and buyer traffic posted gains, while sales expectations for the next six months declined. The survey revealed that 41% of builders cut prices in November, with the average price reduction coming in at 6%, the same as in the previous month.
Existing home sales edged 1.2% higher in October to a 4.1 million annual pace, the fastest pace since February. Inventories fell, however, off 0.7% and represent a 4.4-month supply, a little lower than a month ago. The median selling price was up 2.1% Y/Y to $415,200. Mortgage rates continuing to move lower in October, likely contributing to the uptick in activity.
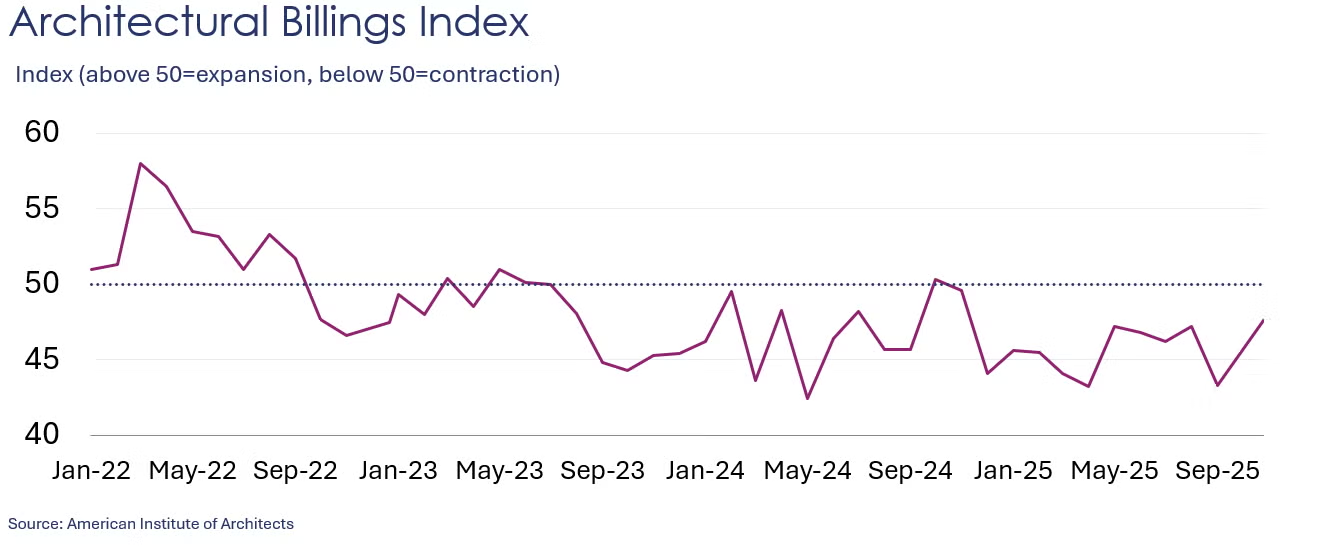
A leading indicator of nonresidential construction, the Architectural Billings Index (ABI) increased 4.3 points 47.6 in October. While still under 50, the current level is the highest since December 2024 (an index reading below 50 indicates a majority of firms reported a decline in billings). October marked the 12th consecutive month of contractions. The value of newly signed design contracts index rose from September but remained under 50, while inquiries into new work improved significantly, with the index reaching 54.8.
Construction spending increased 0.2% in August, on top of another 0.2% gain in July. Spending rose for three consecutive months through August, a reversal from nearly back-to-back monthly declines starting in September of last year. The August increase was led by a 0.8% rise in spending on privately funded residential projects. On the flip side, privately funded nonresidential spending lost 0.3% while publicly funded construction was flat. Compared to a year ago, total construction spending was down by 1.6% Y/Y, the same decline witnessed in July.
After dropping 1.3% in July, factory orders rose 1.4% in August, propelled by orders for machinery (construction, mining, and metalworking equipment), and transportation equipment. Within the latter, nondefense aircraft and parts orders jumped 21.8% after losing 31.4% in July. Orders for defense aircraft and parts and maritime vessels also rose strongly in August. Motor vehicle orders were flat after gaining 1.6% in July. Orders for IT and electrical equipment declined slightly, while orders for core business goods (nondefense capital goods, excluding aircraft) advanced 0.4%, following a 0.7% rise in July. Unfilled orders (a measure of the manufacturing pipeline) gained 0.6% on top of a 0.7% rise in July. Manufacturing shipments declined 0.2% in August while manufacturing inventories were virtually unchanged, with the inventories-to-shipments ratio remaining at 1.56.
The U.S. trade deficit dropped by $18.6 billion to $59.6 billion in August. Exports rose 0.1% to $280.8 while imports fell 5.1% to $340.4 billion. Exports of capital goods (led by computers) rose but were offset by declines in industrial supplies and materials, motor vehicles, pharmaceuticals, and other goods. Imports were lower for industrial supplies and materials, consumer goods, and capital goods, although within the latter, computer imports rose. The goods deficit with China rose to $15.4 billion from $14.7 billion in July. However, year to date, this deficit totaled $153.4 billion, down 19.9% from the same period last year.
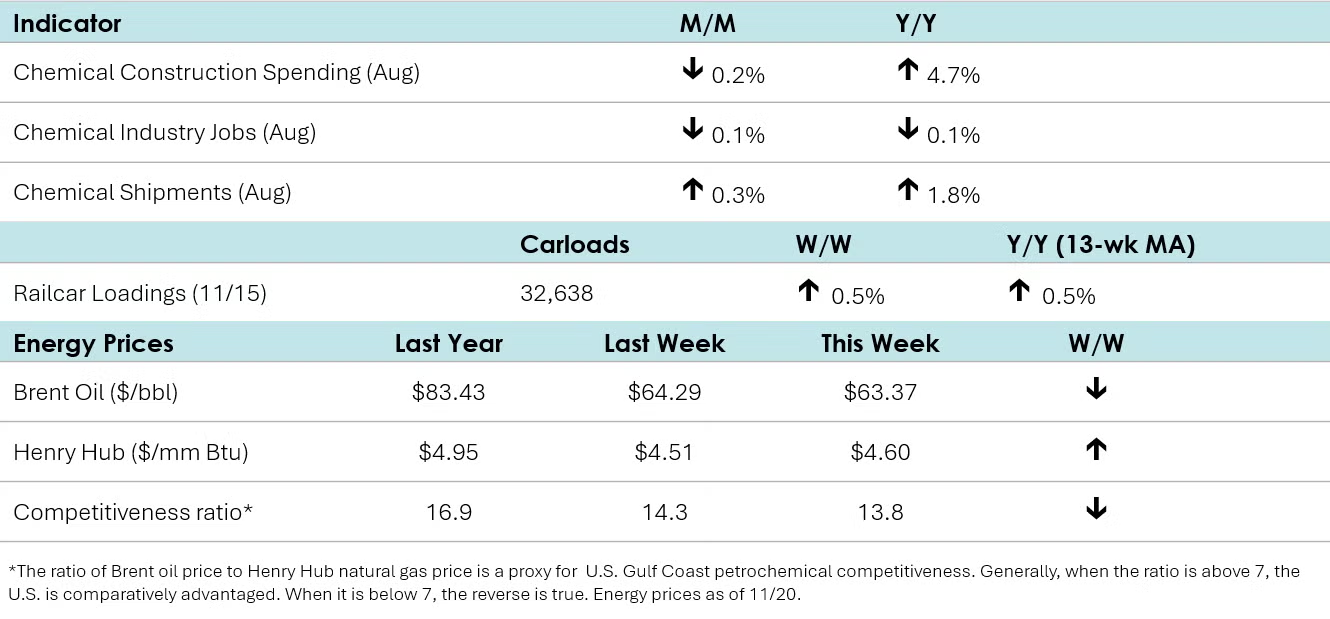
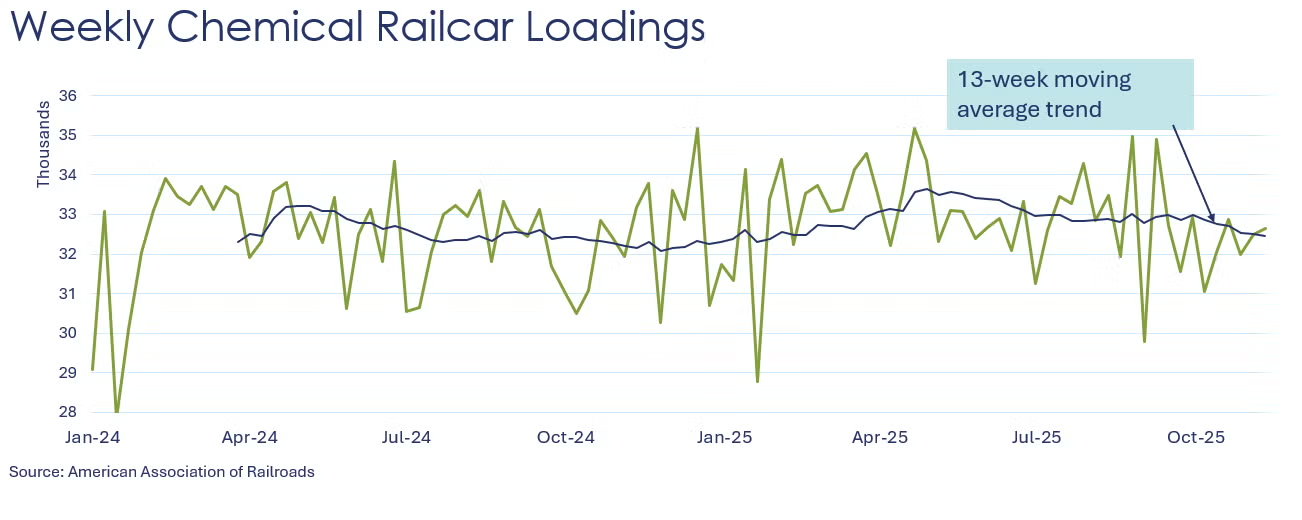
According to data released by the Association of American Railroads, chemical railcar loadings were up to 32,638 for the week ending November 15th. Loadings were up 0.5% Y/Y (13-week MA), up 1.5% YTD/YTD and have been on the rise for seven of the last 13 weeks.
Chemical construction spending fell 0.2% in August to a $43.3 billion annual pace after dropping 0.9% in July. Spending was up 4.7% Y/Y, down from an 11.7% Y/Y rise in July. As a share of overall manufacturing construction, chemicals accounted for 19.8% in August, up from 19.6% the previous month.
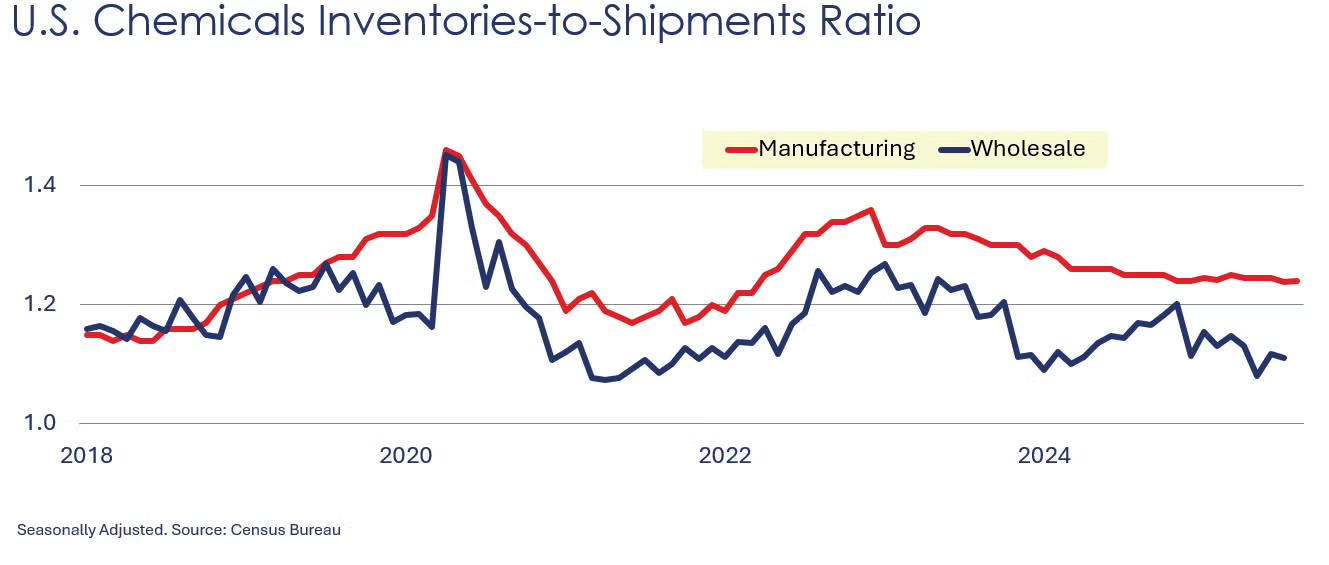
Chemical shipments rose to $57.9 billion in August, up 0.3% from July. Shipments of agricultural chemicals and coatings & adhesives increased while all other chemicals were flat. Chemical inventories were virtually unchanged, with stocks of coatings and adhesives dropping while all other chemicals increased slightly. Agricultural stocks were flat. Compared to a year ago, chemical shipments were up 1.8% Y/Y (same increase as in July) while inventories were up 0.4%. The inventories-to-shipments ratio for chemicals was 1.24, unchanged from July.
Chemical industry employment fell in August, down 0.1% to 548,100 (off 0.1% Y/Y). Employment in plastic resin manufacturing also edged lower, off by 0.2% to 62,500, a level 2.3% higher than last August. (Note that data at the detailed industry level are lagged one month behind the headline jobs report.)
In September, combined chemical and pharmaceutical jobs rose by 900 to 906,100, a level up 0.9% Y/Y. Gains in production workers were offset by lower employment in supervisory & non-production occupations. Average hourly earnings for production workers rose 1.0% Y/Y to $31.65. The average workweek for production workers moved higher by 6 minutes to 42.3 hours in September, the most weekly hours worked since 2018. With the gain in both production workers and the average workweek, the implied labor input into the chemical industry rose in September, in contrast to the ISM PMI® report which reported that the chemical industry contracted.
Energy Wrap-Up
• Oil prices eased with renewed optimism about U.S.-led peace talks between Russia and Ukraine.
• Natural gas prices moved higher as a polar vortex is in the forecast over the few weeks.
• With colder temperatures last week, natural gas inventories fell by 14 BCF, the first draw of the 2025-26 heating season.
• The combined oil & gas rig count remained steady at 542.
For More Information
ACC members can access additional data, economic analyses, presentations, outlooks, and weekly economic updates through ACCexchange: https://accexchange.sharepoint.com/Economics/SitePages/Home.aspx
In addition to this weekly report, ACC offers numerous other economic data that cover worldwide production, trade, shipments, inventories, price indices, energy, employment, investment, R&D, EH&S, financial performance measures, macroeconomic data, plus much more. To order, visit http://store.americanchemistry.com/.
Every effort has been made in the preparation of this weekly report to provide the best available information and analysis. However, neither the American Chemistry Council, nor any of its employees, agents or other assigns makes any warranty, expressed or implied, or assumes any liability or responsibility for any use, or the results of such use, of any information or data disclosed in this material.
Contact us at ACC_EconomicsDepartment@americanchemistry.com.