
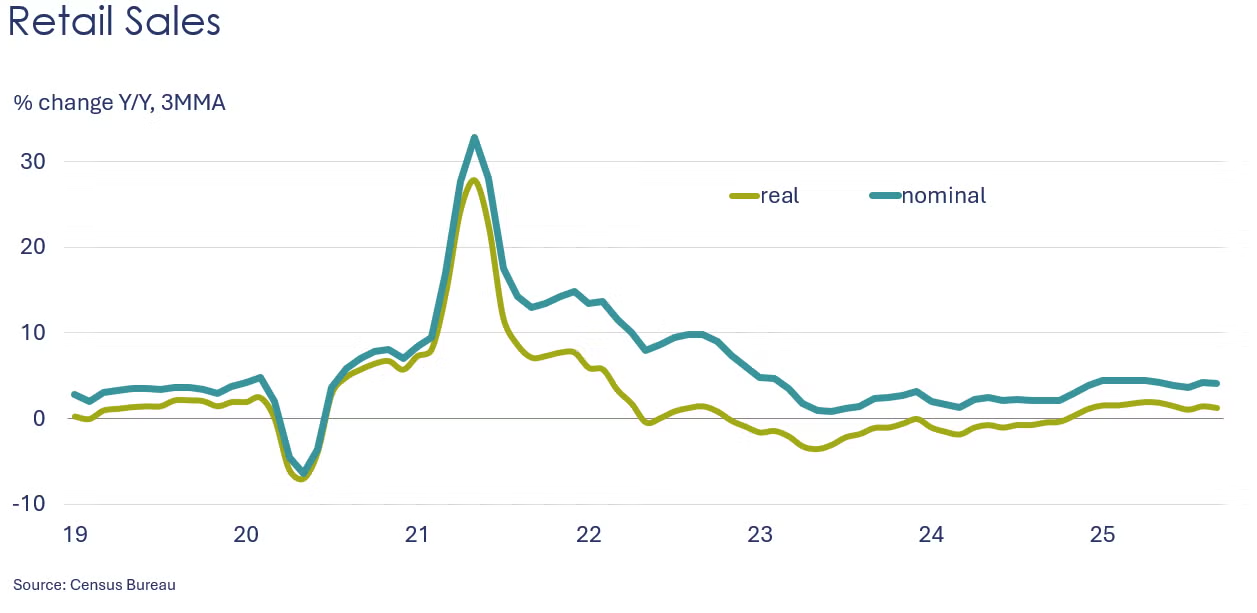
Retail sales increased by 0.2% in September with mixed results among segments. The largest gains were in gas station sales (driven by higher gasoline prices), health & personal care stores, restaurants, and furniture & home furnishing stores. Sales of motor vehicles & parts, electronics, clothing & accessories, sporting goods declined. Sales at online platforms also declined. Compared to a year ago, retail sales were up 4.3% Y/Y.
Following a 0.1% decline in August, headline producer prices moved higher in September, up 0.3%. Sixty percent of the gain in goods prices was from higher gasoline prices. Prices were also higher for meats, electric power, natural gas liquids, motor vehicles and equipment and ethanol. Compared to a year ago, producer prices were up 2.7%, the same as last month. Core producer prices (excluding the volatile food and energy components) rose at a 2.9% pace for a third consecutive month.
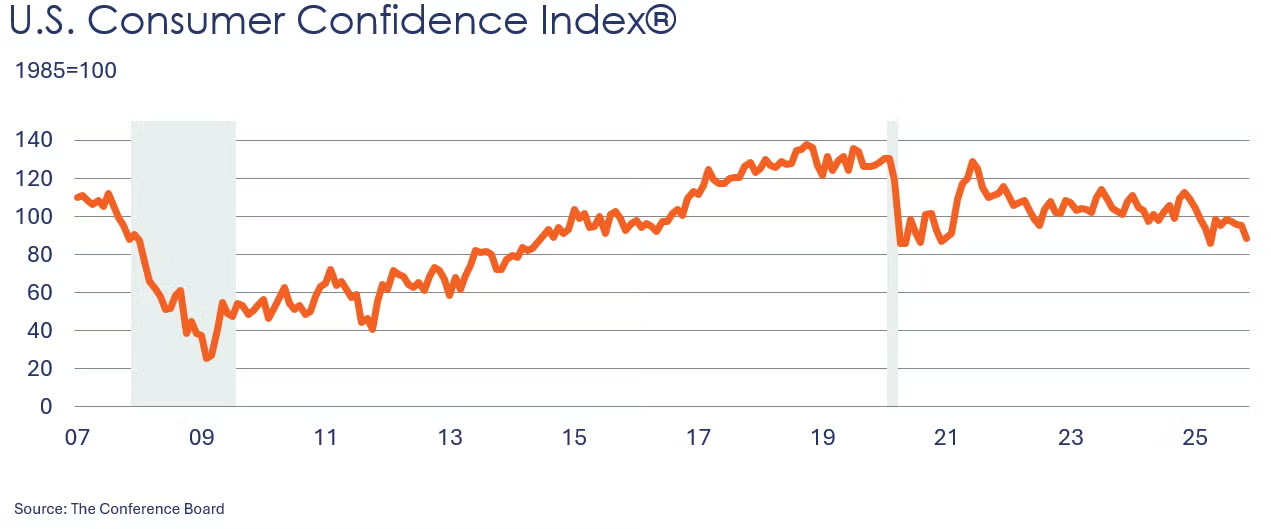
Consumer confidence fell in November, with the index losing 6.8 points to 88.7, the second lowest level since April. The expectations index dropped 8.6 points to 63.2, the tenth consecutive reading below 80, signaling a recession is ahead. All three components of the expectation index, namely employment prospects, future income, and business conditions, deteriorated significantly. Pessimism was fueled by concerns about inflation, tariffs, politics, and the recent federal government shutdown, according to respondents’ write-in responses. Purchasing plans for big-ticket items shrank in November, including plans to buy used and new cars, household appliances, and electronics. Plans to purchase homes declined slightly but remained relatively high.
Overall manufacturing conditions remained weak in Texas in November, according to business executives surveyed in the Dallas Fed’s Texas Manufacturing Outlook Survey. The general business activity index fell 5.4 points to -10.4. Production, shipments, and new orders accelerated, however while unfilled orders and finished goods inventories contracted. Expectations for business conditions six months ahead continued to improve.
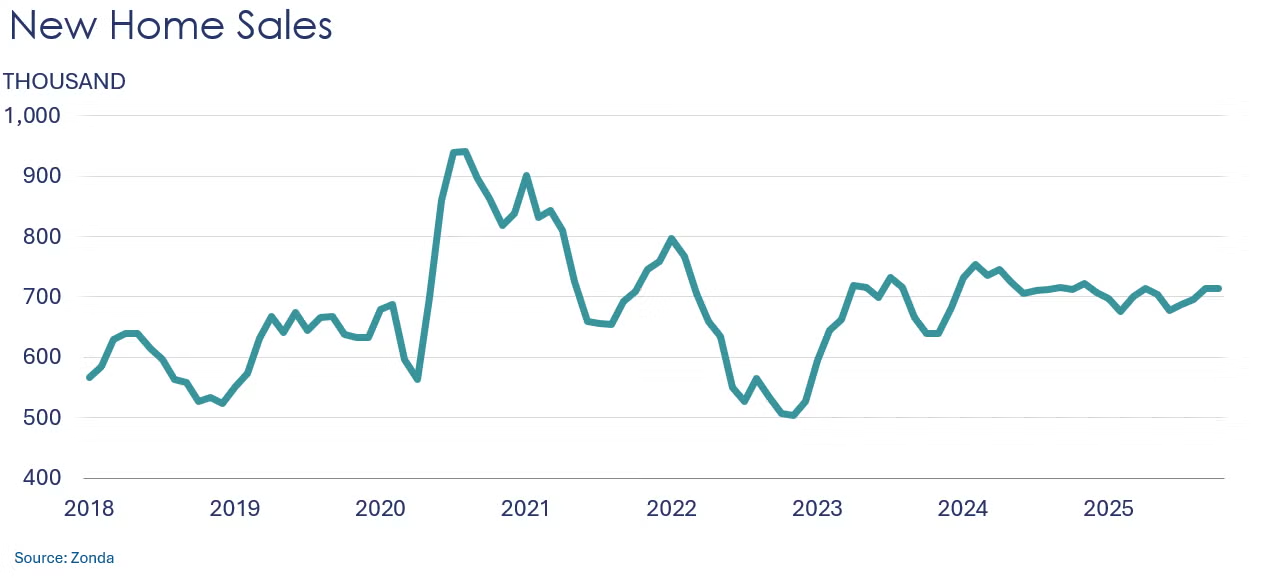
New home sales were virtually flat in October (up 0.1%) after rising 2.6% in September, according to Zonda, a real estate data firm (Zonda’s new single-family home sales metric counts the number of new home contract sales each month and accounts for both cancellations and seasonality.) Sales increased each month since July, with October’s reading being the smallest rise over that period. Compared to last year, sales inched up 0.2% Y/Y, an improvement over the nine consecutive Y/Y declines recorded since January.
Headline durable goods orders rose 0.5% in September, following a 3.0% gain in August. Broad gains across major sectors was offset by lower orders for civilian aircraft. Core business goods (nondefense capital goods, excluding aircraft) rose 0.9% for a second straight month. Compared to a year ago, overall durable orders were up 9.6% Y/Y while core orders were up 5.3% Y/Y.
Wholesale inventories were flat in August, while sales ticked only slightly higher (up 0.1%). The inventories-to-sales ratio remained stable at 1.28.
Combined business inventories were flat in August, following a small gain in July. Sales were up 0.2%, led by a gain in retail sales. Compared to a year ago, business inventories were up 1.1% Y/Y while sales were ahead by 4.4%. The inventories-to-sales ratio remained steady at 1.37.
ACC Survey of Economic Forecasters
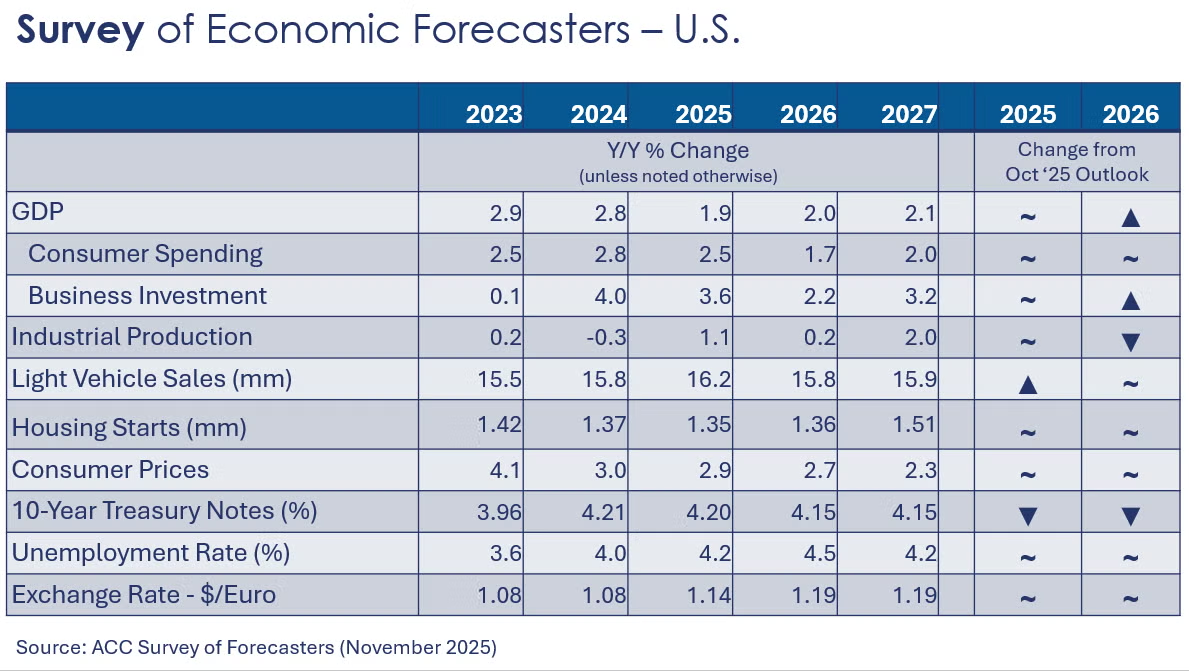
November’s Survey of Forecasters was largely unchanged from October, though there was some modest improvement in some indicators.
• U.S. GDP is expected to grow by 1.9% in 2025. In 2026, GDP is expected to rise 2.0%, higher than last month’s survey.
• Compared to a 2.8% gain in 2024, growth in consumer spending is expected to moderate to a 2.5% pace in 2025 (which was higher than last month’s survey) before easing further to a 1.7% gain in 2026 (same compared to last month’s survey).
• Business investment growth is expected to slow to 3.6% in 2025 before easing further to 2.2% in 2026, with next year’s expectations a little higher compared to the October survey.
• Following two years of weak growth, we look for industrial production grow by 1.1% in 2025 (the same as last month) and 0.2% in 2026 (lower than in the October survey).
• Despite ongoing struggles with affordability, vehicle sales are expected to rise to a 16.2 million pace in 2025 (highest since 2019) before retreating to a 15.8 million pace in 2026.
• Also struggling with affordability, housing starts fell to 1.37 million in 2024 and are expected to ease further to 1.35 million in 2025. Housing starts are expected to remain comparatively weak in 2026 at around 1.36 million, unchanged from last month’s survey.
• The unemployment rate is expected to increase slightly from 4.0% in 2024, averaging 4.2% in 2025 and rising to 4.5% in 2026, both expectations steady from last month’s survey.
• Growth in consumer prices is expected to ease slightly to 2.9% in 2025 (reflecting lower growth in services prices that are expected to offset higher prices for goods). In 2026, moderation continues with consumer prices expected to grow by 2.7%.
• Expectations for the 10-year Treasury eased for 2025 and 2026.


Chemical producer prices edged higher in September, up by 0.1%, reversing a similar decline in August. Prices were higher for organic chemicals (including petrochemicals), coatings, agricultural chemicals, synthetic rubber, and manufactured fibers. Prices were lower for inorganic chemicals, plastic resins, other specialty chemicals. Prices for consumer products were flat. Compared to a year ago, chemical producer prices were up 1.3% Y/Y, the ninth consecutive Y/Y increase.
Sales of chemicals at the wholesale level rose 1.4% in August, following a 1.6% gain in July. Chemical inventories fell 1.8%. As a result, the inventories-to-sales ratio fell to 1.07, the lowest level since April 2021.
Energy Wrap-Up
• Oil prices eased from a week ago as a peace deal in Ukraine continues to move forward.
• U.S. natural gas prices were steady during the week, but remain higher from a month ago as heating season kicks in.
• The combined oil & gas rig count rose by four to 546.
For More Information
ACC members can access additional data, economic analyses, presentations, outlooks, and weekly economic updates through ACCexchange: https://accexchange.sharepoint.com/Economics/SitePages/Home.aspx
In addition to this weekly report, ACC offers numerous other economic data that cover worldwide production, trade, shipments, inventories, price indices, energy, employment, investment, R&D, EH&S, financial performance measures, macroeconomic data, plus much more. To order, visit http://store.americanchemistry.com/.
Every effort has been made in the preparation of this weekly report to provide the best available information and analysis. However, neither the American Chemistry Council, nor any of its employees, agents or other assigns makes any warranty, expressed or implied, or assumes any liability or responsibility for any use, or the results of such use, of any information or data disclosed in this material.
Contact us at ACC_EconomicsDepartment@americanchemistry.com.


