Downward revisions to nonfarm payrolls between April 2024 and March 2025 show that job growth was far weaker than previously reported. The annual revisions showed 911,000 fewer jobs were created than previously estimated. It was the largest annual revision on record. With the monthly employment estimates, BLS seeks to produce timely information on changes in the labor market through a survey of firms and has incomplete data to work with at the time of publication. As more data becomes available, these monthly estimates are revised, sometimes significantly, as we saw in August. With the annual revision, BLS benchmarks its data to mandatory data collected by state unemployment insurance agencies.
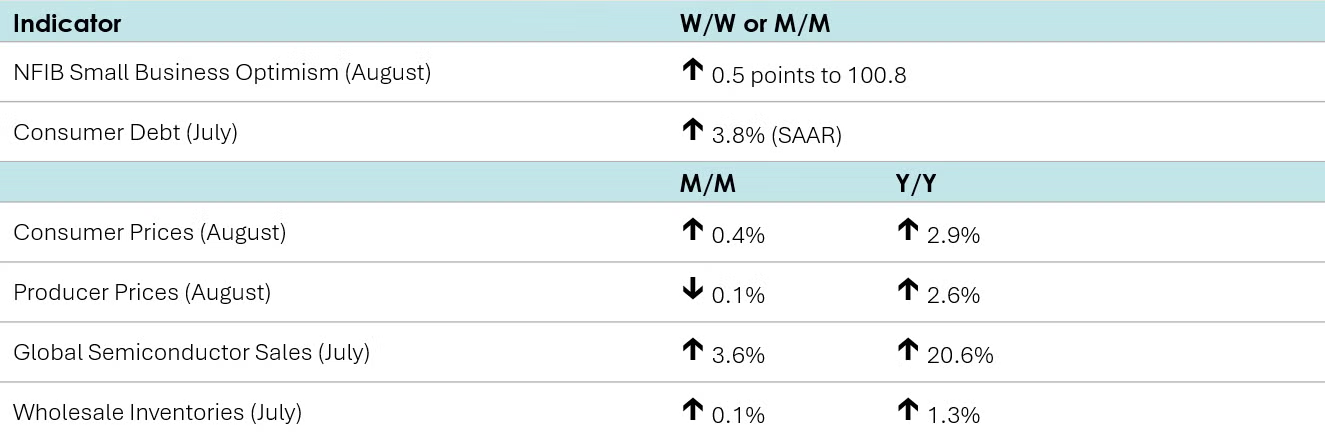
NFIB’s small business optimism index rose again in August, up 0.5 points to 100.8. The gain was driven by an increase in those expecting real sales to be higher. The Uncertainty Index fell by 4 points to 93 but remained well above the historical average.
Wholesale inventories ticked higher by 0.1% in July, following a 0.2% increase in June. The largest declines in inventories were in farm products, petroleum products, and automotive goods. Sales at the wholesale level jumped 1.4%, following a 0.7% gain the previous month. Compared to a year ago, inventories were up 1.3% Y/Y while sales were ahead by 6.2% Y/Y. The inventories-to-sales ratio ticked lower from 1.29 in June to 1.28 in July. That was lower than the 1.34 ratio a year ago.
Borrowing grew in July as consumer debt rose at a 3.8% annual rate, up from a revised gain of 2.3% in June. Credit card balances jumped 9.7% in July (the highest increase since December 2024) while balances on nonrevolving debt, such as student loans and car loans, leaped 1.8%.
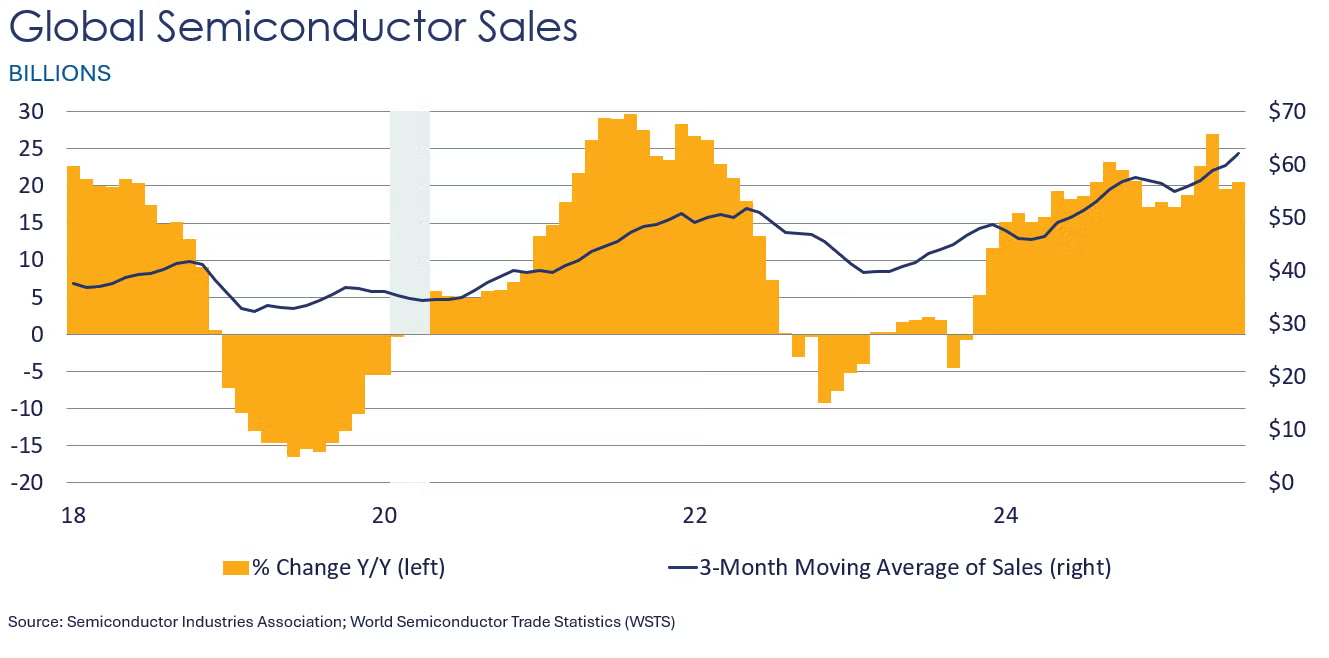
Global semiconductor sales rose 3.6% in July to $62.1 billion. The largest gain was in the Americas where sales were up 8.6%. Sales also rose in Asia Pacific (ex. China & Japan). Sales eased slightly in Japan and China and were flat in Europe. Compared to a year ago, sales were ahead 20.6% Y/Y.
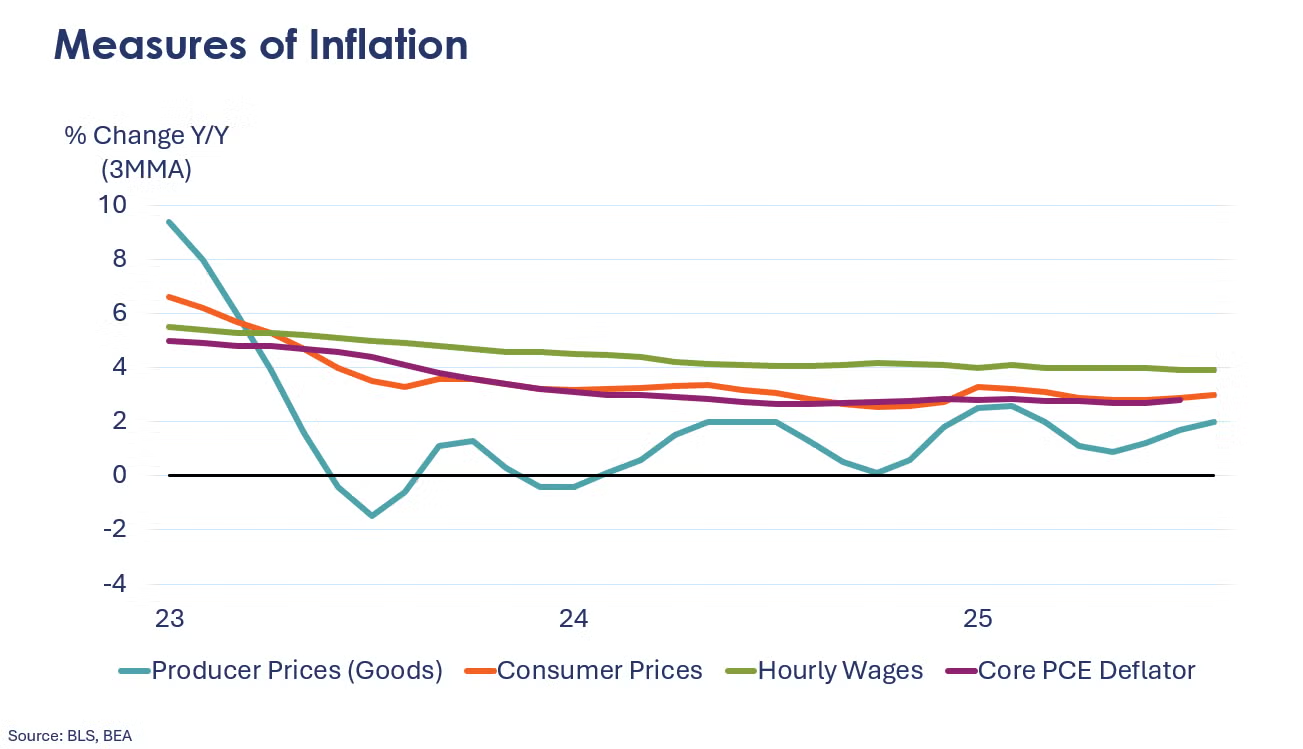
Consumer prices rose 0.4% in August, accelerating from a 0.2% increase in July. Shelter prices were the primary driver of the overall monthly rise. Food and energy also propelled the increase. Excluding food and energy, core prices leaped 0.3%, the same gain seen in July. Prices for airfare (up 5.9%), motor vehicle maintenance and repair (up 2.4%), new and used cars and trucks, and apparel all rose faster than in July. Compared to a year ago, headline consumer prices increased by 2.9% Y/Y, up from 2.7% in July. Core consumer prices advanced 3.1% Y/Y in August, repeating July’s Y/Y gain.
Producer prices slid 0.1% in August after rising 0.7% in July, the first decline since April. Prices for final demand goods inched up 0.1% while prices for final demand services fell 0.2%. Compared to a year ago, headline producer prices were up 2.6% Y/Y, decelerating from July’s 3.1% Y/Y gain. Prices for final demand goods rose 1.9% Y/Y, the same Y/Y increase seen in July. At the same time, prices for final demand services advanced 2.9% Y/Y in August, down from July’s 3.7% Y/Y gain.
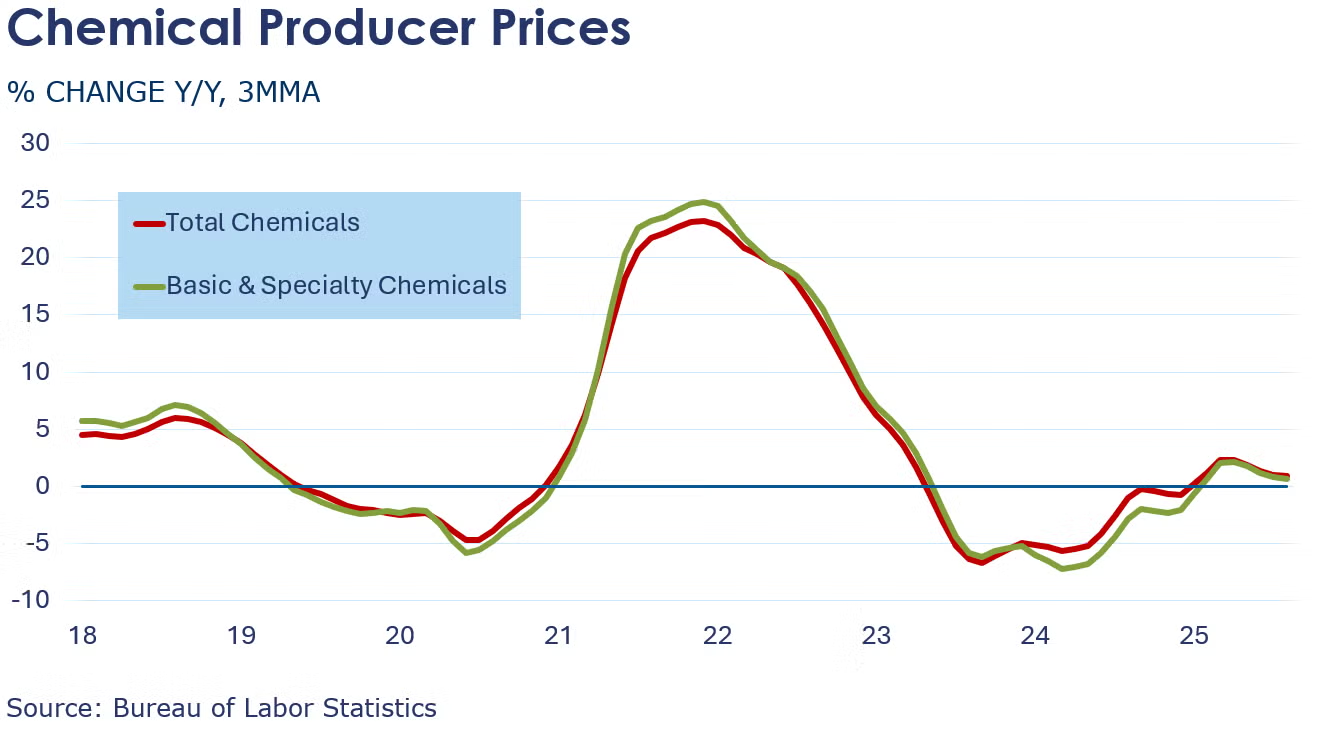
Chemical producer prices were flat in August after rising 0.6% in July. Gains in agricultural chemicals and plastic resins were more than offset by losses in manufactured fibers (down 4.9%), synthetic rubber, basic & specialty chemicals, and other specialties. Coatings, bulk petrochemicals and organics, inorganic chemicals, basic chemicals, and consumer products were all virtually unchanged. Compared to a year ago, chemical producer prices were up 0.8% Y/Y in August, the same reading seen in July.
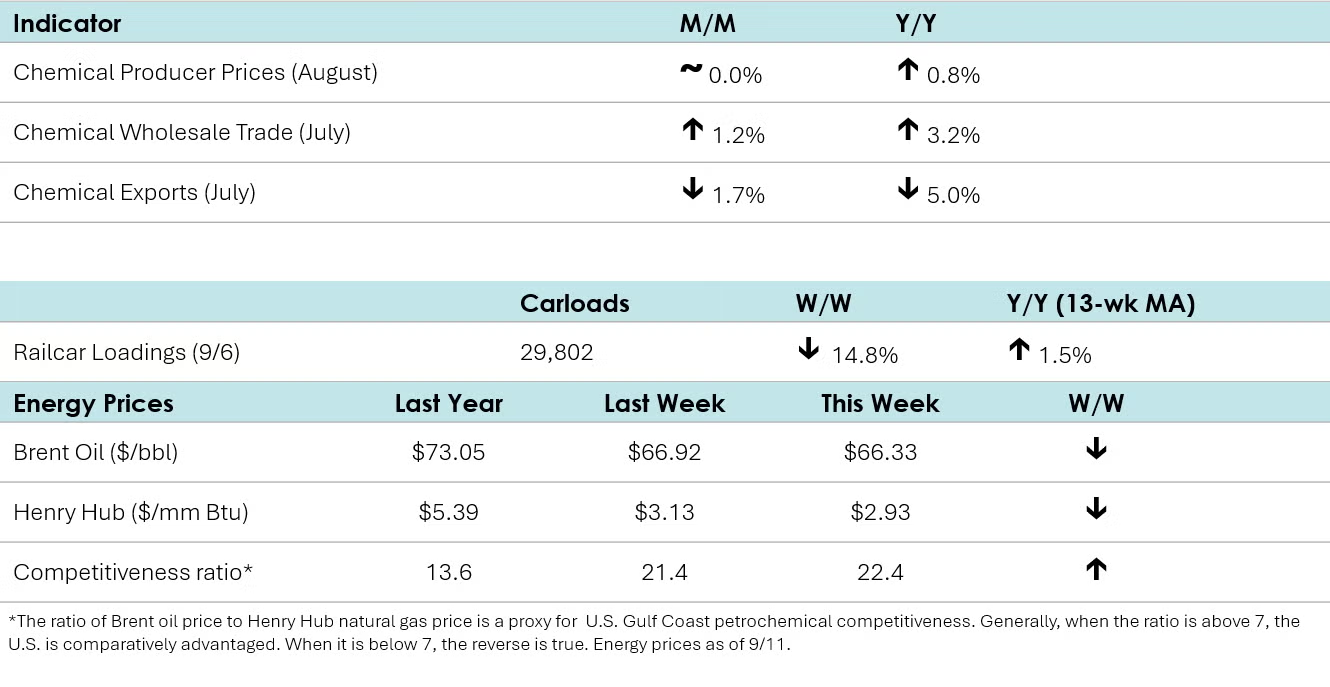
According to data released by the Association of American Railroads, chemical railcar loadings were down to 29,802 for the week ending September 6th, which included the Labor Day holiday. Loadings were up 1.1% Y/Y (13-week MA), up 1.5% YTD/YTD and have been on the rise for seven of the last 13 weeks.
Chemical exports continued to slide in July, down by 1.7% as trade-related uncertainties weighed on export demand. Declines in specialties and basic chemicals exports offset gains in agricultural and consumer chemicals. Imports rose by 5.6% (after falling in June), driven by gains in agricultural (16.3%), consumer (12.7%), and specialty chemicals (12.6%). Compared to a year ago, both exports and imports decreased by 5.0% and 8.7%, respectively. The chemical trade surplus shrank from $3.2 billion in June to $2.4 billion in July.
U.S. plastic resin exports remained resilient with 2.1 million metric tons registered in July. Compared to the same time last year, resin exports increased by 2.7%.
U.S. production of major plastic resins totaled 9.2 billion pounds in July, an all-time high and an increase of 6.5% compared to the prior month. Production was up 10.3% compared to the same month in 2024, according to ACC. Year-to-date production was 58.7 billion pounds, flat compared to the same period in 2024.
Sales and captive (internal) use of major plastic resins totaled 8.8 billion pounds during July, flat compared to the prior month, and a 3.9% increase from the July 2024. Year-to-date sales and captive use were 58.8 billion pounds, a 0.2% decline compared to the same period in 2024.
Following a decline in June, sales of chemicals at the wholesale level rose 1.2% in July and were up 3.2% from a year ago. Wholesale chemical inventories eased by 0.1% and were lower than last year’s levels by 0.2%. With a gain in sales and a decline in inventories, the inventories-to-sales ratio moved lower to 1.11. That was lower than the 1.15 ratio last July.
Energy Wrap-Up
• Oil prices were slightly lower than a week as an announced production increase by OPEC+ offset supply concerns following by Israel’s attack in Qatar and attacks by Russian drones in Poland.
• U.S. natural gas prices eased compared to a week ago following another solid inventory gain.
• The combined oil & gas rig count rose by one to 532.
For More Information
ACC members can access additional data, economic analyses, presentations, outlooks, and weekly economic updates through ACCexchange: https://accexchange.sharepoint.com/Economics/SitePages/Home.aspx
In addition to this weekly report, ACC offers numerous other economic data that cover worldwide production, trade, shipments, inventories, price indices, energy, employment, investment, R&D, EH&S, financial performance measures, macroeconomic data, plus much more. To order, visit http://store.americanchemistry.com/.
Every effort has been made in the preparation of this weekly report to provide the best available information and analysis. However, neither the American Chemistry Council, nor any of its employees, agents or other assigns makes any warranty, expressed or implied, or assumes any liability or responsibility for any use, or the results of such use, of any information or data disclosed in this material.
Contact us at ACC_EconomicsDepartment@americanchemistry.com.