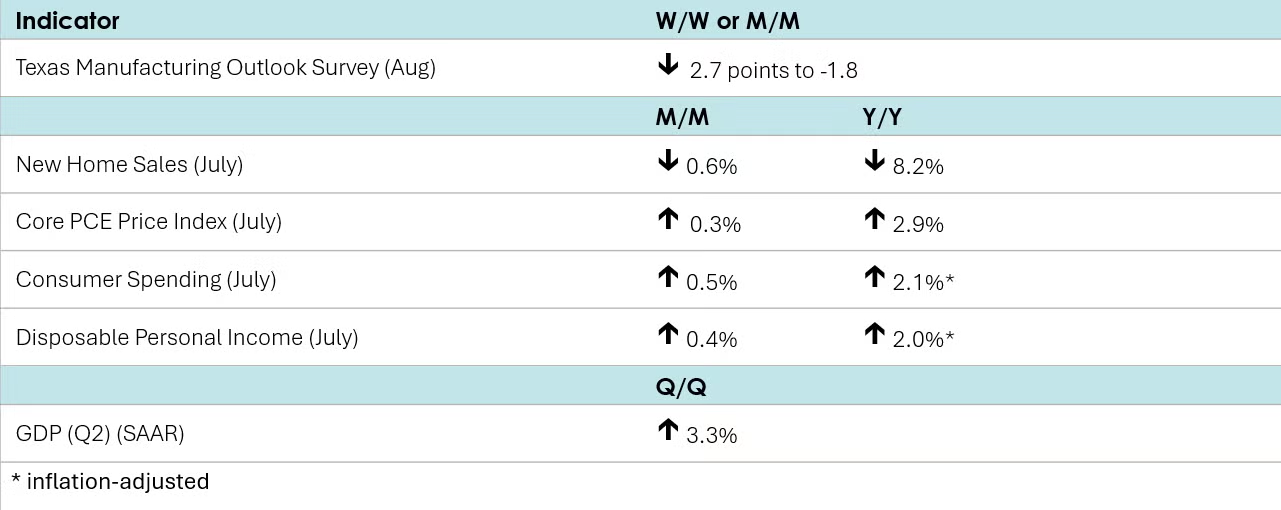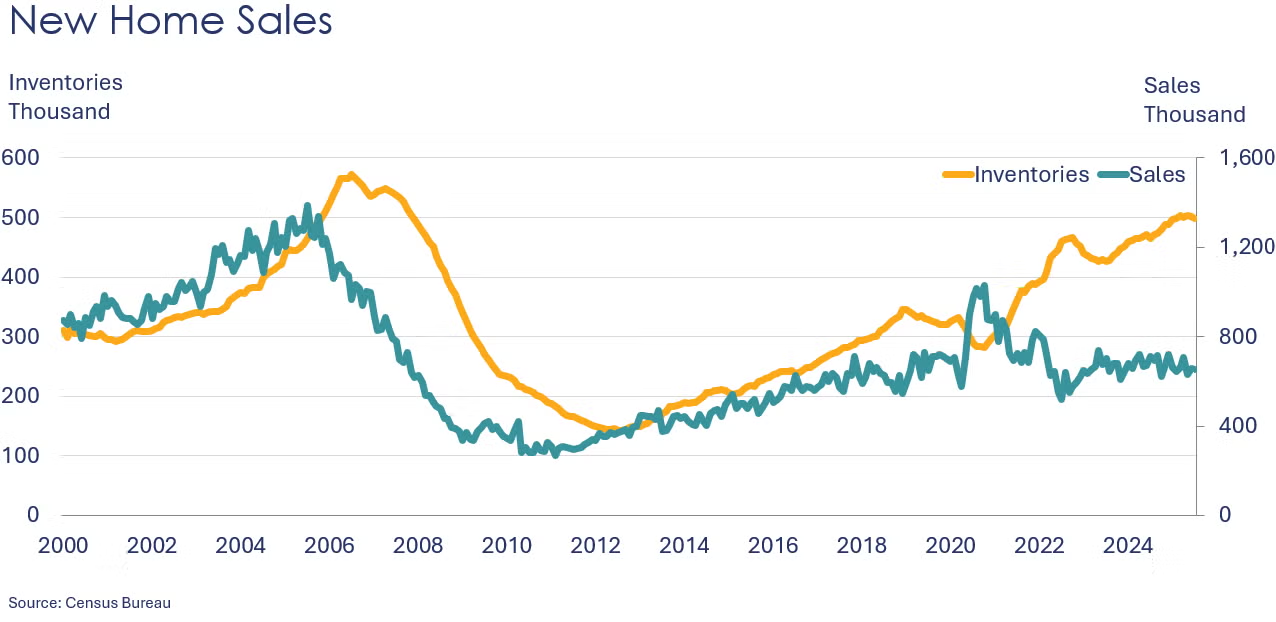

Following a 4.1% increase in June, new home sales dipped 0.6% in July. With 33,000 pounds of chemistry in a typical single-family home, new residential construction is an important end-use market for chemicals. The inventory of unsold homes dropped and represented a 9.2-month supply at the current sales pace. Compared to a year ago, inventories were up 7.3% Y/Y while sales were down 8.2% Y/Y. The median sales price was down 5.9% Y/Y.
Consumer spending rose by 0.5% in July,led by higher sales of motor vehicles and financial services & insurance. Disposable personal income also rose, up by 0.4%, driven by higher employee compensation. The savings rate remained steady at 4.4%. Compared to a year ago, consumer spending was up 2.1% Y/Y while income was 2.0% Y/Y higher.

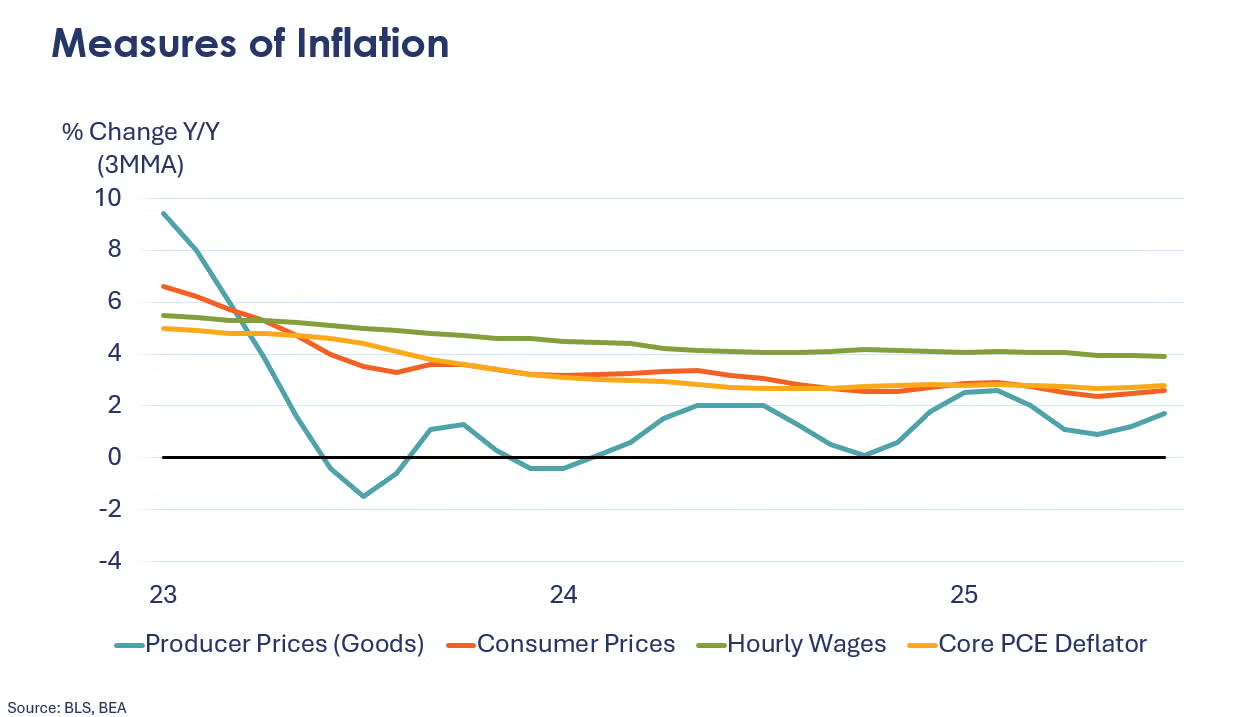
The headline personal consumption expenditures (PCE) price index rose 2.6% Y/Y, the same pace as in June. Excluding food and energy, the core PCE price index rose 2.9% Y/Y, the fastest pace since February.
U.S. GDP advanced at a 3.3% seasonally adjusted annual rate during Q2, according the second of three estimates from the Bureau of Economic Analysis. The first estimate released last month showed GDP growing at a 3.0% clip. The increase primarily reflected a large decrease in imports (which raises GDP) and an increase in consumer spending. Real final sales to private domestic purchasers (i.e., consumer spending plus gross private fixed investment), leaped 1.9 percent, 0.7 percentage point higher than the initial estimate of 1.2 percent.
The Dallas Fed’s Texas Manufacturing Outlook Survey showed that manufacturing conditions contracted slightly in August, following a modest expansion in July. The general business activity index fell 2.7 points to -1.8. Production expanded at a slower pace and new orders expanded (following contraction in July). Unfilled orders continued to contract and finished goods inventories expanded slightly. Outlook uncertainty was also higher. Looking ahead six months, optimism expanded for Texas manufacturers across a number of indicators.

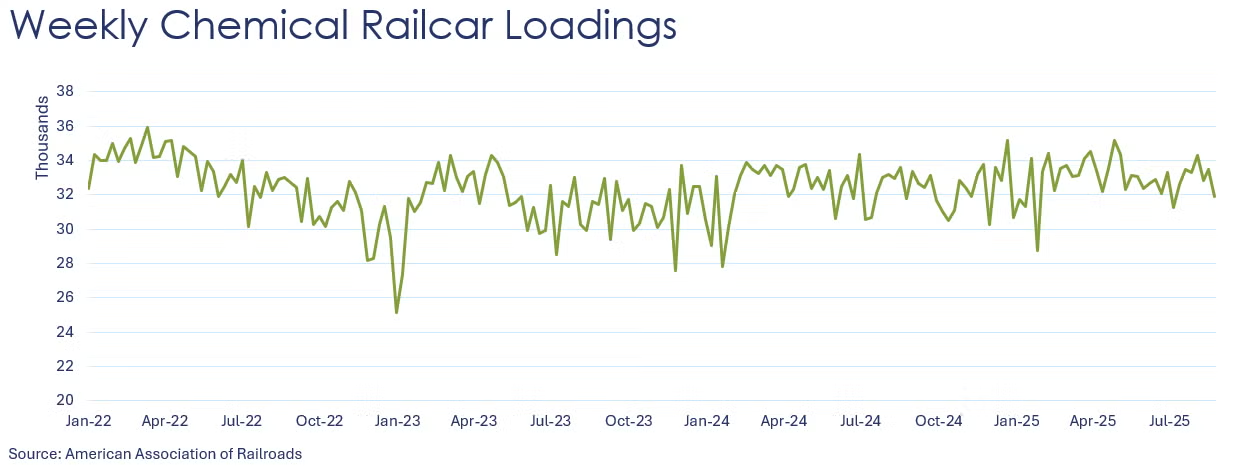
According to data released by the Association of American Railroads, chemical railcar loadings were down to 31,929 for the week ending August 23rd. Loadings were up 1.4% Y/Y (13-week MA), up 1.7% YTD/YTD and have been on the rise for seven of the last 13 weeks.

One respondent to the Dallas Fed’s Texas Manufacturing Outlook Survey noted, “General construction, automotive and durable goods are at the lowest inventory and demand we have seen since 2008/2009 and in fact are worse. Interest rates are drastically impacting consumers in these basic materials industries and are killing U.S. manufacturing outside of the tech sector.”
Energy Wrap-Up
• Oil prices remained elevated (though slightly lower than last Friday) on supply concerns as peace talks with Ukraine stalled.
• U.S. natural gas prices also moved higher the front month rolled to October and expectations for cooler weather.
• The combined oil & gas rig count fell by one to 533 during the week ending August 22nd.
For More Information
ACC members can access additional data, economic analyses, presentations, outlooks, and weekly economic updates through ACCexchange: https://accexchange.sharepoint.com/Economics/SitePages/Home.aspx
In addition to this weekly report, ACC offers numerous other economic data that cover worldwide production, trade, shipments, inventories, price indices, energy, employment, investment, R&D, EH&S, financial performance measures, macroeconomic data, plus much more. To order, visit http://store.americanchemistry.com/.
Every effort has been made in the preparation of this weekly report to provide the best available information and analysis. However, neither the American Chemistry Council, nor any of its employees, agents or other assigns makes any warranty, expressed or implied, or assumes any liability or responsibility for any use, or the results of such use, of any information or data disclosed in this material.
Contact us at ACC_EconomicsDepartment@americanchemistry.com.

