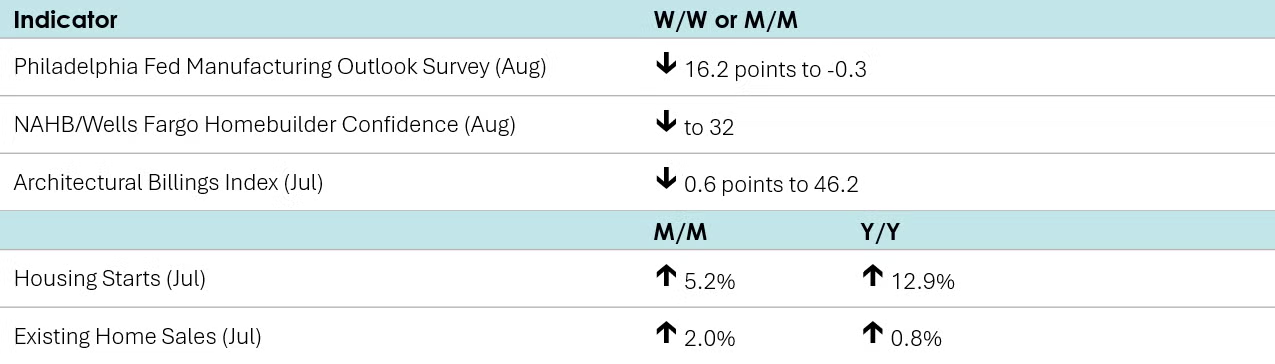
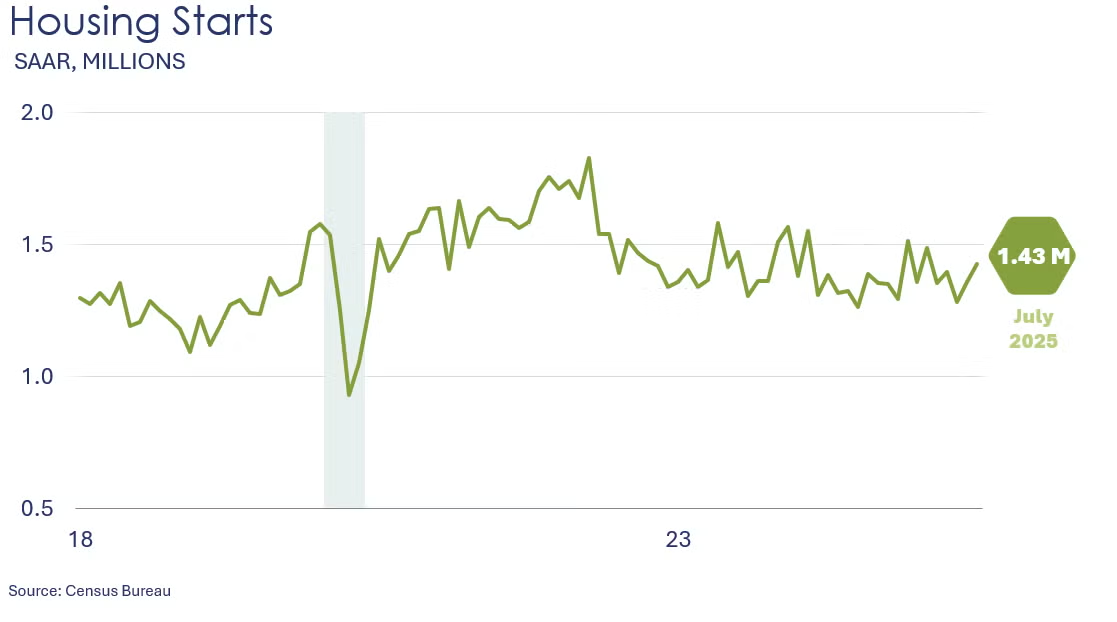
Headline housing starts increased 5.2% in July to a 1.43 million annual pace, the highest level since February of this year. And while chemistry-intensive single-family starts gained 2.8% in July, all the country’s regions witnessed declines except for the South. Multifamily starts advanced 11.6%. On the flip side, forward-looking building permits lost 2.8% in July, the fourth consecutive monthly decline. Compared to a year ago, housing starts were up 12.9% Y/Y while building permits were off by 5.7% Y/Y.
Homebuilder confidence eased in August, down one point to 32. Builder sentiment has been in contraction territory for 16 consecutive months according to the NAHB/Wells Fargo Housing Market Index.
Existing home sales rose 2.0% in July to a 4.0 million seasonally adjusted annual rate (SAAR) while inventories increased 0.6%. Sales and inventories grew 0.8% Y/Y and 15.7% Y/Y, respectively. At the current sales pace, inventories represented 4.6 months’ supply, higher than the 4.0-month mark a year ago. The median sales price inched up 0.2% Y/Y to $422,400.
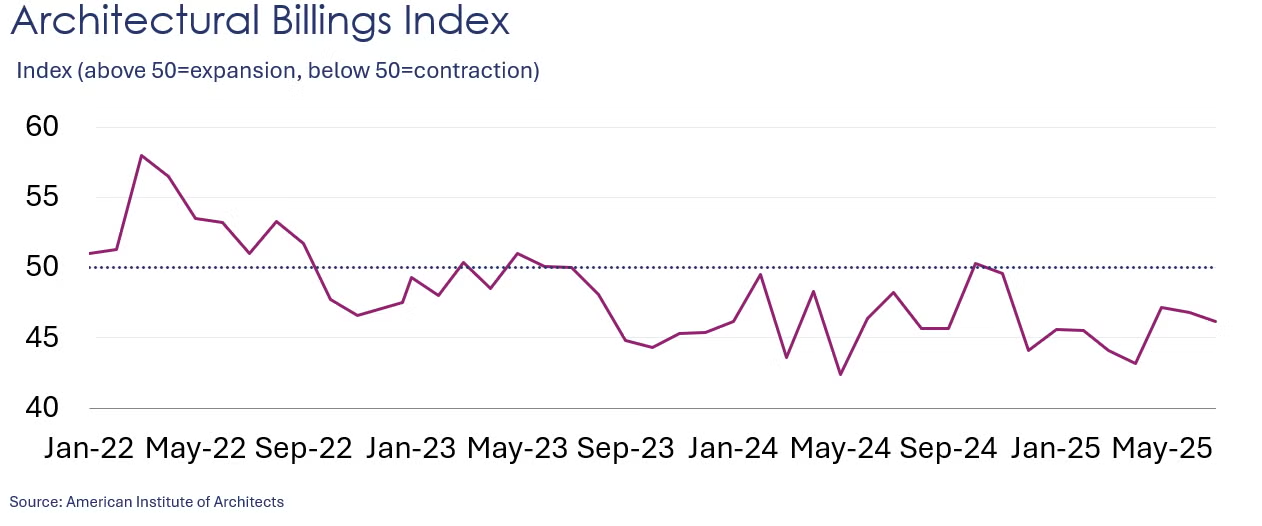
A leading indicator of nonresidential construction, the Architectural Billings Index (ABI) eased by 0.6 points in July to 46.2. An index reading below zero indicates that a majority of firms are still seeing declining billings. Looking ahead, inquiries into new work grew slowly, though the value of newly signed design contracts at firms declined again during the month. The report suggests ongoing weakness in the nonresidential construction business.
Survey of Economic Forecasters
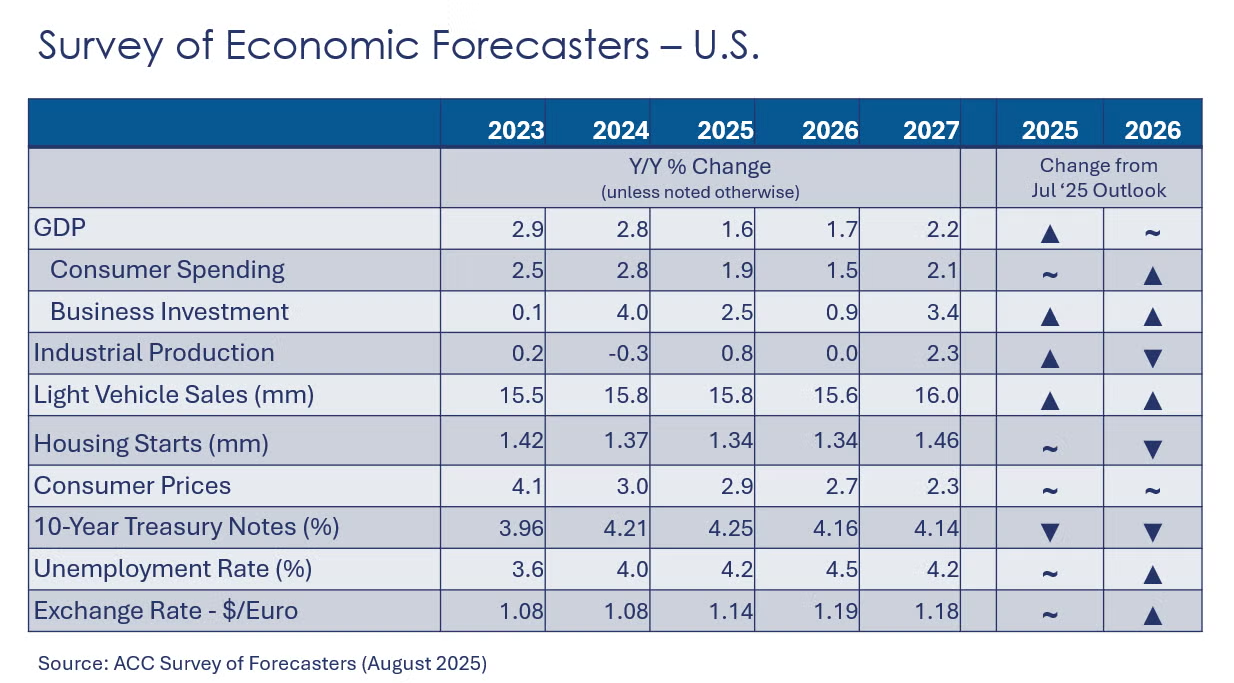
Recent revisions to job growth suggest the labor market was not as strong as previously thought. Many of our forecast indicators for 2025 improved in August while some indicators suggest further weakness into 2026.
• U.S. GDP is expected to grow by 1.6% in 2025 (slightly higher than last month) and by 1.7% in 2026.
• Growth in consumer spending is expected to moderate to a 1.9% pace in 2025 before easing further to a 1.5% gain in 2026.
• Business investment growth is expected to slow to 2.5% in 2025 before easing further to 0.9% in 2026.
• Following a 0.3% decline in 2024, we look for industrial production to grow only 0.8% in 2025 (led by a strong Q1), but to flatten in 2026. Certain industries will be more impacted by tariffs than others.
• Sales of autos and light trucks rose to 15.8 million in 2024 (still below trend). Adding to affordability concerns, tariffs are expected to raise the cost of vehicles further. In 2025, vehicle sales are expected to be flat at a 15.8 million pace (despite higher sales in March and April), before slipping further to a 15.6 million pace in 2026, as affordability constraints persist.
• Also struggling with affordability, housing starts fell to 1.37 million in 2024 and are expected to be ease further to 1.34 million in 2025. Housing starts are expected to remain comparatively weak in 2026 at around 1.34 million.
• The unemployment rate is expected increase slightly from 4.0% in 2024, averaging 4.2% in 2025 and rising to 4.5% in 2026.
• Growth in consumer prices is expected to ease slightly to 2.9% in 2025 (reflecting lower growth in services prices that are expected to offset higher prices for goods). In 2026, inflation continues to moderate with consumer prices growing 2.7%.
• Expectations for the 10-year Treasury were lower for 2025 and 2026.
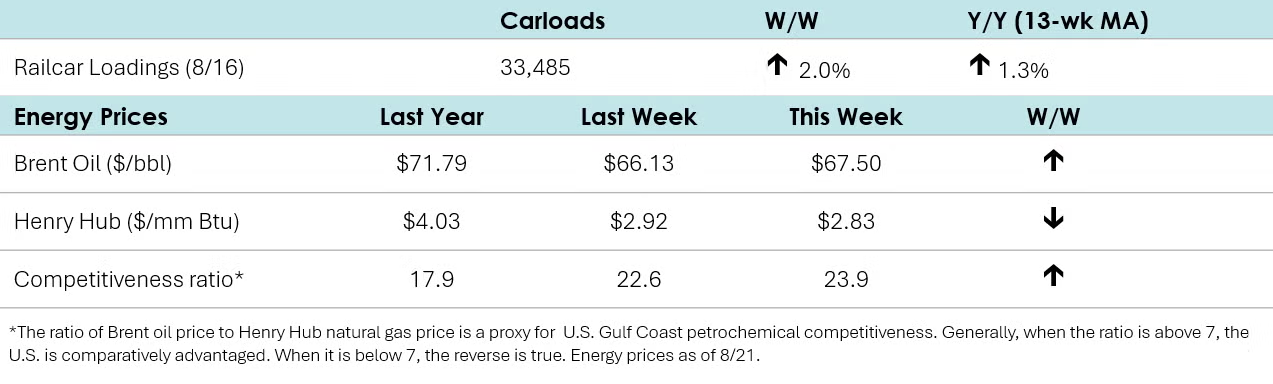
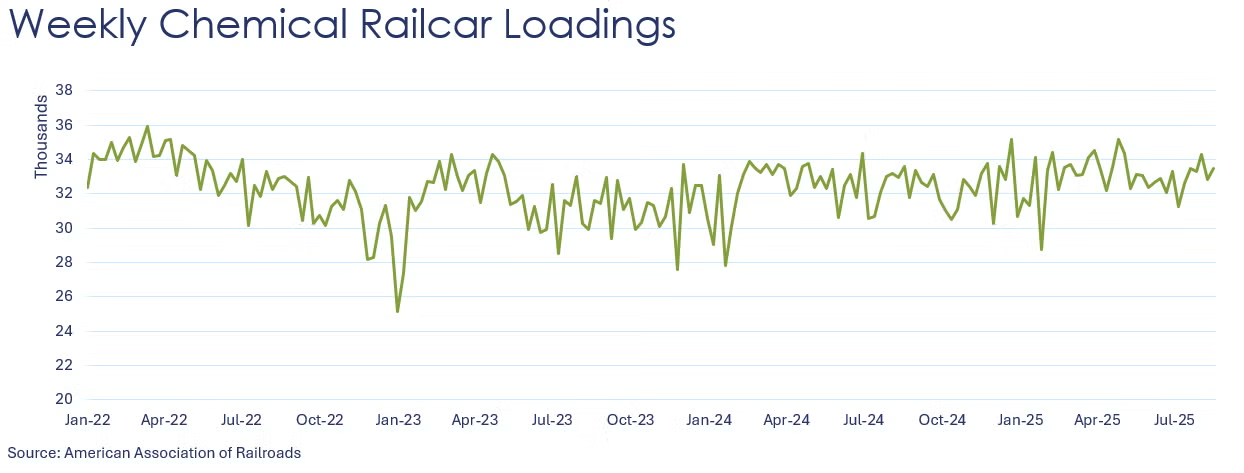
According to data released by the Association of American Railroads, chemical railcar loadings were up to 33,485 for the week ending August 16th. Loadings were up 1.3% Y/Y (13-week MA), up 1.7% YTD/YTD and have been on the rise for seven of the last 13 weeks.
Energy Wrap-Up
• Oil prices were slightly higher than a week ago as a drop in U.S. crude inventories signaled stronger demand.
• U.S. natural gas prices eased coming into the back half of August and cooler temperatures across much of the U.S.
• The combined oil & gas rig count remained stable for a third week at 534.
For More Information
ACC members can access additional data, economic analyses, presentations, outlooks, and weekly economic updates through ACCexchange: https://accexchange.sharepoint.com/Economics/SitePages/Home.aspx
In addition to this weekly report, ACC offers numerous other economic data that cover worldwide production, trade, shipments, inventories, price indices, energy, employment, investment, R&D, EH&S, financial performance measures, macroeconomic data, plus much more. To order, visit http://store.americanchemistry.com/.
Every effort has been made in the preparation of this weekly report to provide the best available information and analysis. However, neither the American Chemistry Council, nor any of its employees, agents or other assigns makes any warranty, expressed or implied, or assumes any liability or responsibility for any use, or the results of such use, of any information or data disclosed in this material.
Contact us at ACC_EconomicsDepartment@americanchemistry.com.


