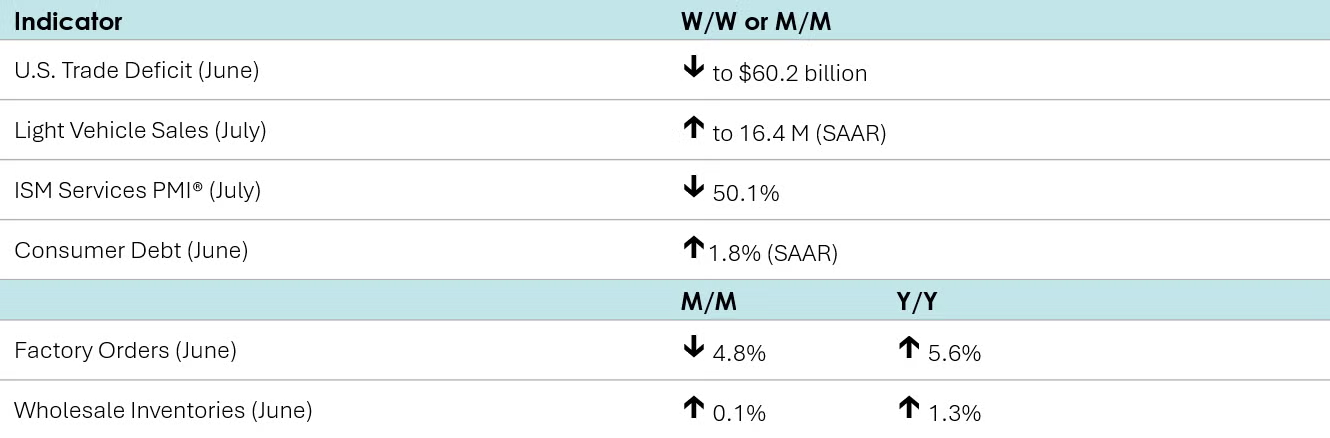
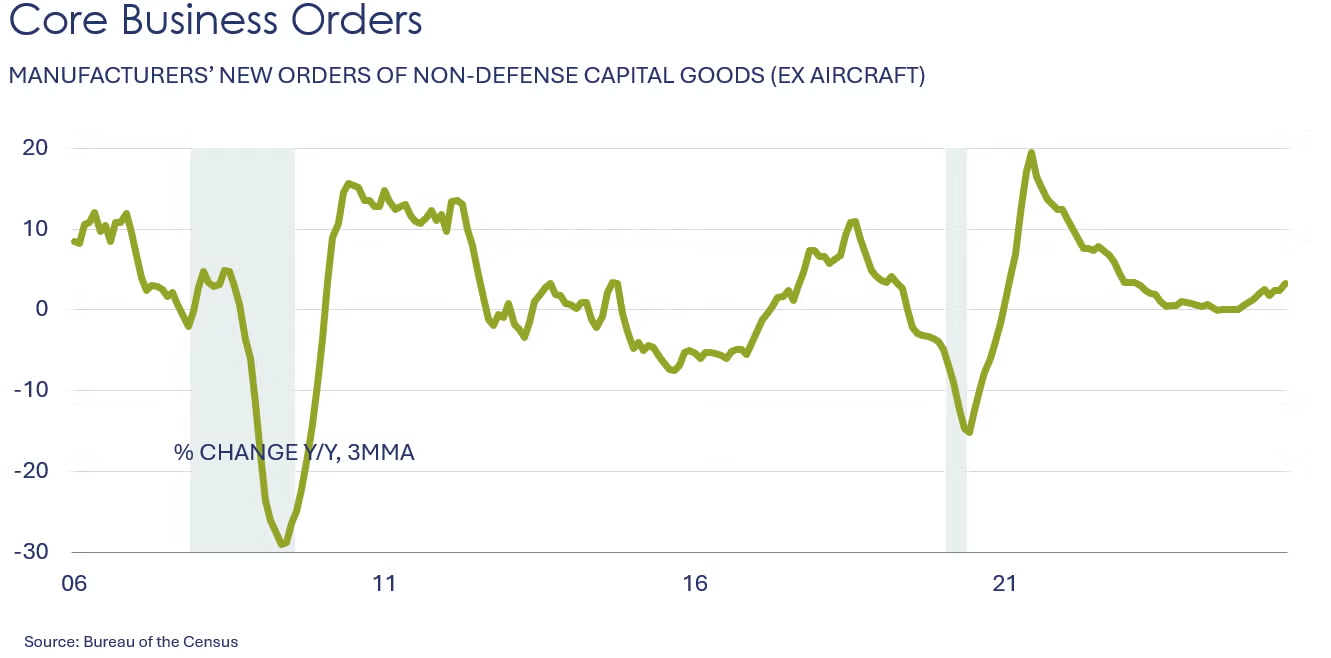
After rising 8.3% in May, factory orders fell 4.8% in June, driven down by a plunge in nondefense aircraft which tumbled 51.8%. Orders for IT equipment increased slightly despite a drop in computer orders. Consumer goods and electrical equipment were essentially flat, motor vehicles dipped, and construction materials inched up. Orders for core business goods (nondefense capital goods, excluding aircraft) dropped 0.8% (following a 1.9% increase in May). Unfilled orders (a measure of the manufacturing pipeline) grew by 1.0% following a 3.4% rise in May. Manufacturing shipments edged higher by 0.5% in June while manufacturing inventories inched up 0.2%. The inventories-to-shipments ratio remained unchanged from May at 1.57.
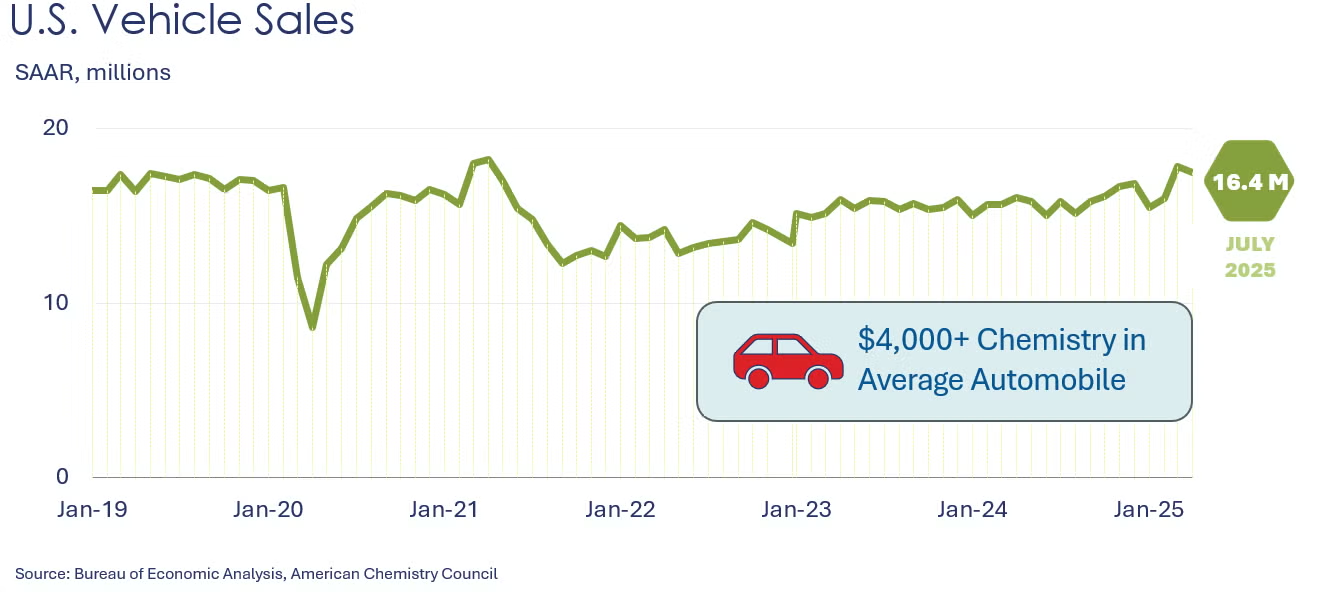
Light vehicles sales rose to a 16.4 million seasonally adjusted annual rate (SAAR), up from a 15.3 million SAAR in June. Dealer incentives were up in July. In addition, buyers may have been motivated by EV tax credits that are set to expire in September.
The nation’s trade deficit fell to $60.2 billion in June, as imports fell faster than exports. It was the smallest trade deficit since September 2023. Exports fell 0.5% to $277.3 billion as declines in industrial supplies & materials were only partially offset by higher exports of capital goods and consumer goods. Imports fell 3.7% to $337.5 billion with declines across all major end-use categories. The trade deficit with China continued to slide to its lowest level since 2004 as higher tariffs took effect in June.
Wholesale inventories edged slightly higher in June following a decline in May. The largest gains were in electrical equipment and petroleum products. Wholesale sales also moved higher, by 0.3%, with the largest gains in hardware, and miscellaneous durables. Compared to a year ago, sales were up 5.5% Y/Y while inventories were up 1.3%. The inventories-to-sales ratio remained stable at 1.30.
The ISM Services PMI® remained in expansion territory in July for the second straight month and the 12th time in the last 13 months. However, it declined 0.7 points to 50.1% (a reading below 50 corresponds to a contraction). Business activity, new orders, and inventories expanded (albeit at a slower pace). Prices continued to increase and accelerated. Employment and order backlogs contracted, as did exports and imports after having expanded in June. On the flip side, supplier deliveries slowed faster than in June, indicating an improvement in customer demand. Eleven industries reported growth in July, up one from June. Within the comments, respondents again noted higher prices from tariffs and associated project delays and cancellations.
Borrowing grew in June as consumer debt rose at a 1.8% annual rate, up from 1.2% in May. A decline in credit card balances was more than offset by an increase in balances on nonrevolving debt, such as student loans and car loans.
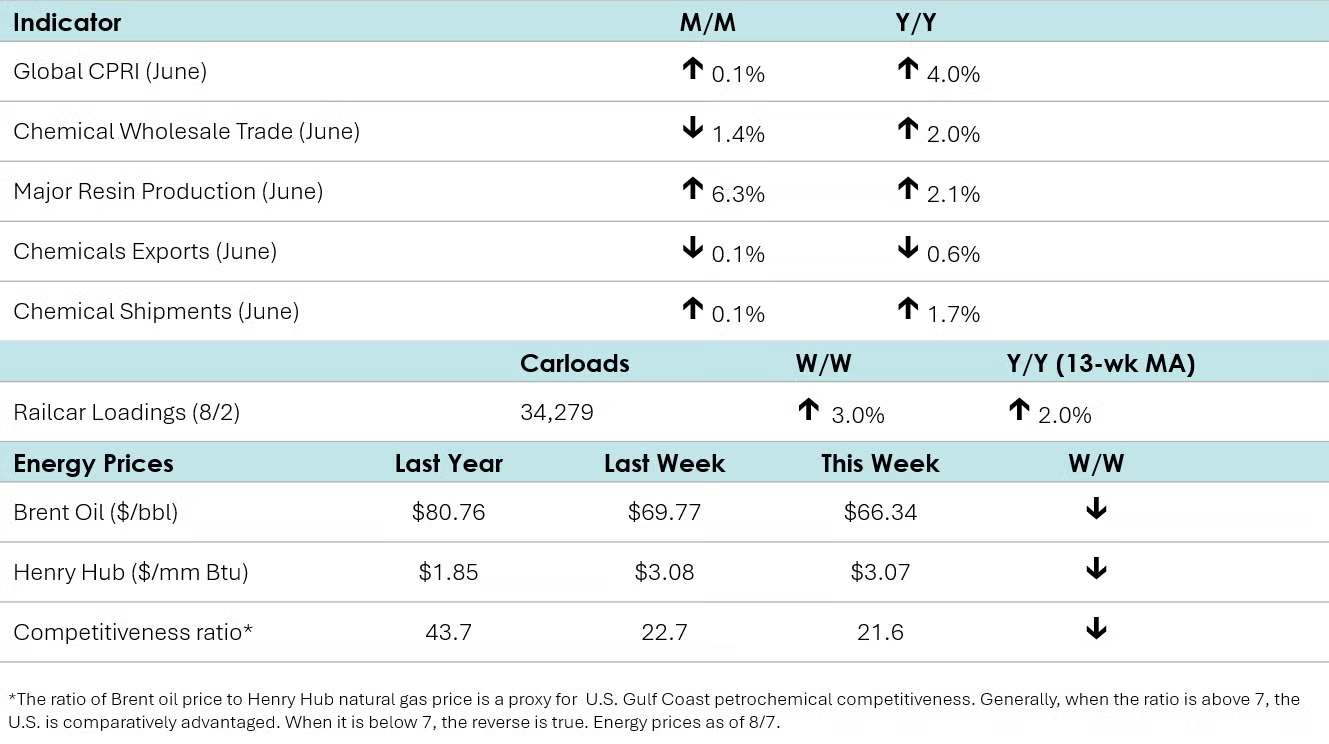
According to data released by the Association of American Railroads, chemical railcar loadings were up to 34,279 for the week ending August 2nd. Loadings were up 2.0% Y/Y (13-week MA), up 1.9% YTD/YTD and have been on the rise for seven of the last 13 weeks.
Chemical shipments remained essentially unchanged in June at $57.3 billion, experiencing a 0.1% uptick. Increases in agricultural chemicals and coatings & adhesives were offset by declines in other chemicals. Chemical inventories were virtually flat, up by just 0.1%, as higher inventories of agricultural chemicals were more than offset by a decline in coatings and adhesives. Compared to a year ago, shipments were up 1.7% Y/Y while inventories were up 0.8%. In June, the inventories-to-shipments ratio for chemicals remained unchanged at 1.25.
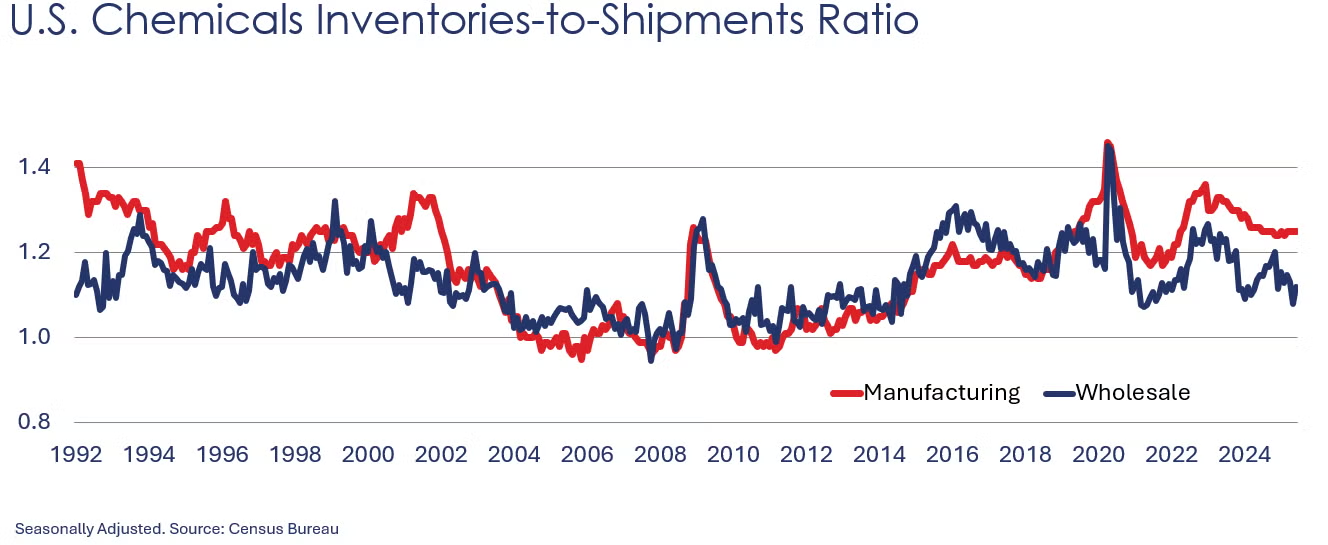
Wholesale sales of chemicals fell by 1.4% in June following a 2.6% gain in May. Wholesale chemical inventories rose 1.9% (after a 2.0% decline in May). Compared to last June, sales were up 2.0% Y/Y while inventories were 1.0% lower Y/Y. The inventories-to-sales ratio rebounded from 1.08 in May to 1.12 in June. A year ago, the ratio was 1.15.
U.S. production of major plastic resins totaled 8.6 billion pounds in June, an increase of 6.3% compared to the prior month, and was up 2.1% compared to the same month in 2024, according to ACC. Year-to-date production was 49.5 billion pounds, a 1.7% decline as compared to the same period in 2024.
Sales and captive (internal) use of major plastic resins totaled 8.8 billion pounds during June, an increase of 1.7% compared to the prior month, and a 2.1% increase from the same month one year earlier. Year-to-date sales and captive use were 50.1 billion pounds, a 0.8% decline compared to the same period in 2024.
ACC’s Global Chemical Production Regional Index (Global CPRI) picked up 0.1% in June after a stagnant May (0.0%). Production increased in Asia, South America, and the Middle East but declined elsewhere. Production in the Asia-Pacific region advanced as China’s goods export reached a new post-2022 high. European output remained weak as trade-related uncertainties continued to weigh down European production. Output in North America decreased as U.S. production continued to decline. South American production stabilized. All segments saw improvement, and year-over-year production rose by 4.0%.
For more details, check out our new CPRI Dashboard.
The U.S. CPRI edged down by 0.2% in June. This index measures chemical production trends based on a three-month moving average to smooth out month-to-month volatility. Production declined in most regions, except the Gulf Coast, where production increased. Overall, the U.S. CPRI was 1.6% higher than it was a year ago.
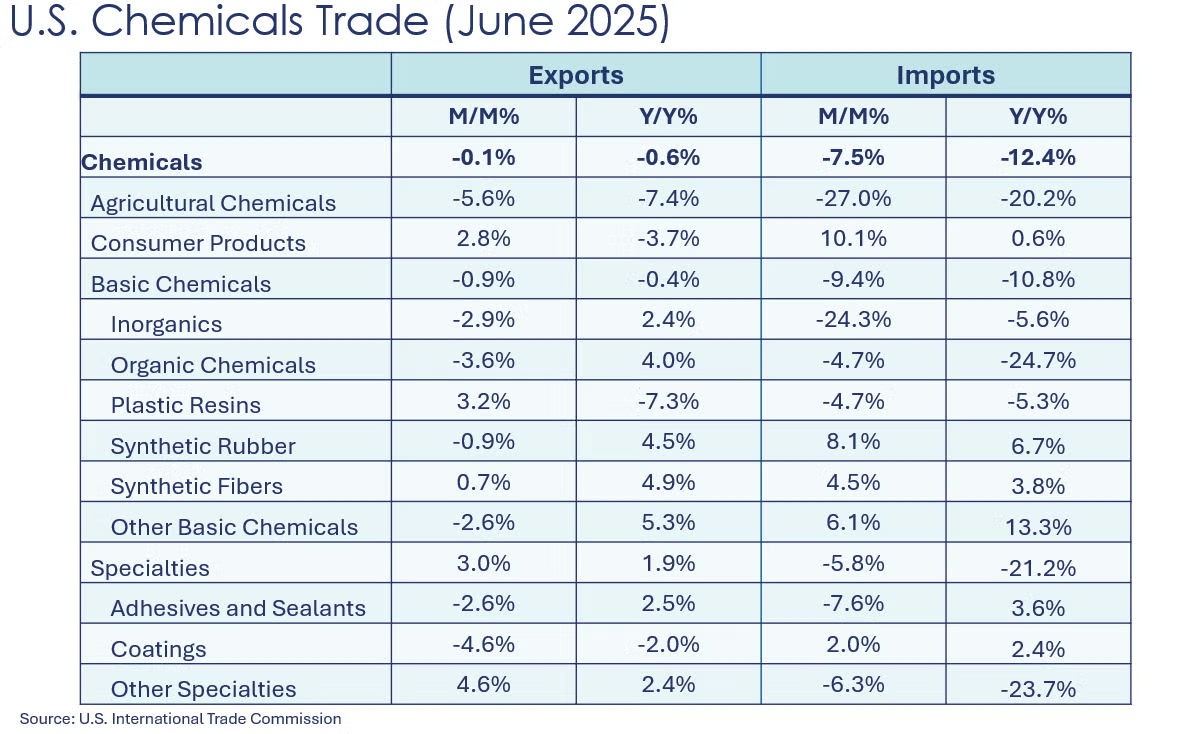
Chemical exports decreased by 0.1% in June as trade-related uncertainties continued to weigh on export demand. Performance varied by segment, but the most significant drop was seen in agricultural chemicals (-5.6%) and bulk petrochemicals and intermediates (-3.6%). Imports declined by 7.5%, primarily driven by agricultural chemicals (-27.0%) and inorganics (-24.3%). Compared to a year ago, both exports and imports decreased by 0.6% and 12.4%, respectively. The chemical trade surplus increased from $2.4 billion in May to $3.2 billion in June.
After a sharp drop in May, U.S. plastic resin exports bounced back in June by 4.7% to 2.1 million metric tons. Compared to a year ago, resin exports were up 2.6%.
Energy Wrap-Up
• Oil prices slid to an eight-week low as new talks between US and Russia bring more uncertainty.
• U.S. natural gas prices remained essentially steady as milder weather persisted across much of the U.S.
• The combined oil & gas rig count fell by three to 534.
For More Information
ACC members can access additional data, economic analyses, presentations, outlooks, and weekly economic updates through ACCexchange: https://accexchange.sharepoint.com/Economics/SitePages/Home.aspx
In addition to this weekly report, ACC offers numerous other economic data that cover worldwide production, trade, shipments, inventories, price indices, energy, employment, investment, R&D, EH&S, financial performance measures, macroeconomic data, plus much more. To order, visit http://store.americanchemistry.com/.
Every effort has been made in the preparation of this weekly report to provide the best available information and analysis. However, neither the American Chemistry Council, nor any of its employees, agents or other assigns makes any warranty, expressed or implied, or assumes any liability or responsibility for any use, or the results of such use, of any information or data disclosed in this material.
Contact us at ACC_EconomicsDepartment@americanchemistry.com.

