MACROECONOMY & END-USE MARKETS
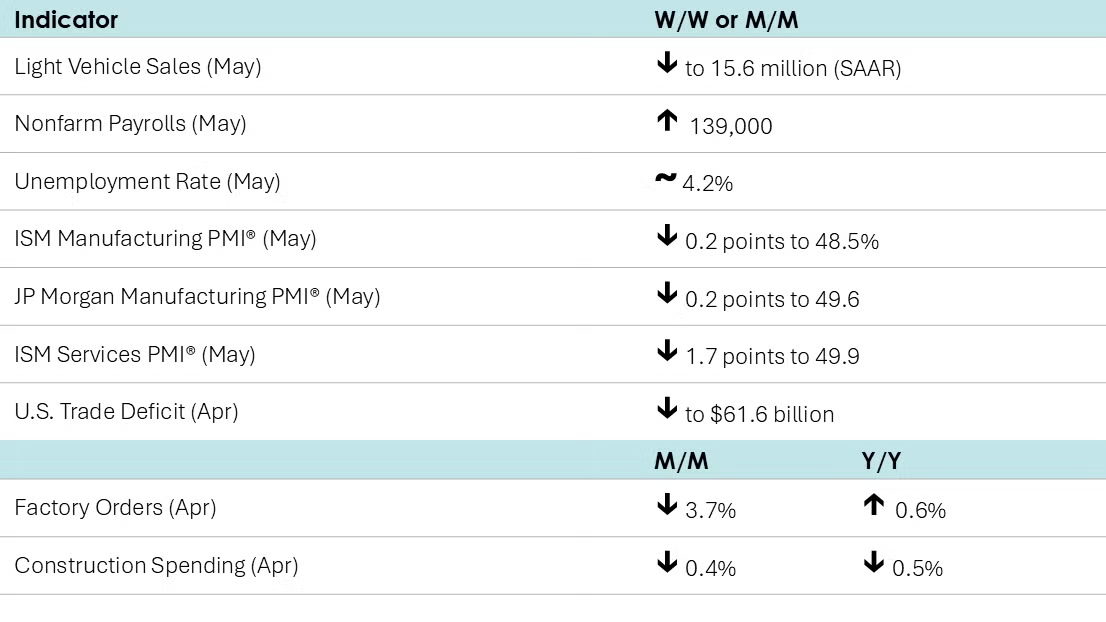
Nonfarm payrolls rose by a better-than-expected 139,000 in May, despite a combined 95,000 downward revision to March and April’s job gains. A gain in services employment offset a decline in goods-producing sector jobs, including manufacturing which lost 8,000 jobs. Average hourly earnings rose at a 3.9% annual pace for a fifth consecutive month. The data should provide some reassurance to the Fed, which meets the week after next.
The unemployment rate, which is based on a separate survey of households, remained stable at 4.2% for a third consecutive month, despite a decline in the number of people that reported being employed. The number of employed people fell by 696,000, the largest monthly decline since December 2023. But because the number of people in the civilian labor force also fell by roughly the same amount, the number of unemployed people only rose slightly. Contradictory signals about employment from the two sources (the establishment survey and the household survey) are not uncommon, especially around turning points.
Following declines in February and March, job openings rose in April to nearly 7.4 million. The number of people laid off or discharged rose to the highest level since last September, while the number that voluntarily quit fell.
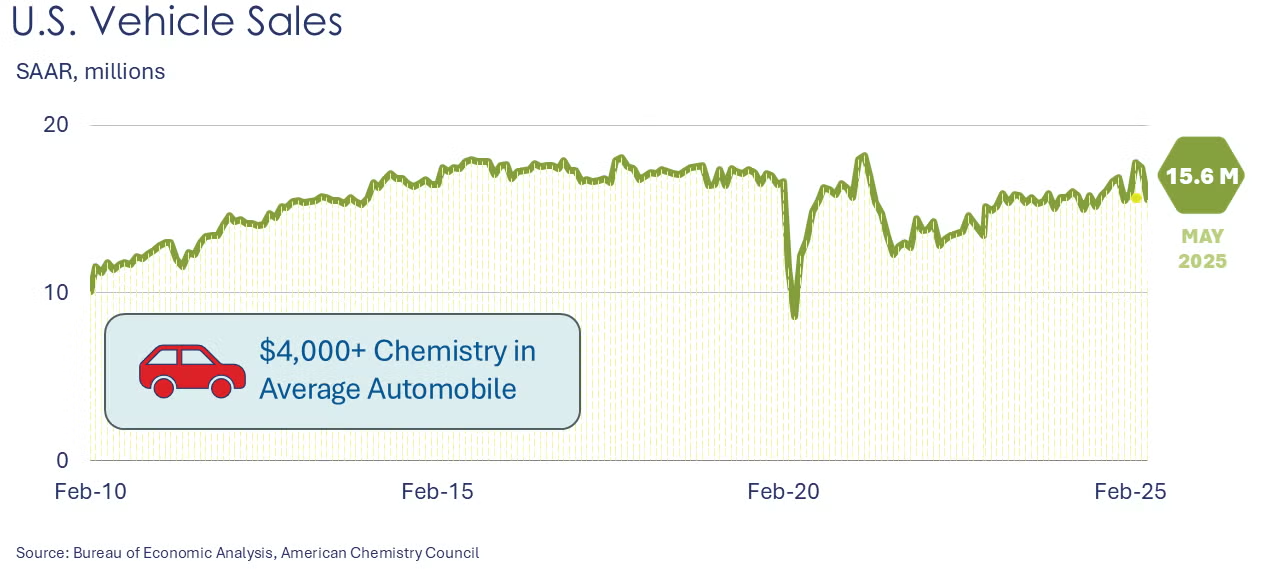
Following two months of above-trend sales as consumers tried to beat tariffs, light vehicle sales fell sharply in May to a 15.6 million seasonally adjusted annual rate (SAAR). The share of that total from light trucks (including SUVs and minivans) continued to climb, up to 83.5%.
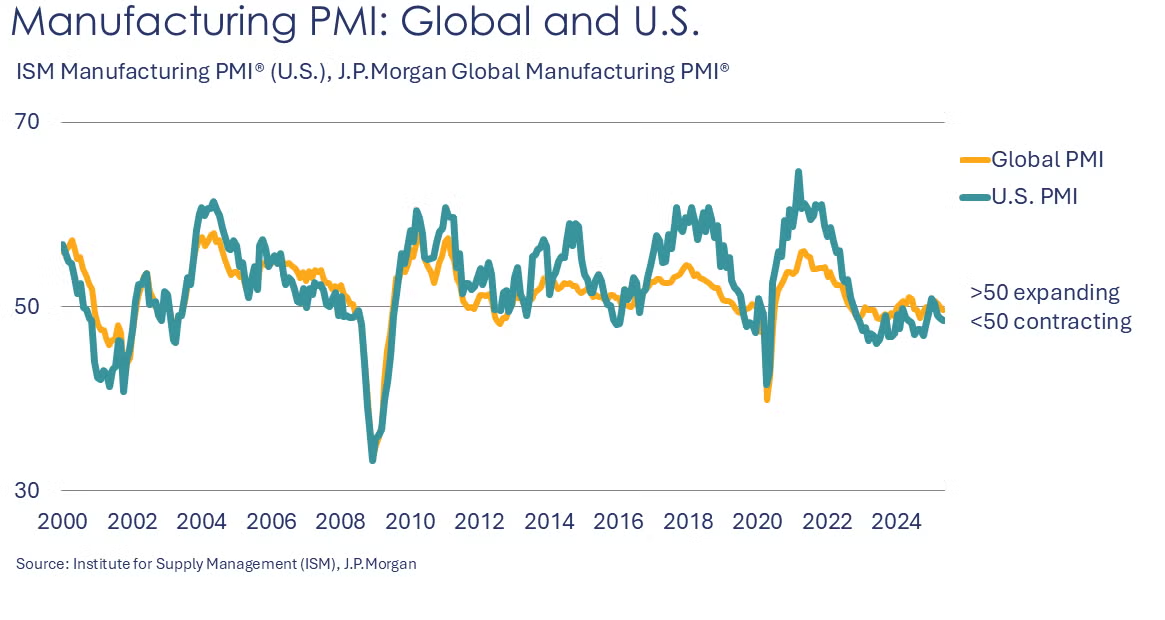
The ISM Manufacturing PMI® eased further in May, down 0.2 points to 48.5%. There was continued contraction among indicators, though the pace of contraction slowed for new orders, production, order backlogs, prices and employment. The contraction in new export orders and imports accelerated, however. Inventories also contracted. Supplier deliveries continued to slow. While the supplier deliveries index typically suggests changes in demand (by measuring the amount of “slack” in the supply chain), recent readings reflect the movement of goods as tariffs are delayed. The majority of comments cited tariffs and uncertainty as challenges to business activity.
Looking abroad, the JP Morgan Global PMI® fell 0.2 points in May to a five-month low of 49.6. Output, new orders, new export orders, and employment all contracted. Global manufacturers’ outlook improved, however, as business optimism rose from a 2 ½ year low.
Factory orders fell 3.7% in April. Gains in orders for defense capital goods, computers and IT equipment were not enough to offset sharp declines in other categories, notably civilian aircraft, motor vehicles, and consumer goods. Core business orders (nondefense capital goods excluding aircraft) fell 1.5%. Unfilled orders (a measure of the manufacturing pipeline) were flat. Shipments were up 0.3%, but inventories were off 0.1% Y/Y. The inventories to shipments ratio ticked higher to 1.58.
The U.S. trade deficit retreated in April from its all-time high in March. The deficit in goods & services came in at $61.6 billion, less than half of what it was in March. The narrowing of the deficit reflected a 3.0% increase in exports and a 16.3% decline in imports as tariffs were announced. Exports of industrial supplies & materials and capital goods rose (offset by lower exports of autos & parts). Imports fell across all major categories.
Construction spending fell for a third consecutive month in May, down 0.4%. Broad declines in privately-funded residential and nonresidential projects offset a gain in publicly-funded projects. Compared to a year ago, construction spending was up 0.5% Y/Y. Interest rates and uncertainty continue to dampen demand.
The ISM Services PMI® fell 1.7 points to 49.9, its first reading below 50 since June 2024. New orders, export orders, imports, and inventories contracted. Prices rose at an accelerating rate and employment expanded slightly. Overall business activity was flat, however. Within the comments, several respondents noted tariffs were creating challenges.
Fed Beige Book
Published two weeks in advance of each FOMC meeting, the Beige Book presents a summary of recent economic conditions around the twelve Federal Reserve districts.
- Reports across the twelve Federal Reserve Districts indicate that economic activity has declined slightly since the previous report.
- Half of the Districts reported slight to moderate declines in activity, three Districts reported no change, and three Districts reported slight growth.
- All Districts reported elevated levels of economic and policy uncertainty, which have led to hesitancy and a cautious approach to business and household decisions.
- Manufacturing activity declined slightly.
- Consumer spending reports were mixed, with most Districts reporting slight declines or no change; however, some Districts reported increases in spending on items expected to be affected by tariffs.
- Residential real estate sales were little changed, and most District reports on new home construction indicate flat or slowing construction activity.
- Reports on bank loan demand and capital spending plans were mixed.
- Activity at ports was robust, while reports on transportation and warehouse activity in other areas were mixed.
- On balance, the outlook remains slightly pessimistic and uncertain, unchanged relative to the previous report. However, a few District reports indicate the outlook has deteriorated while a few others indicate the outlook has improved.
CHEMICALS
Among the comments within the ISM Manufacturing PMI® report, the chemical industry was reported to be in contraction in May. Chemical industry production, new orders, employment, inventories, order backlogs, new export orders and imports contracted. Customers’ inventories were deemed too low. One chemical industry respondent noted, “Most suppliers are passing through tariffs at full value to us. The position being communicated is that the supplier considers it a tax, and taxes always get passed through to the customer. Very few are absorbing any portion of the tariffs.”
The Fed’s Beige Book included several comments on chemicals:
- Seventh District (Chicago) - “Demand for chemicals was unchanged overall, though one contact noted growing demand from the medical device industry.”
- Eighth District - “Contacts expressed uncertainty over the cost and availability of feed ingredients and chemicals sourced outside the U.S.”
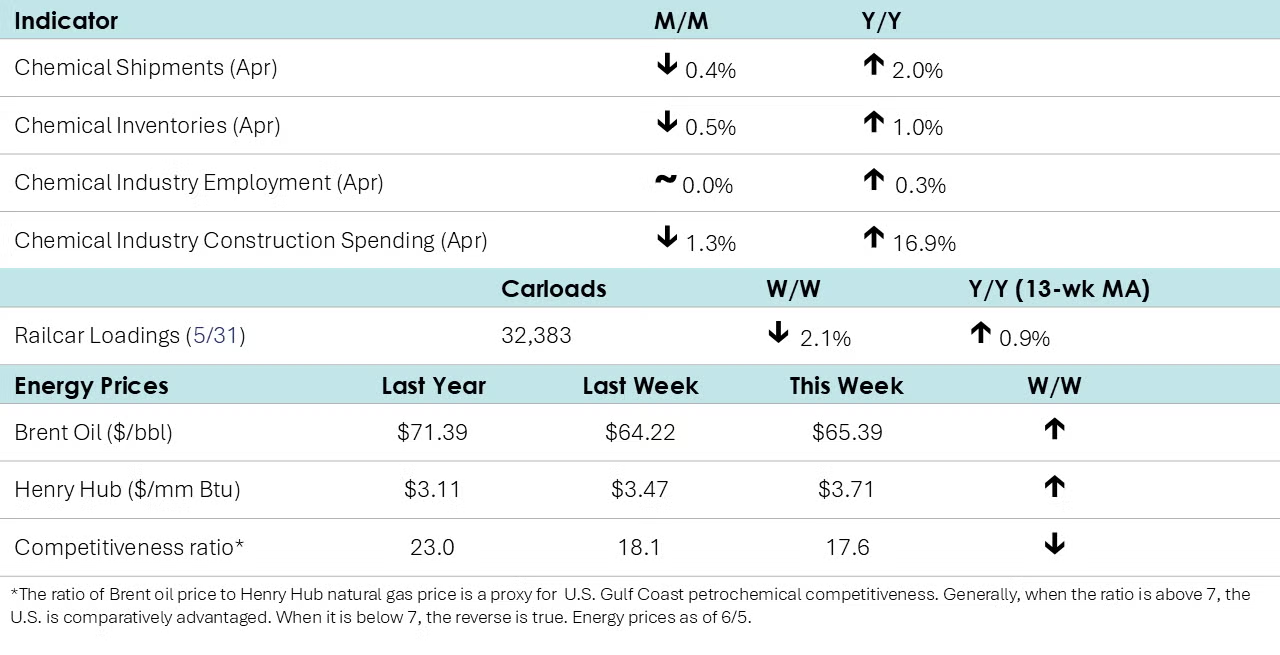
After hitting a record high in March, chemical industry construction spending eased in April, down by 1.3% to $41.4 billion. Compared to a year ago, chemical industry construction spending was up 16.9% Y/Y.
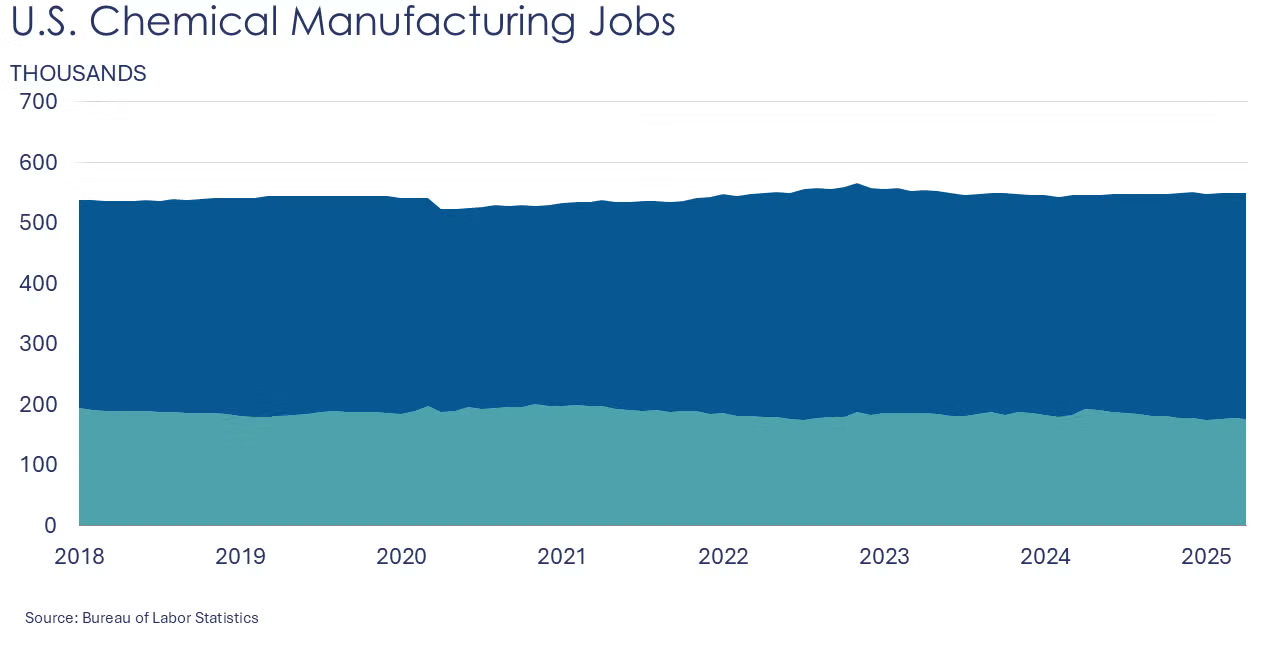
Chemical industry jobs were essentially flat in April at 549,000 (up 0.3% Y/Y). Employment in plastic resin manufacturing rose, however, up by 0.8% to 61,800, a level 2.1% higher than last April. (Note that data at the detailed industry level are lagged one month behind the headline jobs report.)
In May, combined chemical and pharmaceutical jobs fell by 500 to 900,700, a level up 0.3% Y/Y. A gain in the number of production workers was more than offset a decline in supervisory & non-production workers. Average hourly earnings for production workers rose 2.6% Y/Y to $31.46. The average workweek moved higher from 41.8 hours to 42.1 hours in May. With the gain in production workers and the average workweek, the implied labor input into the chemical industry rose in May, in contrast to the ISM PMI® report which reported that the chemical industry contracted.
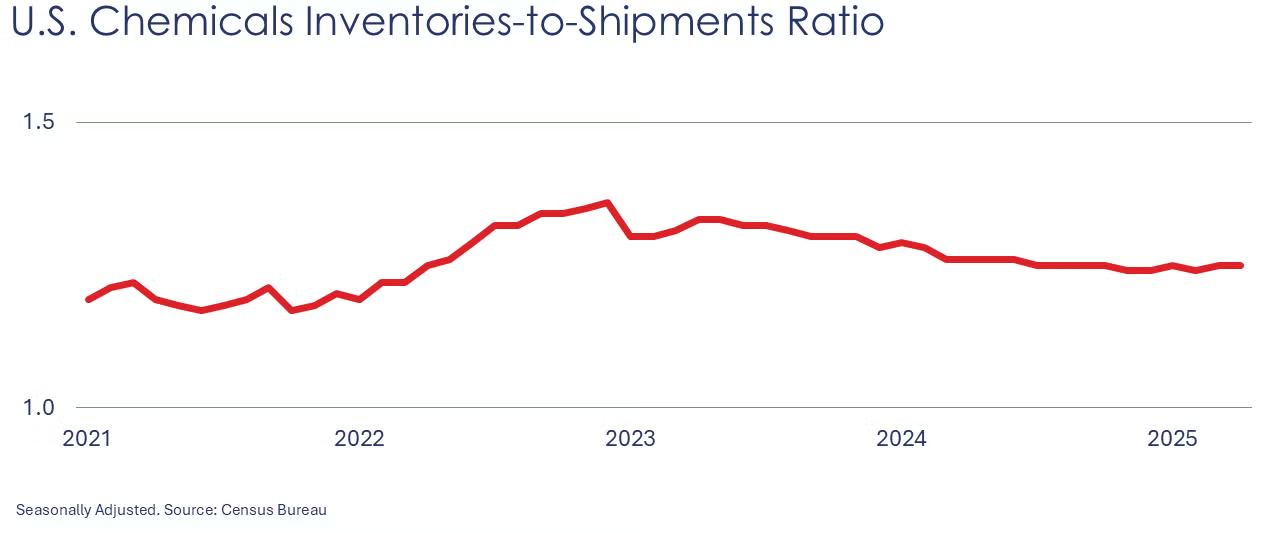
Chemical shipments eased for a second straight month in April, off 0.4%. There were declines across all categories, with the largest decline in shipments of coatings & adhesives. Chemical inventories also fell, by 0.5%, as a gain in inventories of agricultural chemicals offset declines in other chemicals. Inventories of coatings & adhesives were flat. Compared to a year ago, shipments were up 2.0% Y/Y while inventories were ahead 1.0% Y/Y. The inventories-to-shipments ratio remained stable at 1.25. A year ago, the ratio was 1.26.
According to data released by the Association of American Railroads, chemical railcar loadings were down to 32,383 for the week ending 31 May. Loadings were up 0.9% Y/Y (13-week MA), up (2.0%) YTD/YTD and have been on the rise for six of the last 13 weeks.
Energy Wrap-Up
- Oil prices were trending higher following a call between Trump and Xi on trade and China’s rare earth exports.
- U.S. natural gas prices also moved higher as expectations for above-average temperatures build, boosting gas demand for electric cooling.
- Natural gas inventories posted their sixth consecutive triple-digit build, up by 122 BCF, the largest build this year.
- The combined oil & gas rig count fell by another three at the end of last week to 560, the lowest since November 2021.
For More Information
ACC members can access additional data, economic analyses, presentations, outlooks, and weekly economic updates through ACCexchange.
In addition to this weekly report, ACC offers numerous other economic data that cover worldwide production, trade, shipments, inventories, price indices, energy, employment, investment, R&D, EH&S, financial performance measures, macroeconomic data, plus much more. To order, visit the ACC Store.
Every effort has been made in the preparation of this weekly report to provide the best available information and analysis. However, neither the American Chemistry Council, nor any of its employees, agents or other assigns makes any warranty, expressed or implied, or assumes any liability or responsibility for any use, or the results of such use, of any information or data disclosed in this material.
Contact the ACC Economics & Data Analytics department.