Running tab of macro indicators: 12 out of 20
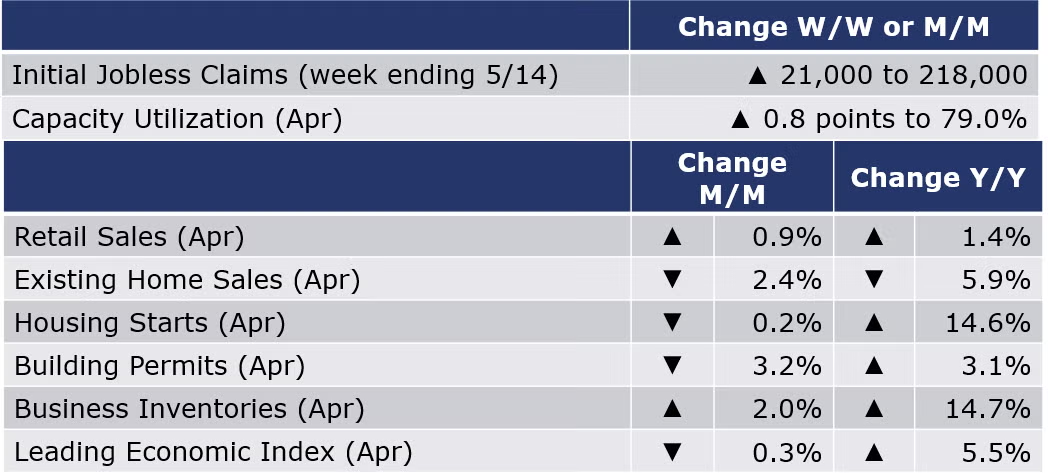
The number of new jobless claims rose by 21,000 to 218,000 during the week ending 14 May. Continued claims fell by 25,000 to 1.3 million, and the insured unemployment rate for the week ending 7 May was down by 0.1 percentage point to at 0.9%.
Pushed by inflation, nominal retail and food service sales rose by 0.9% in April, the fourth consecutive gain. The largest gains were in sales at motor vehicles & parts dealers, online platforms, electronics & appliance stores and restaurants. Gas station sales eased as gas prices briefly retreated in April. Compared to a year ago, sales were up 1.4% Y/Y.
Existing home sales declined for the third straight month, a 2.4% loss to a 5.61 million annual pace in April, reflecting rising mortgage rates and higher inflation. Compared to a year ago, sales were off 5.9%. The inventory of unsold homes at the end of April increased and represents a 2.2-month supply at the current sales pace. This is higher than last month and lower than a year ago. The median sales price was slightly down from March but still up 14.8% Y/Y.
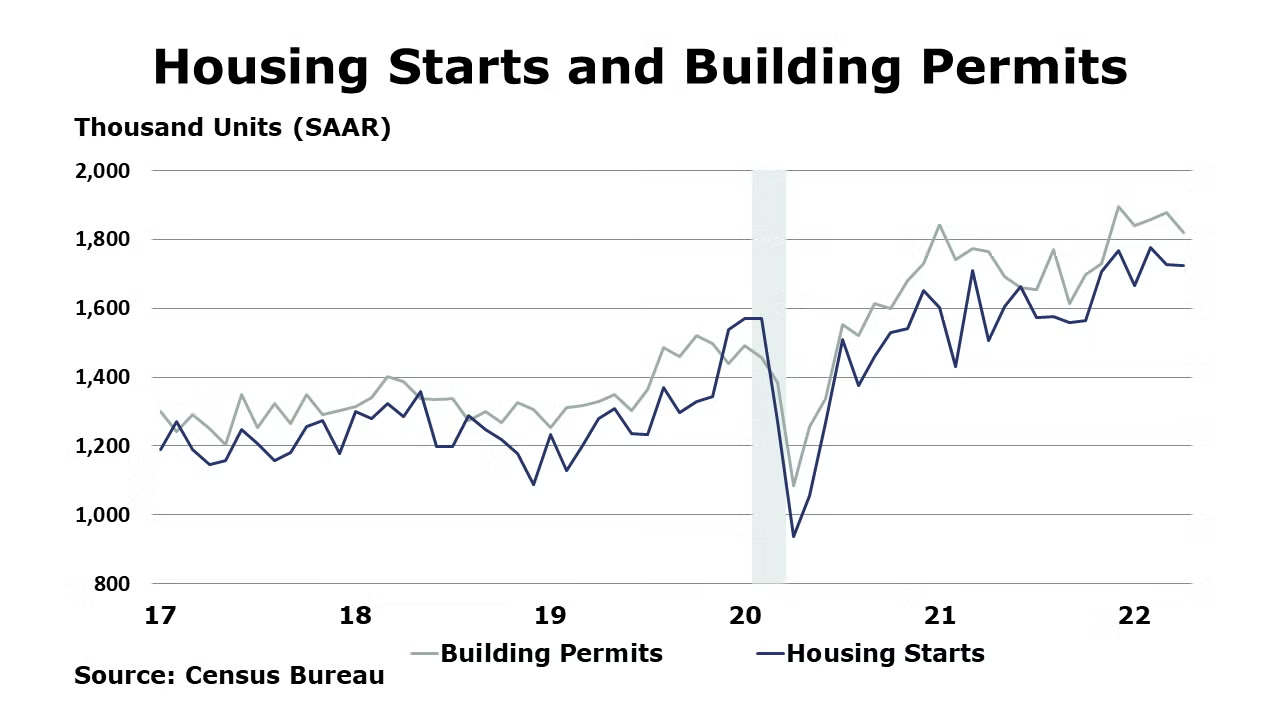
With mortgage rates at their highest level in 12 years and higher costs for building materials and labor, housing has become less affordable in recent months. As expected, housing starts eased 0.2% in April, following a 2.8% decline in March. Chemistry-intensive single starts fell by 7.3%. Forward-looking building permits fell 3.2%. Compared to a year ago, housing starts remained ahead by 14.6% Y/Y while building permits were up 3.1% Y/Y. Homebuilder sentiment fell sharply in May as sharply higher mortgage rates added to additional affordability concerns. The NAHB/Wells Fargo Housing Market Index dropped for a fifth straight month by eight points, with steep decline across all three segments: current sales, sales expectations, and buyer traffic.
Combined business inventories rose by 2.0% in March with gains in retail, wholesale, and manufacturing inventories. Combined business sales increased 1.8% with gains in manufacturing, retail, and wholesale. Compared to a year ago, business sales were up 14.1% while inventories were up 14.7% Y/Y. The combined inventories-to-sales ratio (1.27) remained the same compared to February.
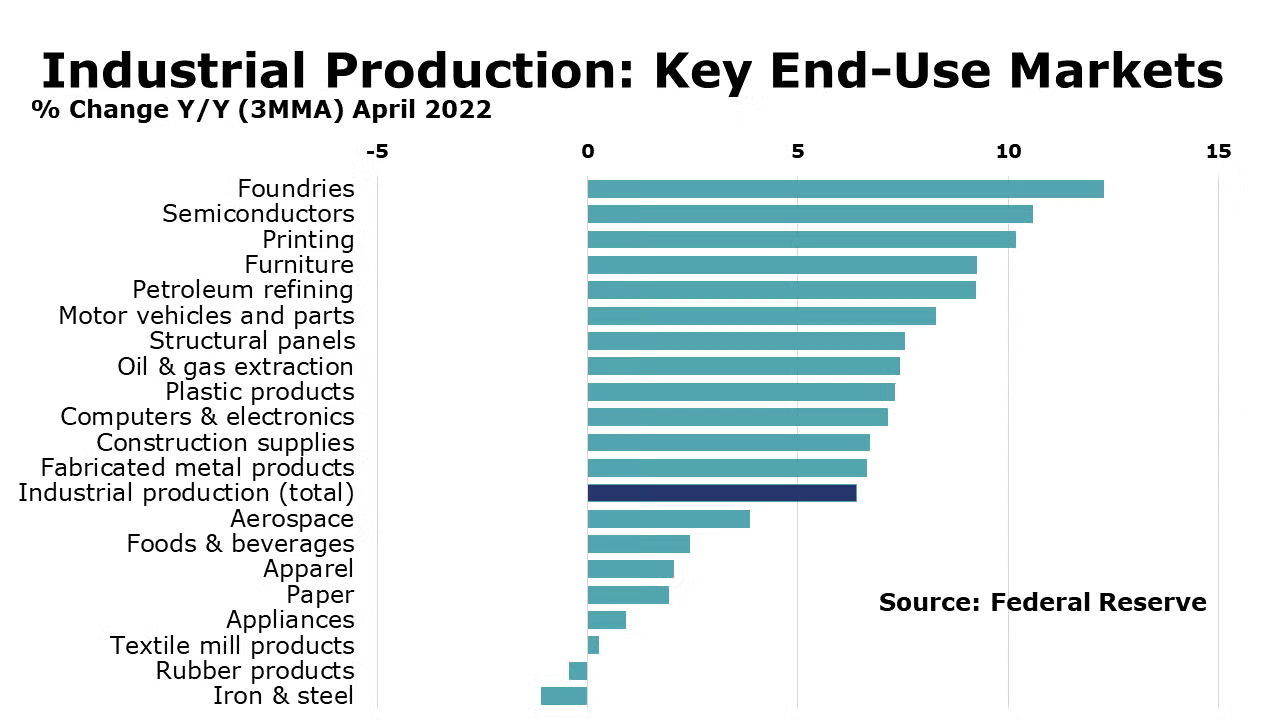
Industrial production rose for a fourth consecutive month in April, up by 1.1%, the highest monthly gain since October. Mining and utility output both increased and manufacturing output rose by 0.8%. Across manufacturing, gains were broad-based with the largest gains in motor vehicles, aerospace, primary metals, wood products and food & beverages. Compared to a year ago, manufacturing output was up 6.0% Y/Y while overall industrial production was ahead 6.4% Y/Y. Capacity utilization tightened by 0.8 points to 79.0%, the highest since 2007
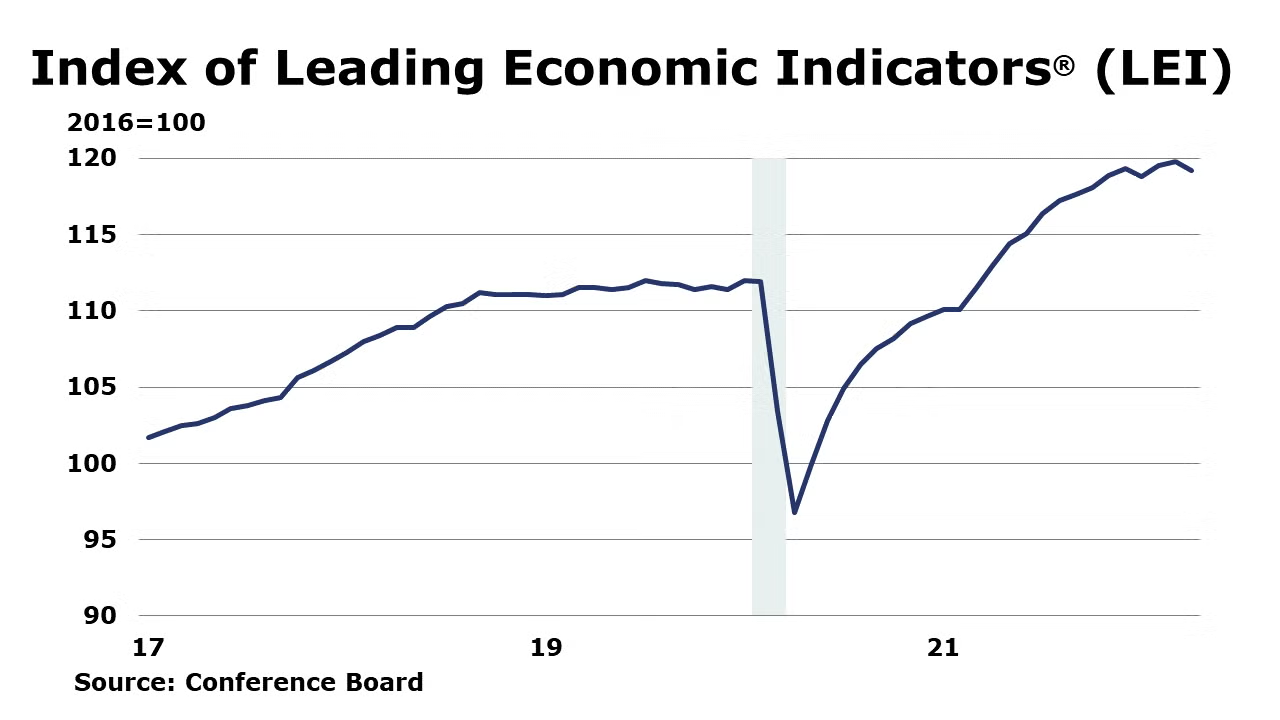
The Conference Board’s Index of Leading Economic Index® (LEI) eased by 0.3% in April. This follows a 0.1% increase in March. Compared to a year ago, the LEI was up 5.2% Y/Y. Weakening consumer expectations and falling building permits led the index to decline. It was the second decline this year and points to moderating growth through the end of the year.
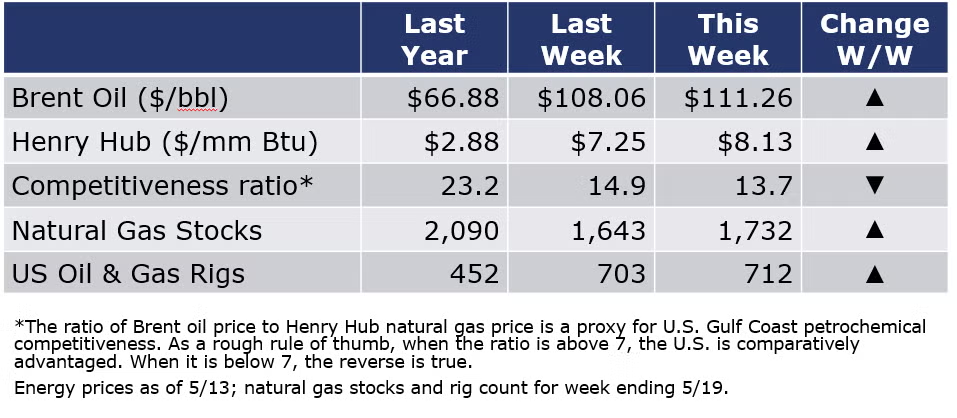
Energy prices continued to move higher last week. The news that COVID restrictions in Shanghai are easing boosted prospects for higher oil demand. Natural gas prices remained well above $8 on strong demand and weaker-than-expected supply growth. The combined oil and natural gas rig count continued to increase, though the number of active rigs remains well below pre-pandemic levels.
For the business of chemistry, the indicators still bring to mind a green banner for basic and specialty chemicals.
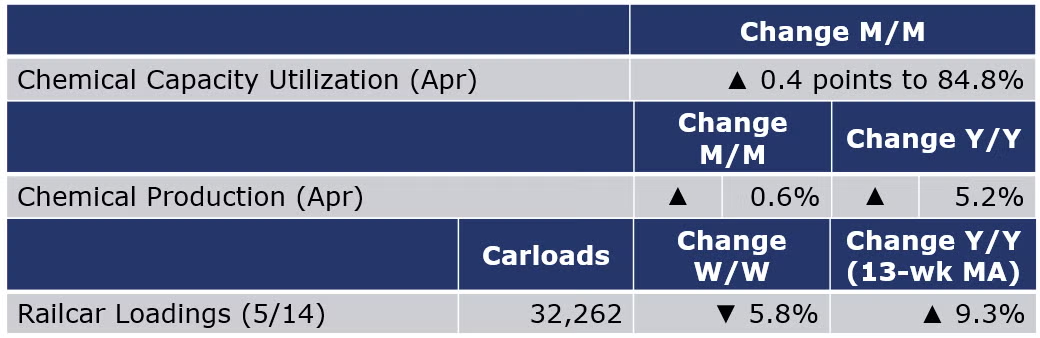
According to data released by the Association of American Railroads, chemical railcar loadings were down 5.8% to 32,262 for the week ending 14 May. Loadings were up 9.3% Y/Y (13-week MA), up 6.7% YTD/YTD and have been on the rise for 7 of the last 13 weeks.
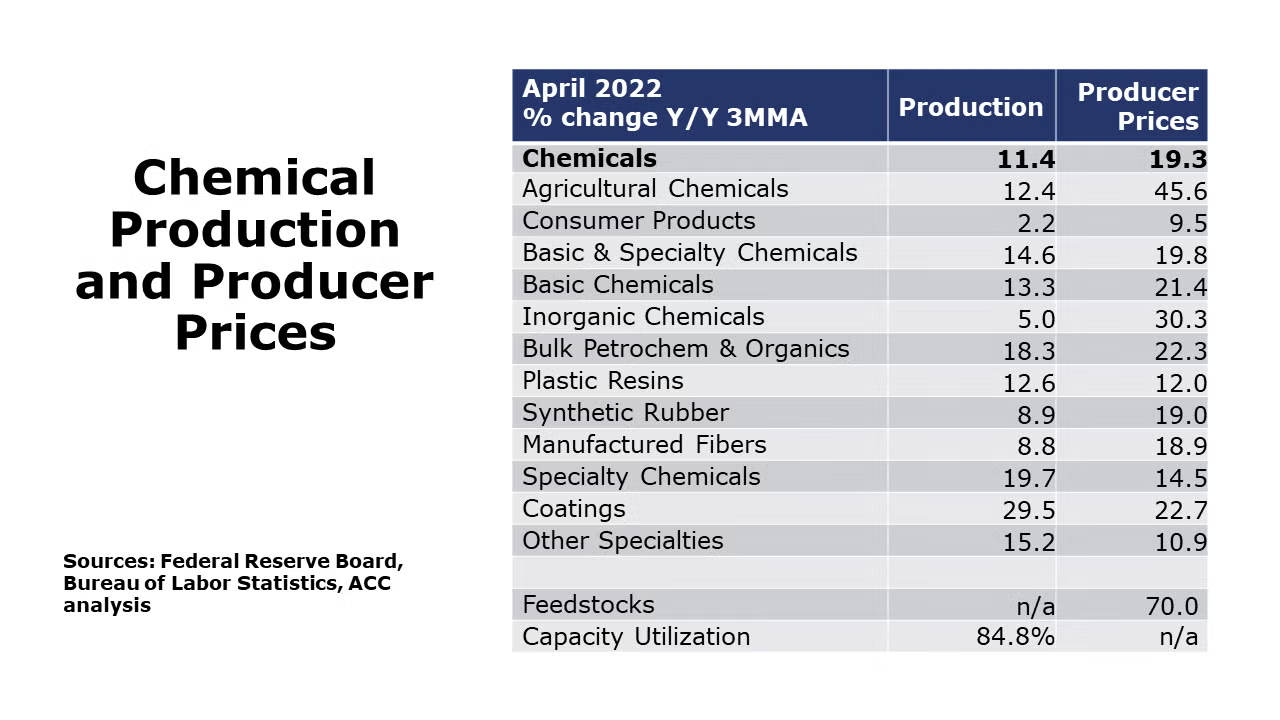
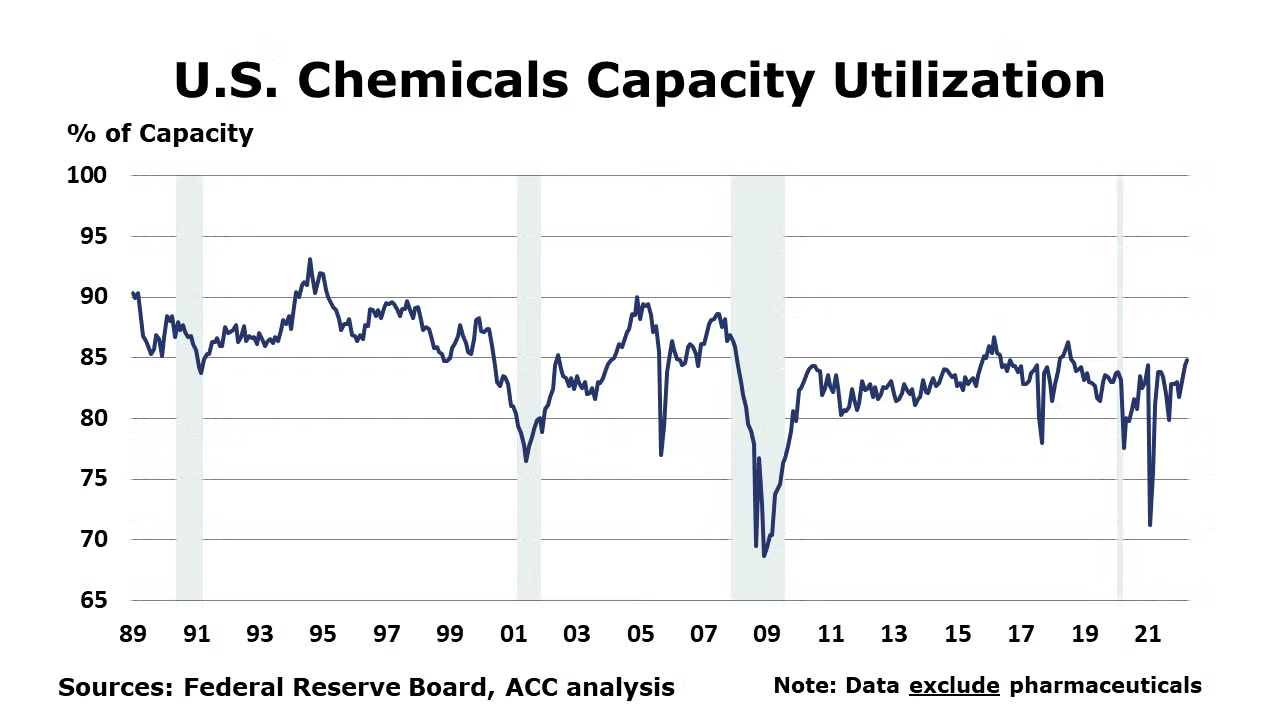
Chemical production rose by 0.6% in April, the third consecutive gain according to data from the Federal Reserve. There were gains in the production of inorganic chemicals, plastic resins, synthetic rubber, manufactured fibers, coatings, adhesives, other specialty chemicals, and consumer products. Output of organic chemicals declined. Compared to a year ago, chemical production was up 5.2% Y/Y. Chemical capacity utilization tightened by 0.4 percentage points to 84.8%, the highest since September 2018.
Note On the Color Codes
The banner colors represent observations about the current conditions in the overall economy and the business chemistry. For the overall economy we keep a running tab of 20 indicators. The banner color for the macroeconomic section is determined as follows:
Green – 13 or more positives
Yellow – between 8 and 12 positives
Red – 7 or fewer positives
For the chemical industry there are fewer indicators available. As a result we rely upon judgment whether production in the industry (defined as chemicals excluding pharmaceuticals) has increased or decreased three consecutive months.
For More Information
ACC members can access additional data, economic analyses, presentations, outlooks, and weekly economic updates through MemberExchange.
In addition to this weekly report, ACC offers numerous other economic data that cover worldwide production, trade, shipments, inventories, price indices, energy, employment, investment, R&D, EH&S, financial performance measures, macroeconomic data, plus much more. To order, visit https://store.americanchemistry.com/.
Every effort has been made in the preparation of this weekly report to provide the best available information and analysis. However, neither the American Chemistry Council, nor any of its employees, agents or other assigns makes any warranty, expressed or implied, or assumes any liability or responsibility for any use, or the results of such use, of any information or data disclosed in this material.
Contact us at ACC_EconomicsDepartment@americanchemistry.com


