Running tab of macro indicators: 12 out of 20
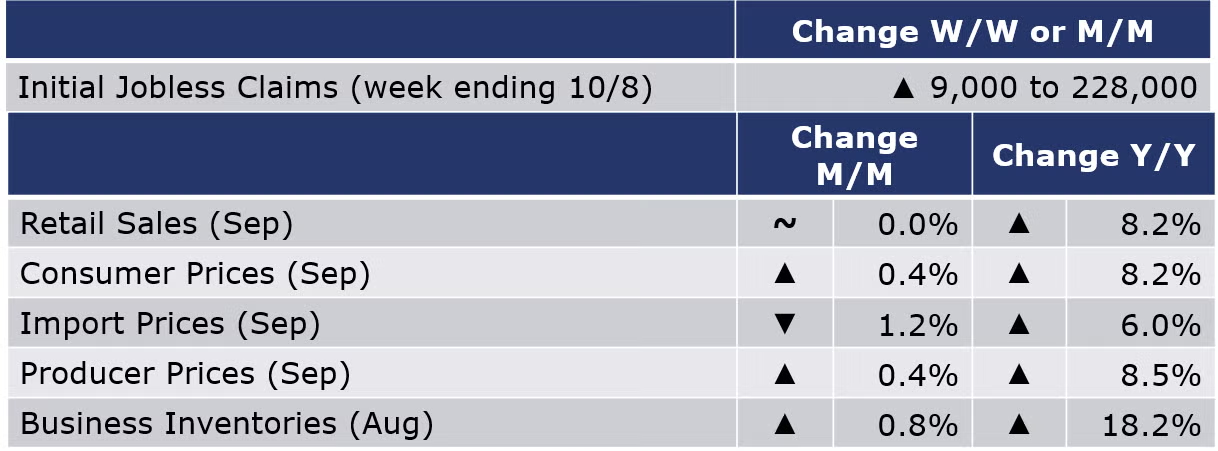
The number of new jobless claims was up by 9,000 to 228,000 during the week ending 1 October. Continued claims were up 3,000 to 1.368 million for October 1st week and the insured unemployment rate was 1.0%, virtually unchanged from the previous week's revised rate.
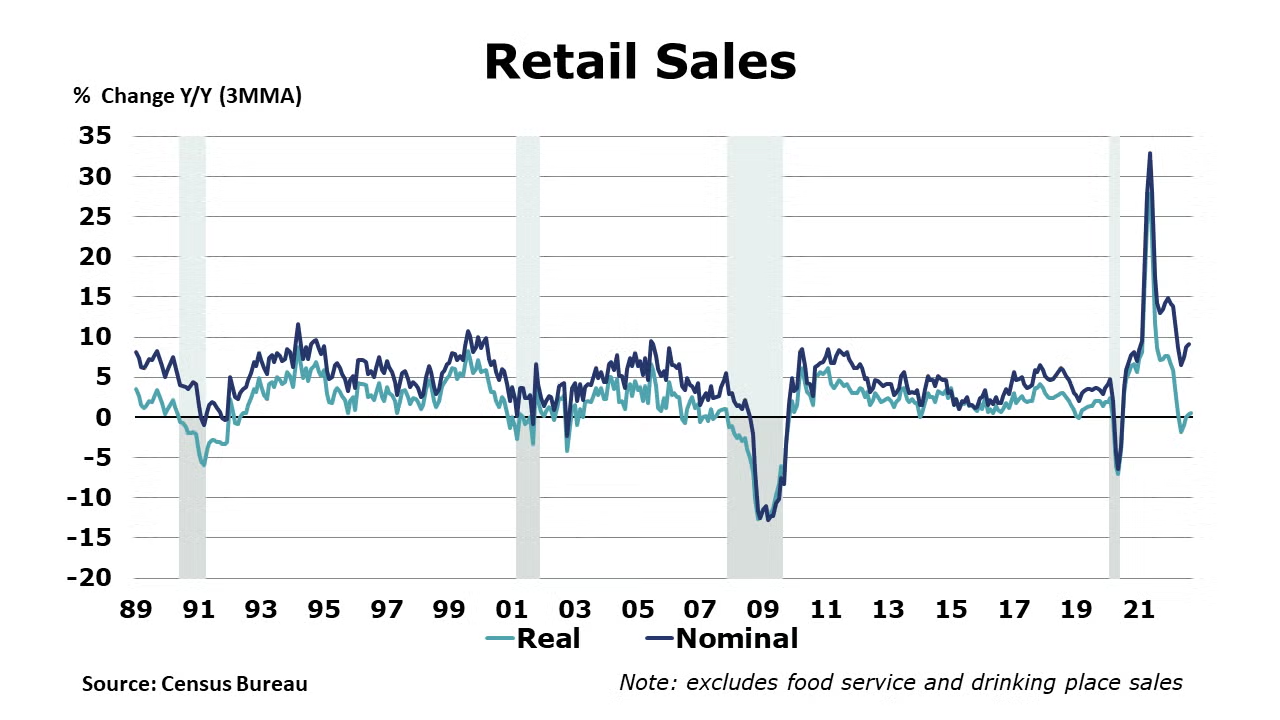
Nominal retail and food service sales were flat in September following a 0.4% gain in August. After adjusting for inflation, retail sales fell. There were declines in spending as consumers pay higher prices for goods, including lower spending for vehicles, furniture & furnishings, building materials, electronics, gas stations and sporting & hobby goods. Those declines were offset by gains in the nominal sales of food & beverage, personal care, general merchandise and clothing and accessories. Online and restaurant sales also rose in September. Compared to a year ago, headline sales were up 8.2% Y/Y.
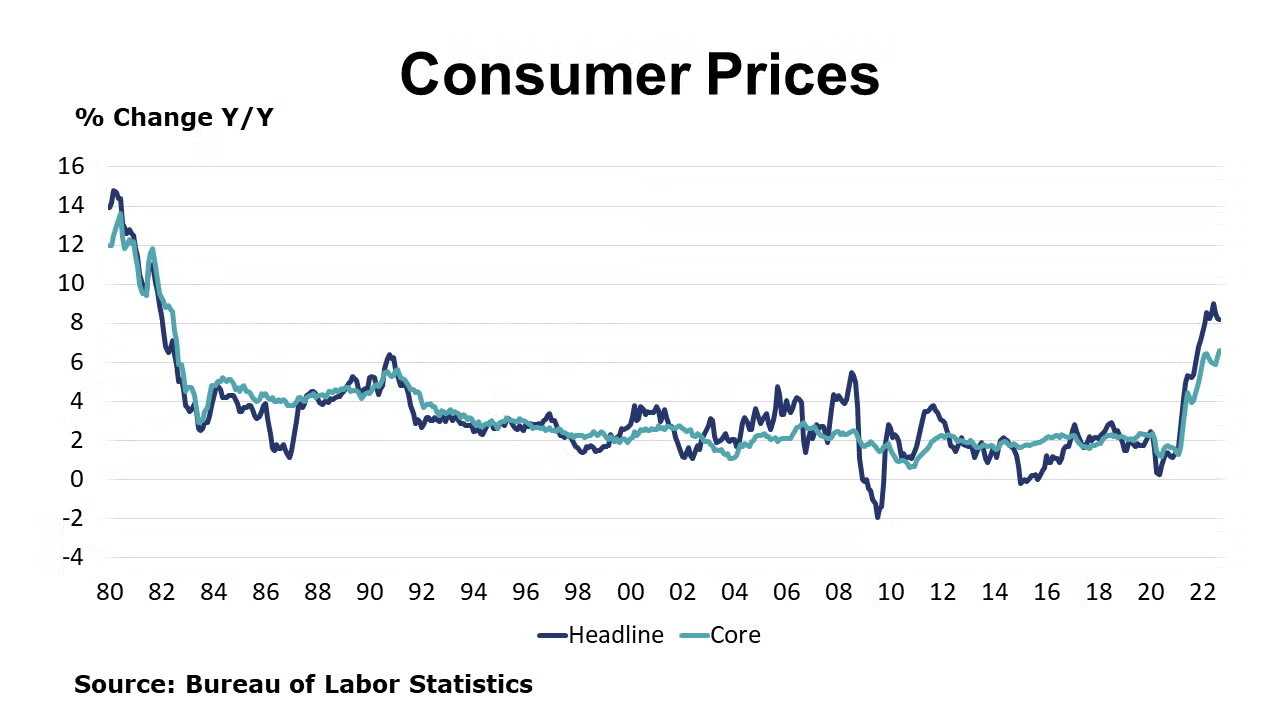
U.S. consumer prices rose another 0.4% in September and have risen 8.2% over the past 12 months. That annual rate marks a 40-year high. The core CPI which excludes volatile food and energy prices also rose in September - by 0.6% - and have grown by 6.6% over the past 12 months. The price of gasoline fell over the July-to-September period but, it has still risen 18.2% overall since September 2021. Prices for food, utilities, new cars, rent, transportation and healthcare all increased in September.
Following declines in July and August, producer prices rose by 0.4% in September. The increase was led by gains in food and energy prices. After averaging 0.6% per month through the first eight months of the year, core goods prices were flat in September the lowest monthly change since a decline in May 2020. Prices for core services, on the other hand, rose by 0.6%, the largest increase since last November. The shift reflects, in part, the ongoing pivot from spending on goods to spending on services. The BLS noted that a quarter of the increase in final demand services came from traveler accommodation services. Annual growth of producer prices continued to slow to an 8.5% Y/Y gain. Core prices rose 5.6% Y/Y, the same pace as in August. Both measures are running lower than earlier in the year. Import prices fell for a third month, down by 1.2% in September on lower prices for imported fuels and nonfuel imports. Core import prices were lower for a fifth straight month. Compared to a year ago, headline import prices were up 6.0%.
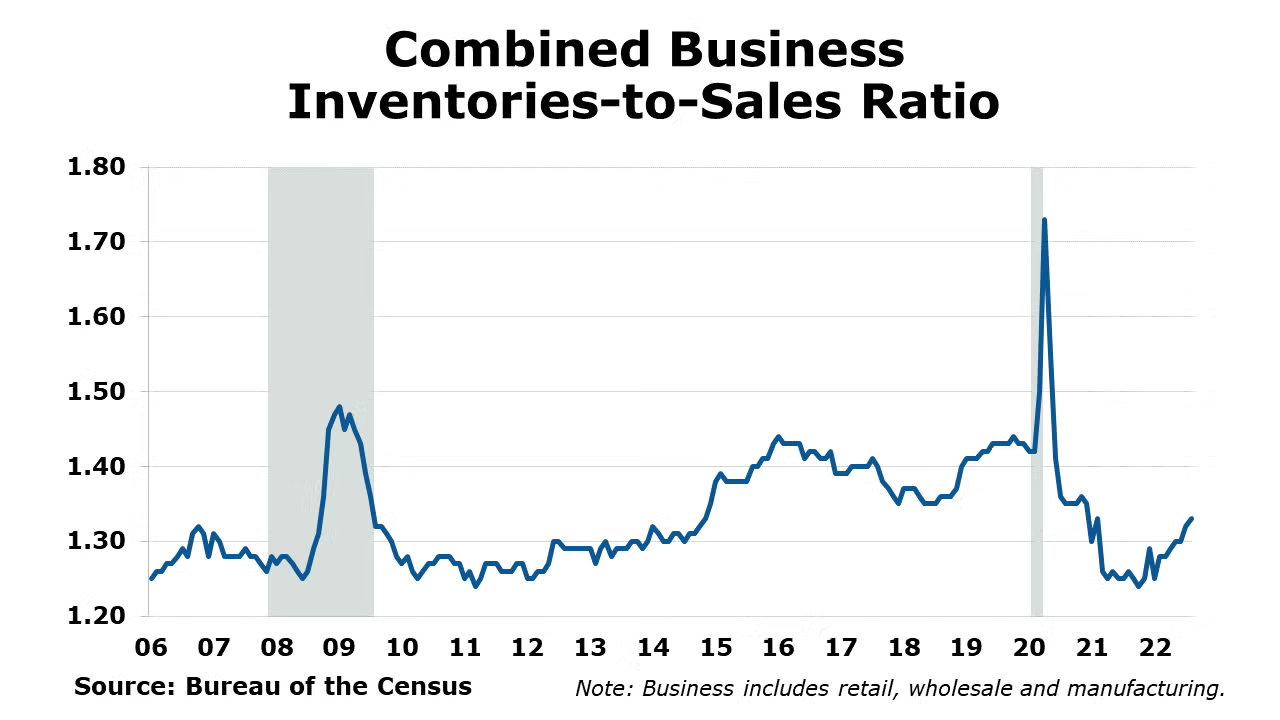
The nominal value of combined business inventories continued to expand in August, up 0.8% with gains across all major segments of the supply chain. The largest gains were in merchant wholesalers. Combined business sales increased (0.8%). Sales increased across all segments but was more pronounced in the manufacturing. Compared to a year ago, business inventories were up 18.2% Y/Y while sales were up by 12.6% Y/Y. The inventories-to-sales ratio edged up to 1.33 in August. A year ago, the ratio was 1.27.
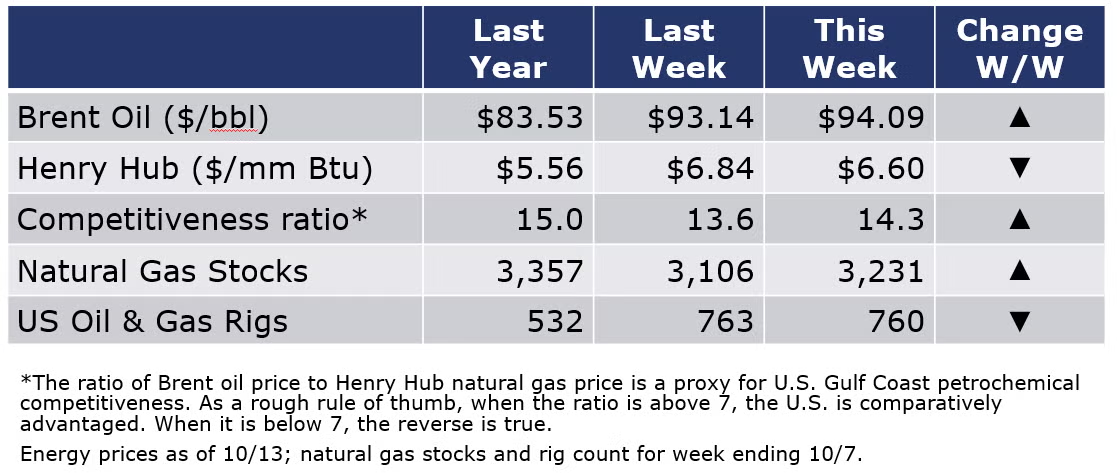
Oil prices were a little higher on last week’s OPEC announcement for additional production cuts at a time when strategic reserves around the world are historically low. The SPR is at four-decade lows following a series of coordinated releases intended to stabilize oil markets following the Russian invasion of Ukraine. U.S. natural gas prices were slightly lower than a week ago. The combined oil and rig count fell by three to 760 during the week ending 10/7.
For the business of chemistry, the indicators still bring to mind a yellow banner for basic and specialty chemicals.
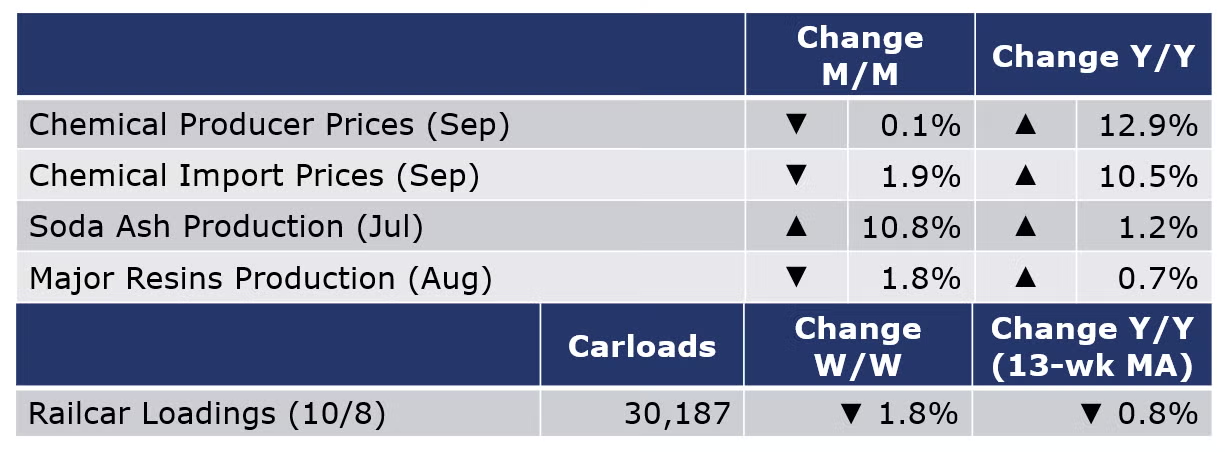
According to data released by the Association of American Railroads, chemical railcar loadings were down 1.8% to 30,187 during the week ending 8 October. Loadings were down 0.8% Y/Y (13-week MA), up 2.9% YTD/YTD and have been on the rise for six of the last 13 weeks.
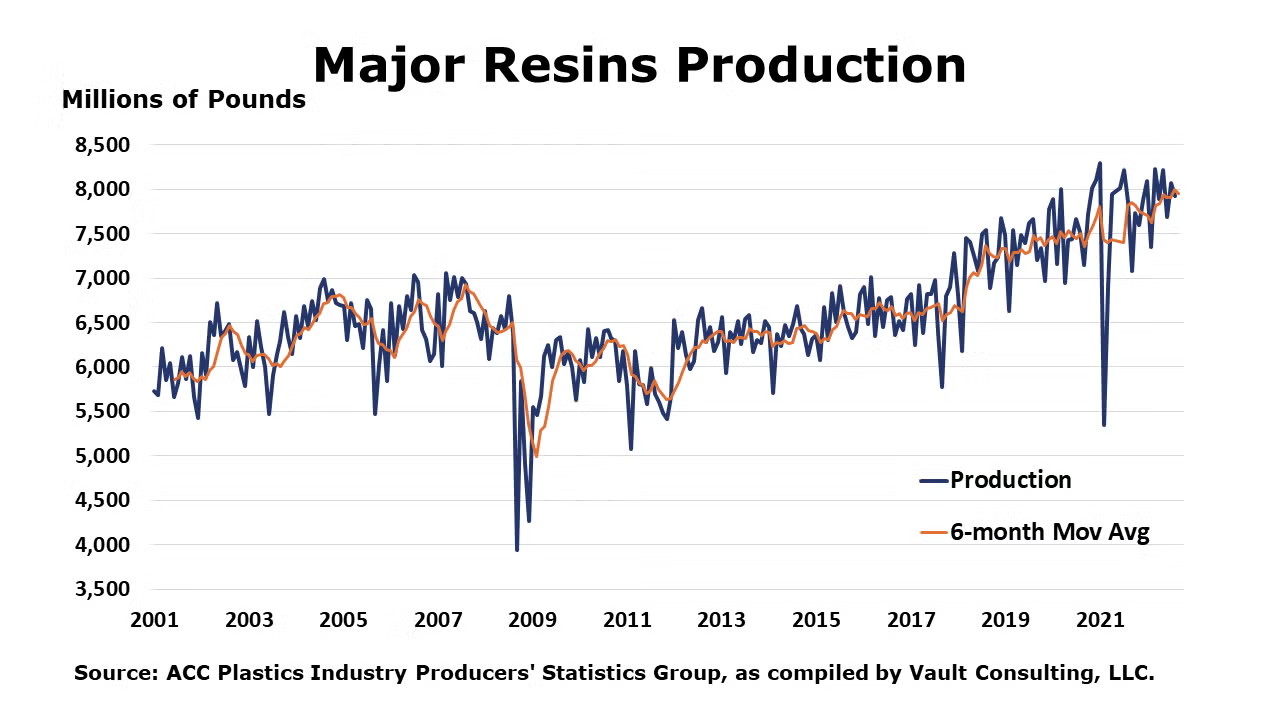
U.S. production of major plastic resins totaled 7.9 billion pounds during August 2022, down 1.8% compared to the prior month, and up 0.7% Y/Y, according to statistics released by the American Chemistry Council. Year-to-date production was 63.6 billion pounds, a 4.8% increase Y/Y. Sales and captive (internal) use of major plastic resins totaled 8.0 billion pounds, up 8.3% compared to the prior month, and up 4.6% Y/Y. Year-to-date sales and captive use were 62.6 billion pounds, a 5.1% increase Y/Y.
The U.S. Geological Survey reported that monthly production of soda ash in July was 992 thousand tons, up 10.8% compared to the previous month and down 4.7% YTD/YTD. Stocks rose 35.7% compared to June to 308 thousand tons at the end of the month, a 10-day supply. Ending stocks were up 14.5% Y/Y.
Chemical producer prices eased for a third month, down 0.1% in September. Trends among individual categories were mixed with gains in prices for coatings, inorganic chemicals, manufactured fibers, and agricultural chemicals offset by declines in prices for organic chemicals, synthetic rubber and consumer products. Prices for plastic resins, and other specialty chemicals were flat in September. Compared to last September, chemical prices remained ahead by 12.9% Y/Y.
Chemical import prices fell for a second month in September, down 1.9%. Prices for chemical exports were also lower by 3.2%. Compared to a year ago, chemical import prices were up 10.5% Y/Y while export prices were up 1.9% Y/Y, both declining comparisons to the month earlier.
Note On the Color Codes
The banner colors represent observations about the current conditions in the overall economy and the business chemistry. For the overall economy we keep a running tab of 20 indicators. The banner color for the macroeconomic section is determined as follows:
Green – 13 or more positives
Yellow – between 8 and 12 positives
Red – 7 or fewer positives
For the chemical industry there are fewer indicators available. As a result we rely upon judgment whether production in the industry (defined as chemicals excluding pharmaceuticals) has increased or decreased three consecutive months.
For More Information
ACC members can access additional data, economic analyses, presentations, outlooks, and weekly economic updates through MemberExchange.
In addition to this weekly report, ACC offers numerous other economic data that cover worldwide production, trade, shipments, inventories, price indices, energy, employment, investment, R&D, EH&S, financial performance measures, macroeconomic data, plus much more. To order, visit http://store.americanchemistry.com/.
Every effort has been made in the preparation of this weekly report to provide the best available information and analysis. However, neither the American Chemistry Council, nor any of its employees, agents or other assigns makes any warranty, expressed or implied, or assumes any liability or responsibility for any use, or the results of such use, of any information or data disclosed in this material.
Contact us at ACC_EconomicsDepartment@americanchemistry.com

