Running tab of macro indicators: 11 out of 20
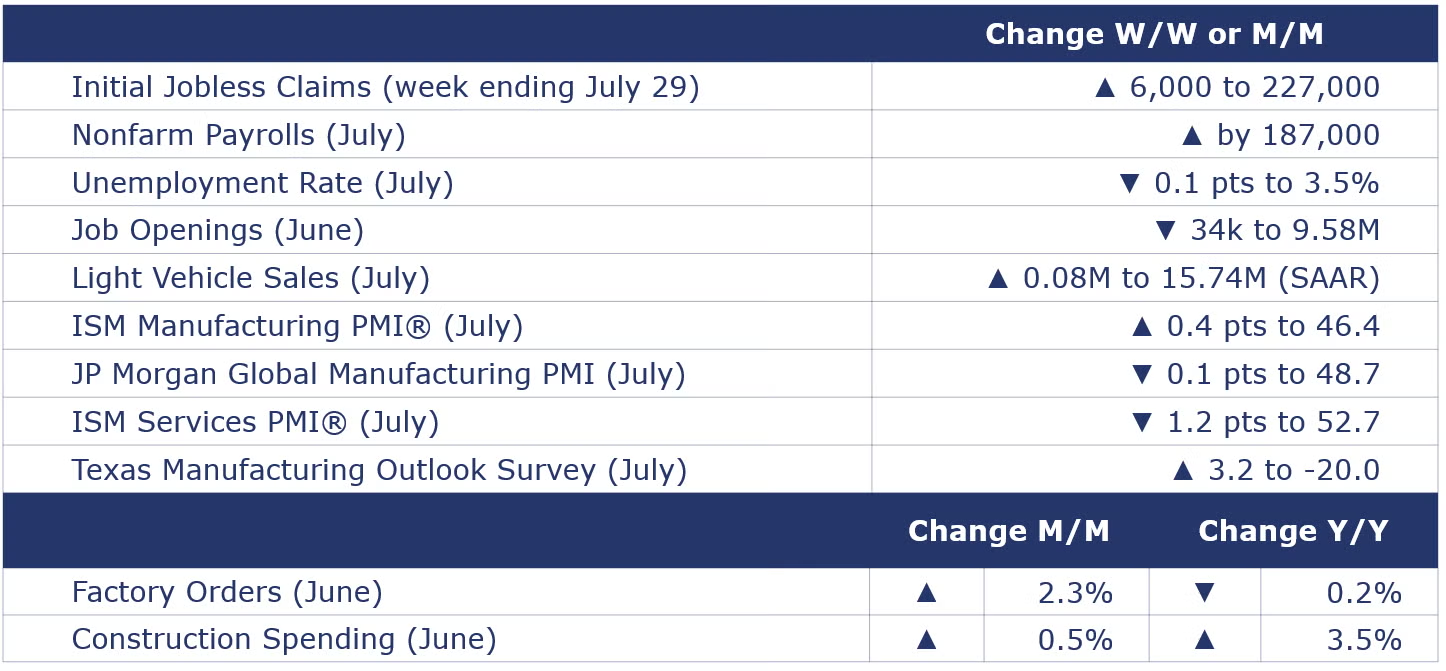
The number of new jobless claims rose by 6,000 to 227,000 during the week ending 29 July. Continuing claims fell by 50,000 to 1.83 million, and the insured unemployment rate for the week ending 22 July was unchanged at 1.1%.
Nonfarm payrolls expanded by 187,000 in July following a similar gain in June. Manufacturing employment declined by 2,000. Transportation and warehousing employment also fell for a second month. Employment in temporary help services fell for a sixth consecutive month. The average workweek edged lower, a sign of waning labor demand. The average hourly earnings for production workers rose by 4.8% Y/Y, slightly higher than last month. The unemployment rate dipped back down to 3.5%. The labor force edged higher, and those workers were absorbed into the ranks of the employed. The participation rate (the share of the working-age population available to work) remained steady, well below pre-pandemic rates. Job openings continued to ease incrementally in June, down 34,000 to 9.58 million, the lowest level in more than two years. The labor market remained tight with 1.6 jobs available for each unemployed person, helping consumers remain resilient, but complicating the Fed’s mission to bring inflation down.
Construction spending continued to expand in May, up 0.5%, with gains in residential and publicly-funded construction. Nonresidential construction spending was flat. Spending on new single-family projects jumped and multifamily also grew. Nonresidential construction spending also grew. Flat growth in private nonresidential spending reflected higher spending in office and manufacturing that was offset by lower spending in health care and communications projects. Construction spending in manufacturing has surged over the past year, especially in the computer/electrical/electronics segment which has more than tripled compared to a year ago, with new projects incentivized by the CHIPS, IRA, and Bipartisan Infrastructure Law. Compared to last year, construction spending was up 3.5% Y/Y.
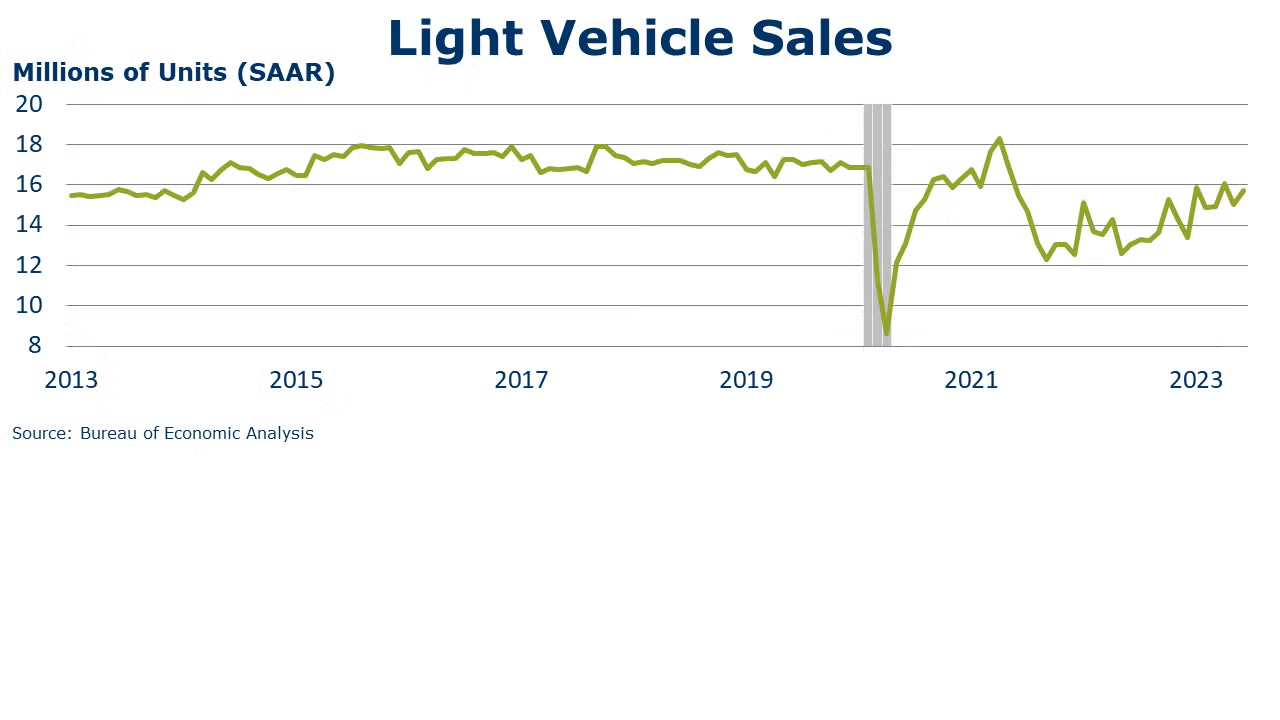
Light vehicle sales inched up by 0.08 million to 15.74 million (SAAR) in July. Sales were higher in both passenger cars and light trucks. Sales were ahead of last July’s 13.31 million (SAAR) pace but remained below pre-pandemic levels as some remaining supply chain issues and higher lending rates constrain the market.
The ISM Services PMI® registered 52.7% in July, indicating continued expansion in the U.S. services sector. Except for a contraction in December, services have grown in 37 of the last 38 months. July’s expansion was due mostly to the increase in business activity, new orders, and employment. In addition, backlog orders were up, inventories declined, and delivery times improved. The ISM Manufacturing PMI® rose slightly in July, up 0.4 points to 46.4%. Coming in below 50 (for a ninth consecutive month), the reading indicates that manufacturing activity continued to contract. There was continued contraction in new orders, production, employment, inventories, prices export orders and order backlogs, though several indicators suggested contraction at a slower pace than in June. Supplier deliveries continued to improve for a 10th straight month.
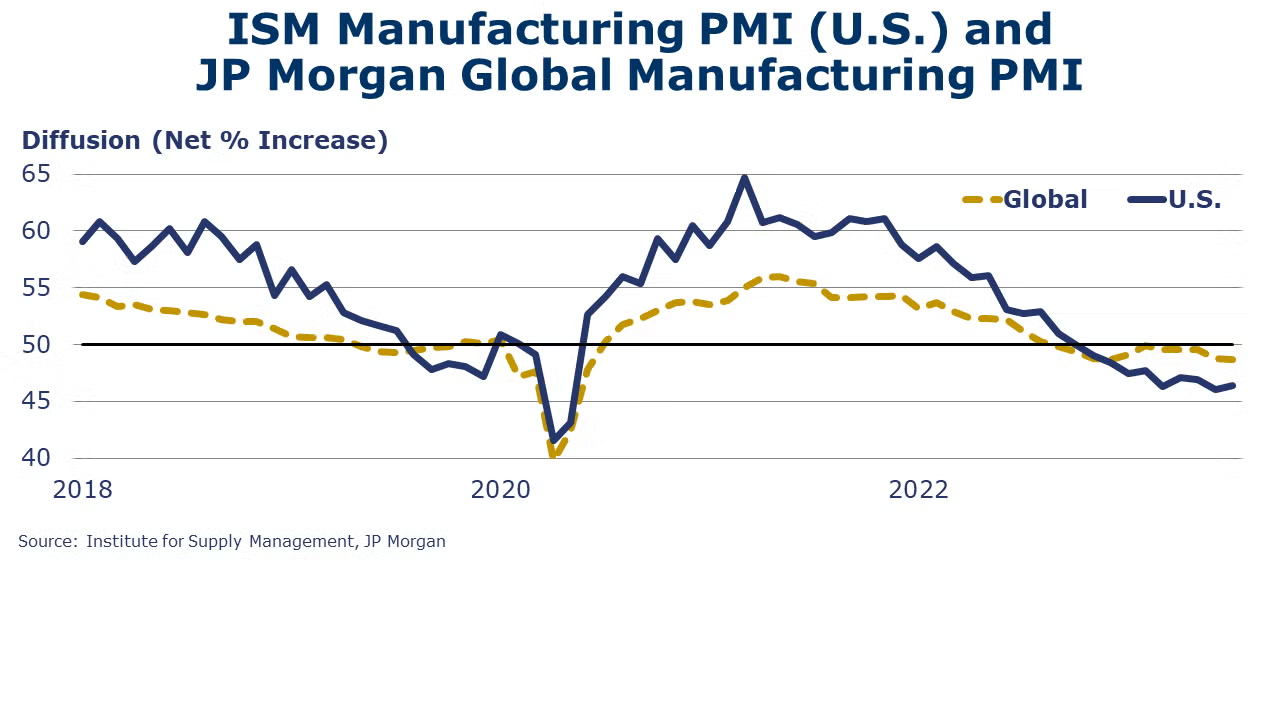
The JP Morgan Global PMI remained in contraction territory, staying steady at 48.7 in July, signaling continued contraction in global manufacturing activity for the eleventh month in a row. North America saw mild growth led by gains in Mexico and Canada. Only seven out of 29 nations saw output expand last month (including India). Factory output, new orders, and new export orders declined. Expectations for future output and employment saw growth.
Factory orders jumped 2.3% in June, largely due to a surge in new orders for civilian aircraft. New orders for computers & related products and IT equipment posted solid gains and orders for construction materials and motor vehicles & parts were also higher. New orders for core business goods (aka nondefense capital goods, excluding aircraft) were only marginally higher, following several months of gains. Orders for consumer goods continued to decline, however. Unfilled orders (a measure of the manufacturing pipeline) rose 1.8%, driven almost entirely by civilian aircraft and computers & related products. Manufacturing shipments edged slightly higher (up 0.1%) while inventories were flat. The inventories-to-shipments ratio was steady at 1.49.
Manufacturing activity continued to contract in Texas, according to the Dallas Fed’s Texas Manufacturing Outlook Survey. The general business activity index rose 3.2 points to -20.0. A reading below 0 indicates contraction. Production, new orders, capacity utilization, shipments, and capital expenditures continued to contract. Employment and hours worked expanded, however. Looking ahead, Texas manufacturers were more optimistic about business conditions six months from now.
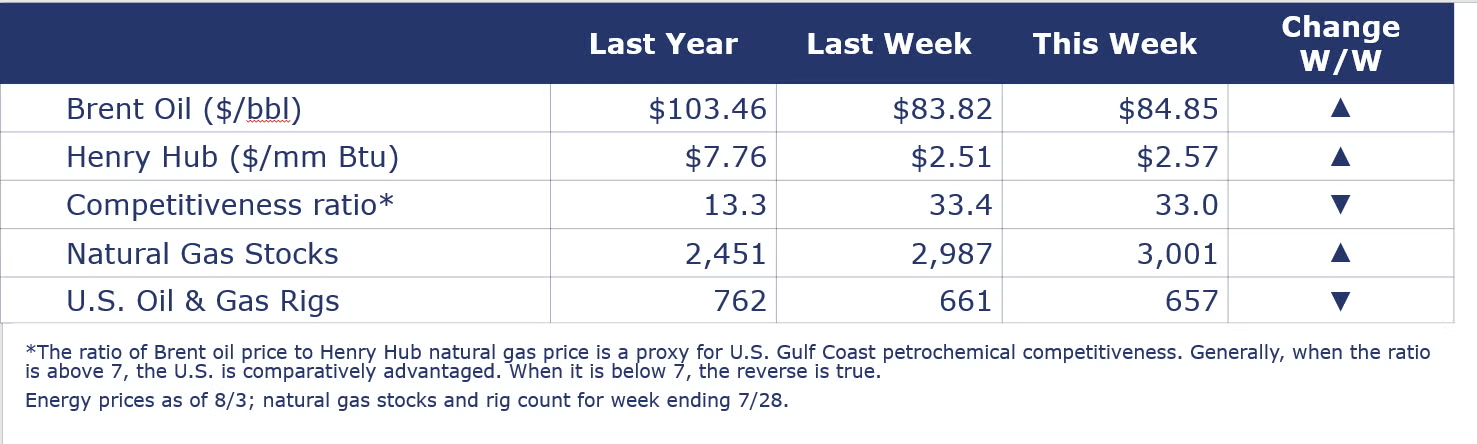
Oil prices continued to move higher due to supply concerns and the expected extension of KSA’s 1 M bpd production cut. U.S. natural gas prices were up slightly from a week ago, but remain subdued on ample inventories. Natural gas inventories topped 3 TCF last week, a milestone that usually doesn’t occur until mid-September. The combined oil and gas rig count fell by four to 657.
Indicators for the business of chemistry bring to mind a red banner.
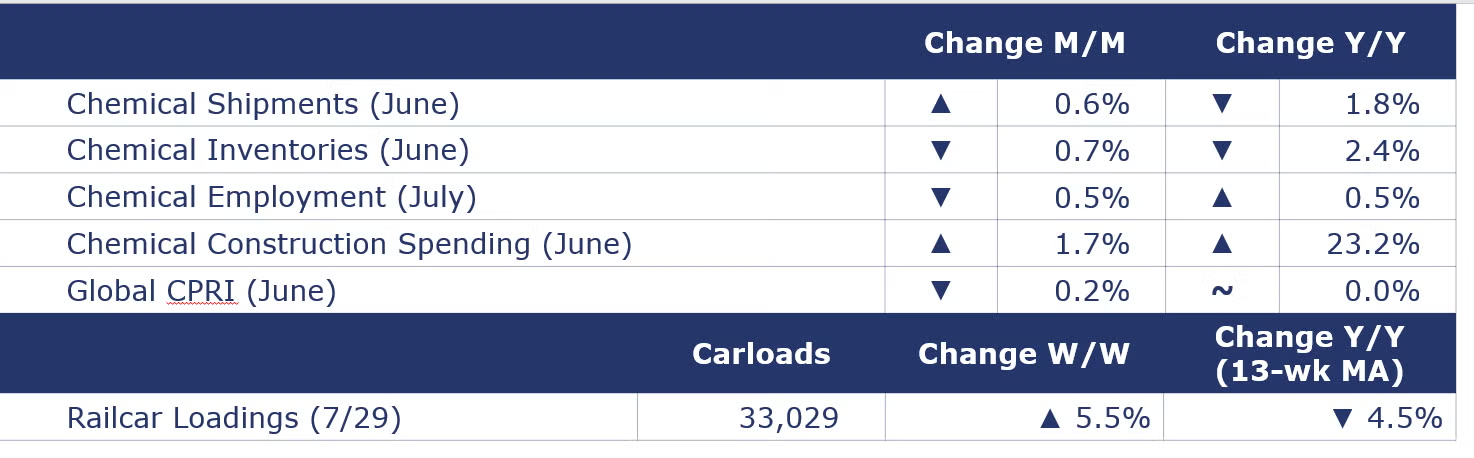
According to data released by the Association of American Railroads, chemical railcar loadings were up to 33,029 for the week ending 29 July. Loadings were down 4.5% Y/Y (13-week MA), down (4.2%) YTD/YTD and have been on the rise for eight of the last 13 weeks.
Among the details in the ISM Manufacturing PMI report, the chemical industry reportedly contracted in July. Production, employment, inventories, order backlogs, export orders and imports were all lower. New orders were reportedly higher for chemical products, the only one of the six largest manufacturing sectors to report growth in orders. Customers’ inventories continued to be assessed as “too low”. The chemical industry reported faster supplier deliveries in July. One chemical industry respondent noted, “Sales in our industry are extremely slow entering into the second half of the year, and no upturn is expected until at least the fourth quarter.”
Among the chemical industry comments from the Texas Manufacturing Outlook Survey, “The chemical industry in general is in a slump currently.”
Chemical and pharmaceutical industry employment fell by 0.5% (4,600) in July to 913,400, following a decline in June. Total employment remained 0.5% higher compared to a year ago, however. The decline in July reflected lower employment in both production workers and supervisory and non-production workers. Average hourly earnings were up 10.0% to $30.13. The average workweek declined by 18 minutes to 41.1 hours. Combined with the lower number of production workers, the total labor input into the chemical industry declined in July, consistent with the ISM report that the industry contracted in July.
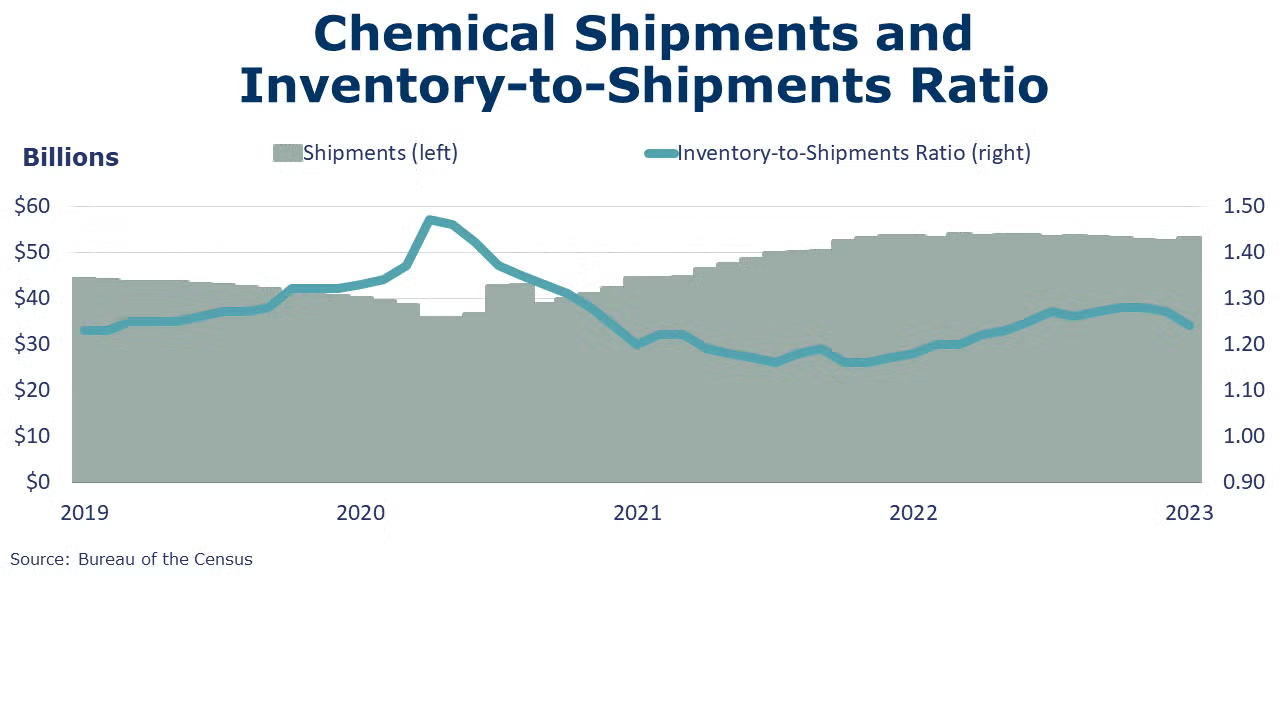
Chemical shipments rose in June following three consecutive declines. Shipments of chemicals were up 0.6% to $52.7 billion with gains across all three segments. Inventories of chemicals fell 0.7%, following flat growth in May. Compared to a year ago, shipments were down 1.8% Y/Y while inventories were off 2.4% Y/Y. The inventories-to-sales ratio moved lower from 1.26 in May to 1.24 in June.
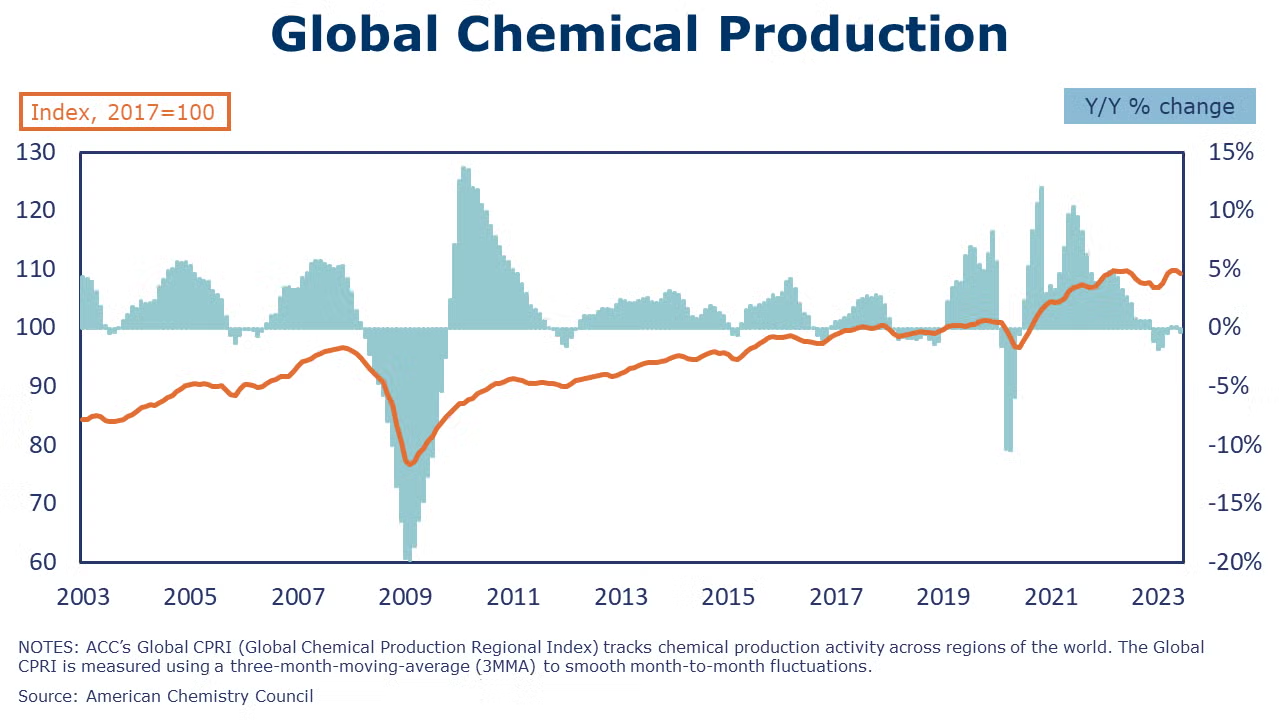
The ACC Global Chemical Production Regional Index(Global CPRI) inched down by 0.2% in June, following flat growth in May. Africa & Middle East and Asia led the decline in chemical production. The decline in May reflects slowing chemical production in several major producing countries, including China, Korea, Taiwan, Germany, Italy, Spain and United Kingdom. Global output is down in all segments, with agricultural chemicals showing the sharpest decline. Global chemicals production growth was flat Y/Y.
Chemical industry constructionspending rose by 1.7% in June to a seasonally adjusted annual pace of $35.5 billion. That was 23.2% higher than a year ago.
Note On the Color Codes
The banner colors represent observations about the current conditions in the overall economy and the business chemistry. For the overall economy we keep a running tab of 20 indicators. The banner color for the macroeconomic section is determined as follows:
Green – 13 or more positives
Yellow – between 8 and 12 positives
Red – 7 or fewer positives
For the chemical industry there are fewer indicators available. As a result, we rely upon judgment whether production in the industry (defined as chemicals excluding pharmaceuticals) has increased or decreased three consecutive months.
For More Information
ACC members can access additional data, economic analyses, presentations, outlooks, and weekly economic updates through ACCexchange.
In addition to this weekly report, ACC offers numerous other economic data that cover worldwide production, trade, shipments, inventories, price indices, energy, employment, investment, R&D, EH&S, financial performance measures, macroeconomic data, plus much more. To order, visit http://store.americanchemistry.com/.
Every effort has been made in the preparation of this weekly report to provide the best available information and analysis. However, neither the American Chemistry Council, nor any of its employees, agents or other assigns makes any warranty, expressed or implied, or assumes any liability or responsibility for any use, or the results of such use, of any information or data disclosed in this material.
Contact us at ACC_EconomicsDepartment@americanchemistry.com.

