Running tab of macro indicators: 7 out of 20
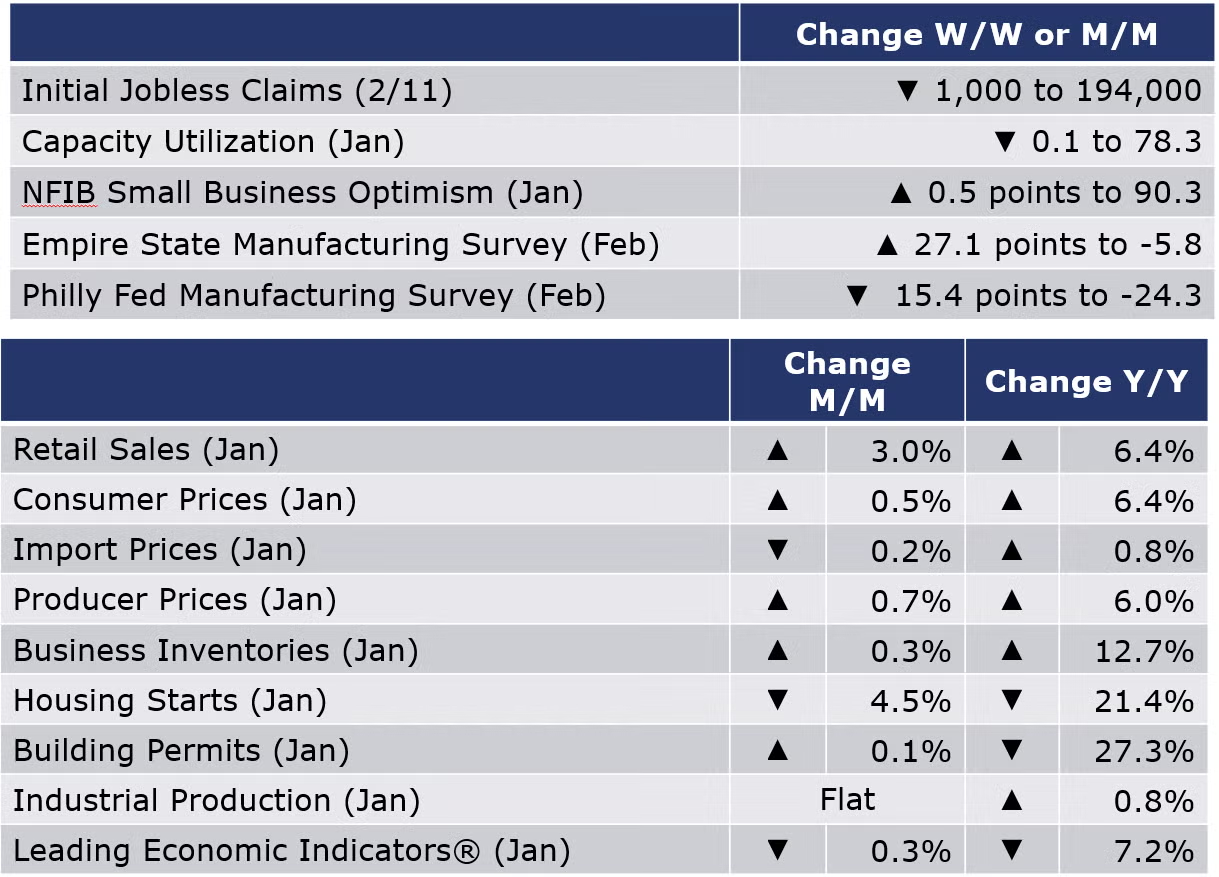
The number of new jobless claims fell by 1,000 to 194,000 during the week ending February 11. Continuing claims increased by 16,000 to 1.7 million, and the insured unemployment rate for the week ending February 4 was unchanged at 1.2%.
Consumer prices continued to move higher in January, up 0.5% from December. Energy prices rose, as did food prices (especially eggs, meats, poultry, and cereals). Excluding the volatile food and energy components, core consumer prices rose by 0.4%. The gain in core consumer prices reflected higher costs for shelter (in part an estimated price), motor vehicle insurance, recreation, apparel, household furnishings, and communications. Compared to a year ago, headline consumer prices were up 6.4% while core prices were up 5.6% Y/Y. While both indicate slowing growth, the pace of improvement has also slowed.
U.S. producer prices jumped back up in January, rising by 0.7%. The index for goods rose 1.2%, driven by higher energy costs – especially gasoline which rose 6.2%. The index for energy was up a strong 5.0% following two months of moderation. Excluding food and energy, core prices were up 0.6%. Headline prices were up 6.0% Y/Y while core prices were up 4.5% Y/Y. Prices jumped in the latest month but, taking in the longer trend over the past 12 months, inflationary pressures are steadily moderating.
U.S. import prices have fallen for seven months in a row and were down 0.2% in January as lower fuel import prices offset a gain in nonfuel import prices. Fuel imports prices have declined every month since July and were down another 4.9% in January. Over the past 12 months, import fuel prices rose 0.4%, driven by a 20.1% advance in natural gas prices which offset a 1.2% drop in petroleum import prices. Imported food prices were up 1.3%. Excluding fuel and food prices, import prices rose 0.2% in January and have risen 0.7% over the past 12 months. Prices for all imported commodities were up 0.8% over the same 12-month period. Following six months of declines, export prices rose 0.8% in January as higher non-ag prices offset a small decline in agricultural export prices. U.S. export prices have risen 2.3% over the past 12 months.
The nominal value of combined business inventories continued to expand in December, up 0.3%, as inventories in all sectors posted gains (inventories in retail increased 0.7%, manufacturers’ inventories were up 0.4% while retail gained 0.1%). Combined business sales decreased (-0.6%) as sales fell in manufacturing and retail. Sales in wholesale remained unchanged. Compared to a year ago, business inventories moved up 12.7% Y/Y, while sales were up 6.4%. The inventories-to-sales ratio rose from 1.35 to 1.37 in December. A year ago, the ratio was 1.29.
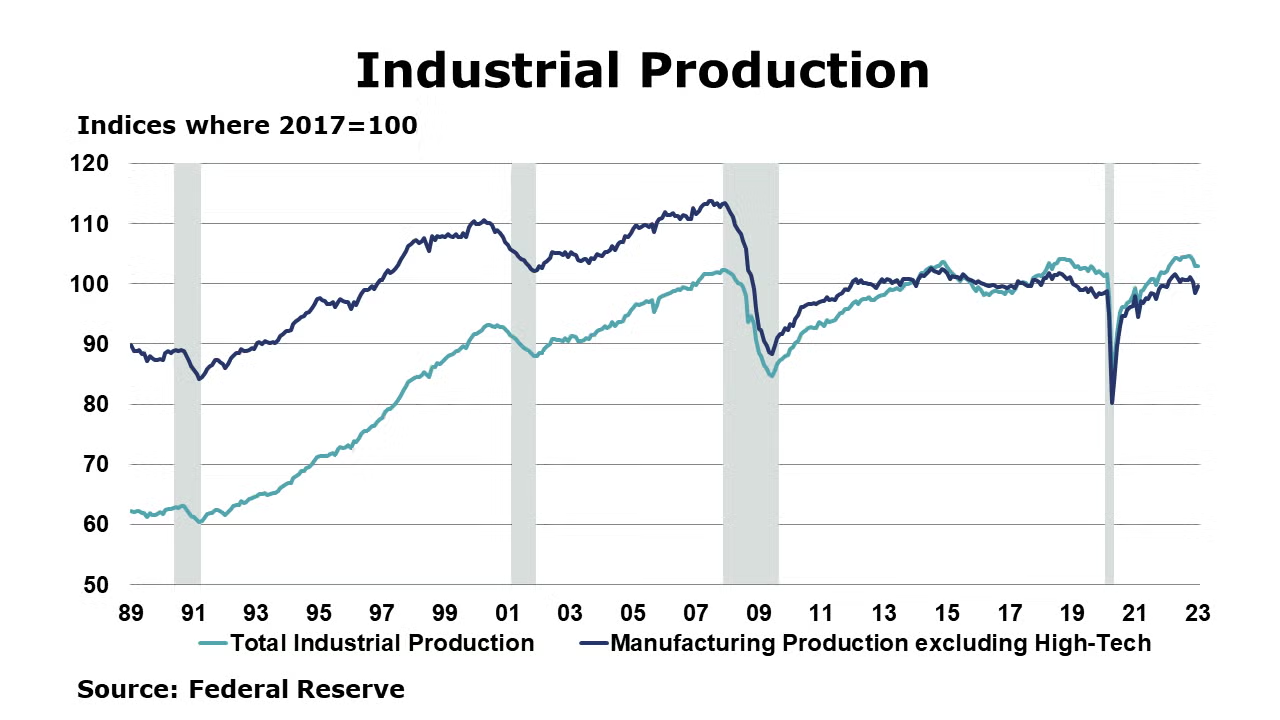
U.S. industrial production growth was unchanged in January following two months of decline. Compared to a year ago, industrial production was up 0.8%. Manufacturing output rose by 1.0% in January with mixed performance across sectors. Production increased in durables (except wood products and furniture). Production expanded in nondurables with gains across most sectors (printing, petroleum and coal and plastic and rubber products contracted). Compared to a year ago, manufacturing output was up 0.3%. Capacity utilization declined 0.1 points to 78.3%, a level 1.3 points lower than its long-run average (1972-2022).
The Conference Board’s Leading Economic Index® fell by 0.3% in January, the tenth consecutive month. The index is down 7.2% Y/Y and continues to signal a recession over the next 12 months.
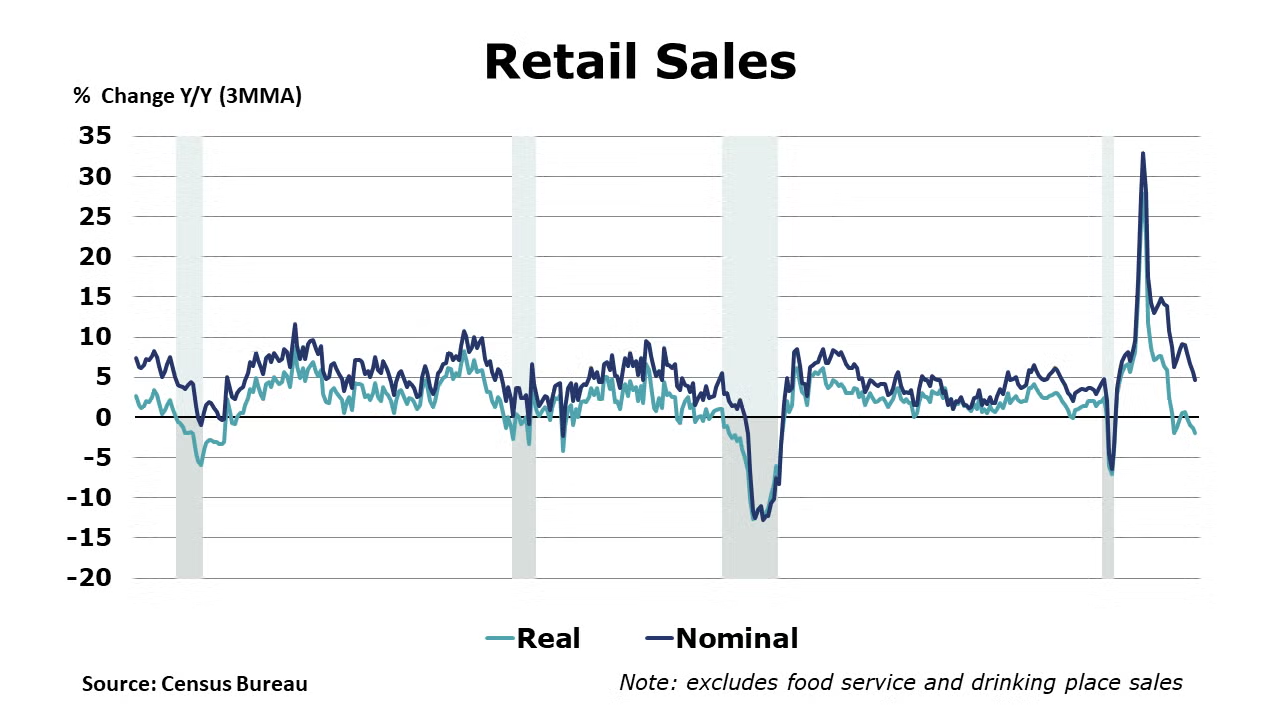
Advance estimates of U.S. retail and food services sales for January 2023 were $697.0 billion (on a SA basis), up 3.0% from the previous month, and up 6.4% Y/Y. Compared to December 2022, sales improved across nearly every category, with the largest gains in department store sales (up 17.5%), food services & drinking places (up 7.2%), and auto & other motor vehicle dealers (up 6.4%). Sales at gasoline stations were flat; no segments declined M/M. Compared to a year ago, sales at food services and drinking places were up 25.2% while sales at electronics & appliance stores were down 6.3%.
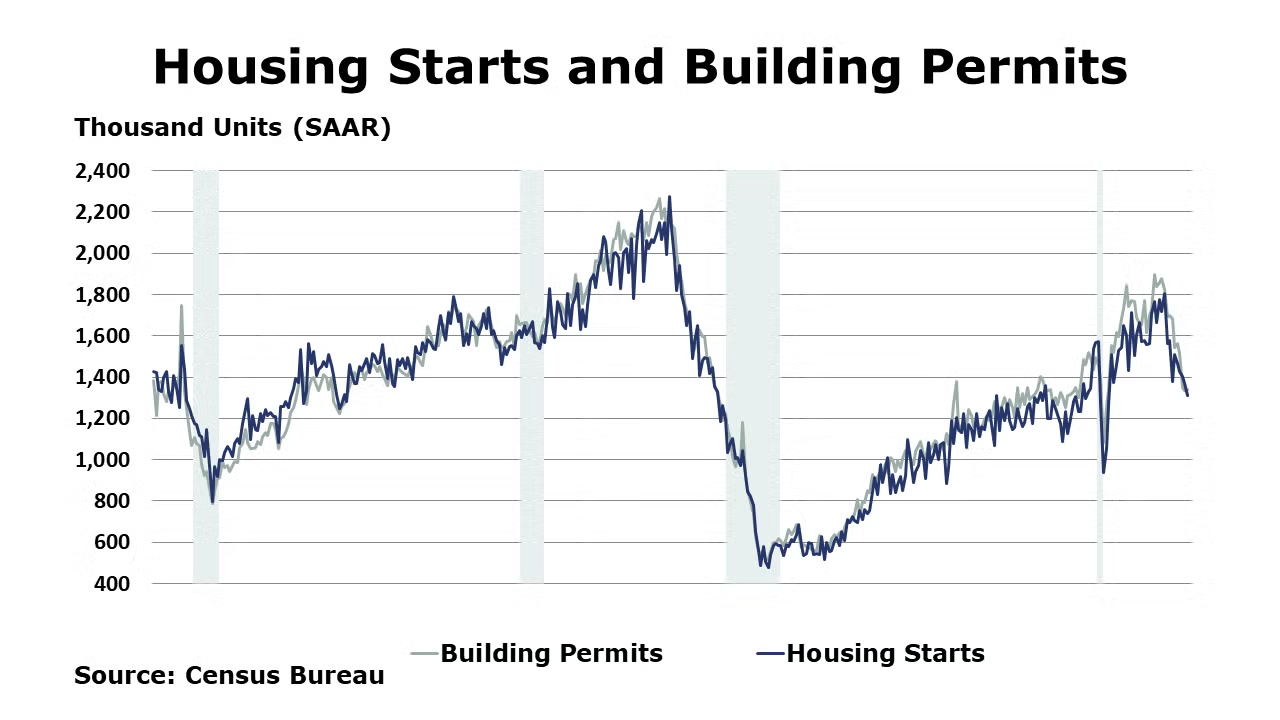
Housing starts fell by 4.5% in January to the lowest level since the pandemic lockdowns. It was the fifth monthly decline. Single‐family starts were down 4.3% with the largest declines in the South (down 7.1%) and Northeast (down 6.3%). Single-family starts were flat in the Midwest and up 3.7% in the West. Forward-looking building permits rose slightly (by 0.1%) in January but were down 27.3% Y/Y. The latest reading of the NAHB/Wells Fargo Housing Market Index, which is for February, was up 7 points to 42. The reading is still under the 50-mark but after many months of consecutive declines, the index has risen the past two months. Homebuilders are feeling relatively better about home sales currently and six months out. Prospective buyer traffic remains low but, has picked up over the past two months.
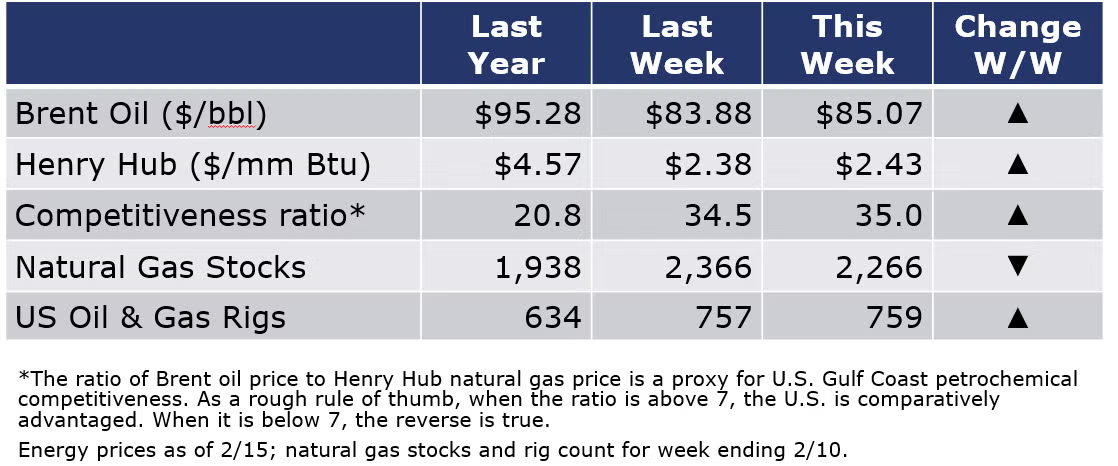
Oil prices moved higher during the week. Natural gas prices also rose though they remain below $2.50/mmbtu with continued unseasonably warm temperatures and consistently high supply. The competitiveness of U.S. natural gas-based chemistry has been enhanced. The combined oil and gas rig count rose by 2 to 759.
For the business of chemistry, the indicators brings to mind a yellow banner for basic and specialty chemicals.
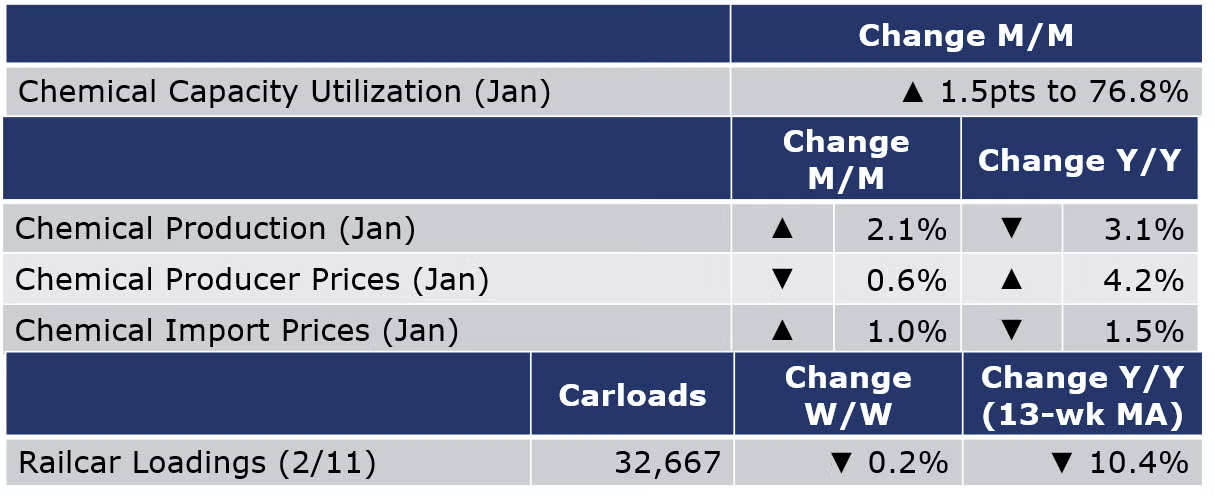
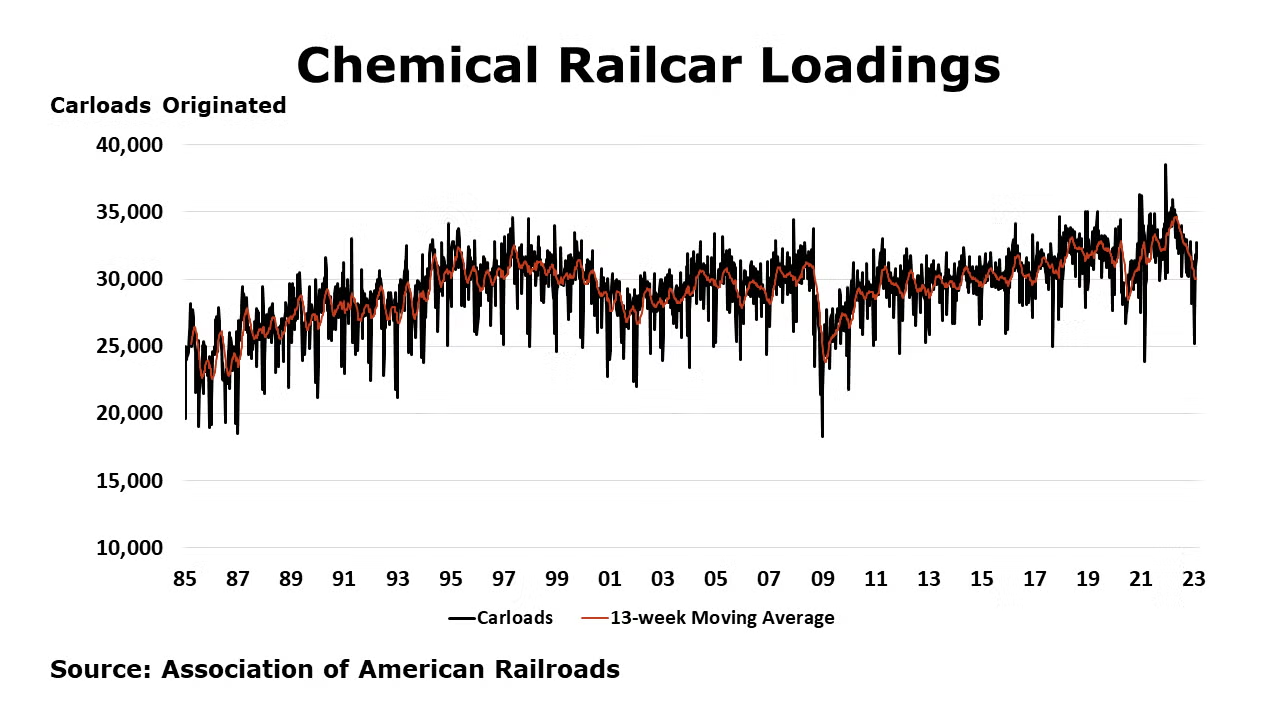
According to data released by the Association of American Railroads, chemical railcar loadings were down to 32,667 for the week ending February 11th. Loadings were down 10.4% Y/Y (13-week MA), down (9.1%) YTD/YTD and have been on the rise for 7 of the last 13 weeks.
Chemical production rose 2.1% in January and was up 3.1% Y/Y. Production increased in most segments except for synthetic rubber, fibers, and paint and coatings. Chemical capacity utilization rose 1.5 points to 76.8% in January. Capacity utilization levels were 81.2% the year before.
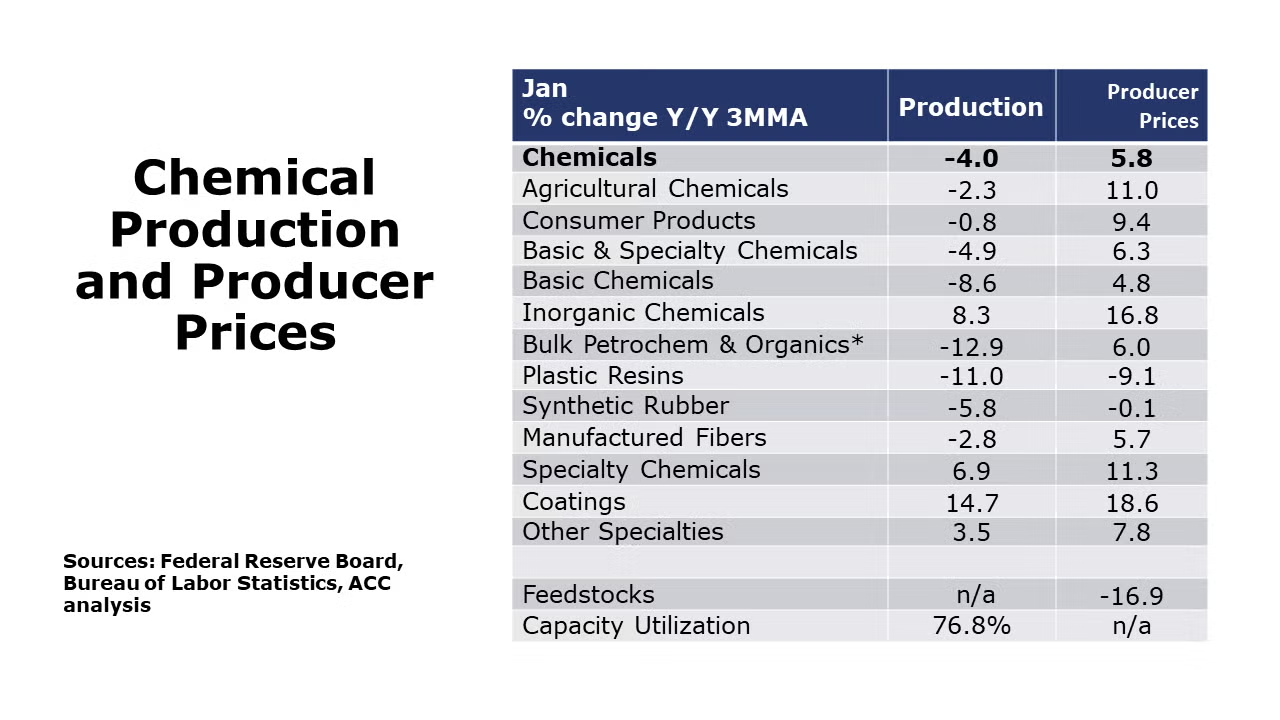
Chemical producer prices fell by 0.6% in January. Chemical producer prices have fallen for seven months straight but remain elevated and are up 4.2% Y/Y. Declining prices for agricultural chemicals, bulk petrochemicals & organics, plastic resins, synthetic rubber, and manufactured fibers offset higher prices for consumer products, inorganic chemicals, coatings, and other specialty chemicals.
Chemical import prices rose in January by 1.0% following five months in a row of declines. Import prices were down by 1.5% on a Y/Y basis. Chemical export prices declined by 1.8% in January. Exports prices have moderated steadily since August and were down 6.8% Y/Y.
Note On the Color Codes
The banner colors represent observations about the current conditions in the overall economy and the business chemistry. For the overall economy we keep a running tab of 20 indicators. The banner color for the macroeconomic section is determined as follows:
Green – 13 or more positives
Yellow – between 8 and 12 positives
Red – 7 or fewer positives
For the chemical industry there are fewer indicators available. As a result we rely upon judgment whether production in the industry (defined as chemicals excluding pharmaceuticals) has increased or decreased three consecutive months.
For More Information
ACC members can access additional data, economic analyses, presentations, outlooks, and weekly economic updates through MemberExchange.
In addition to this weekly report, ACC offers numerous other economic data that cover worldwide production, trade, shipments, inventories, price indices, energy, employment, investment, R&D, EH&S, financial performance measures, macroeconomic data, plus much more. To order, visit http://store.americanchemistry.com/.
Every effort has been made in the preparation of this weekly report to provide the best available information and analysis. However, neither the American Chemistry Council, nor any of its employees, agents or other assigns makes any warranty, expressed or implied, or assumes any liability or responsibility for any use, or the results of such use, of any information or data disclosed in this material.
Contact us at ACC_EconomicsDepartment@americanchemistry.com
