Running tab of macro indicators: 7 out of 20
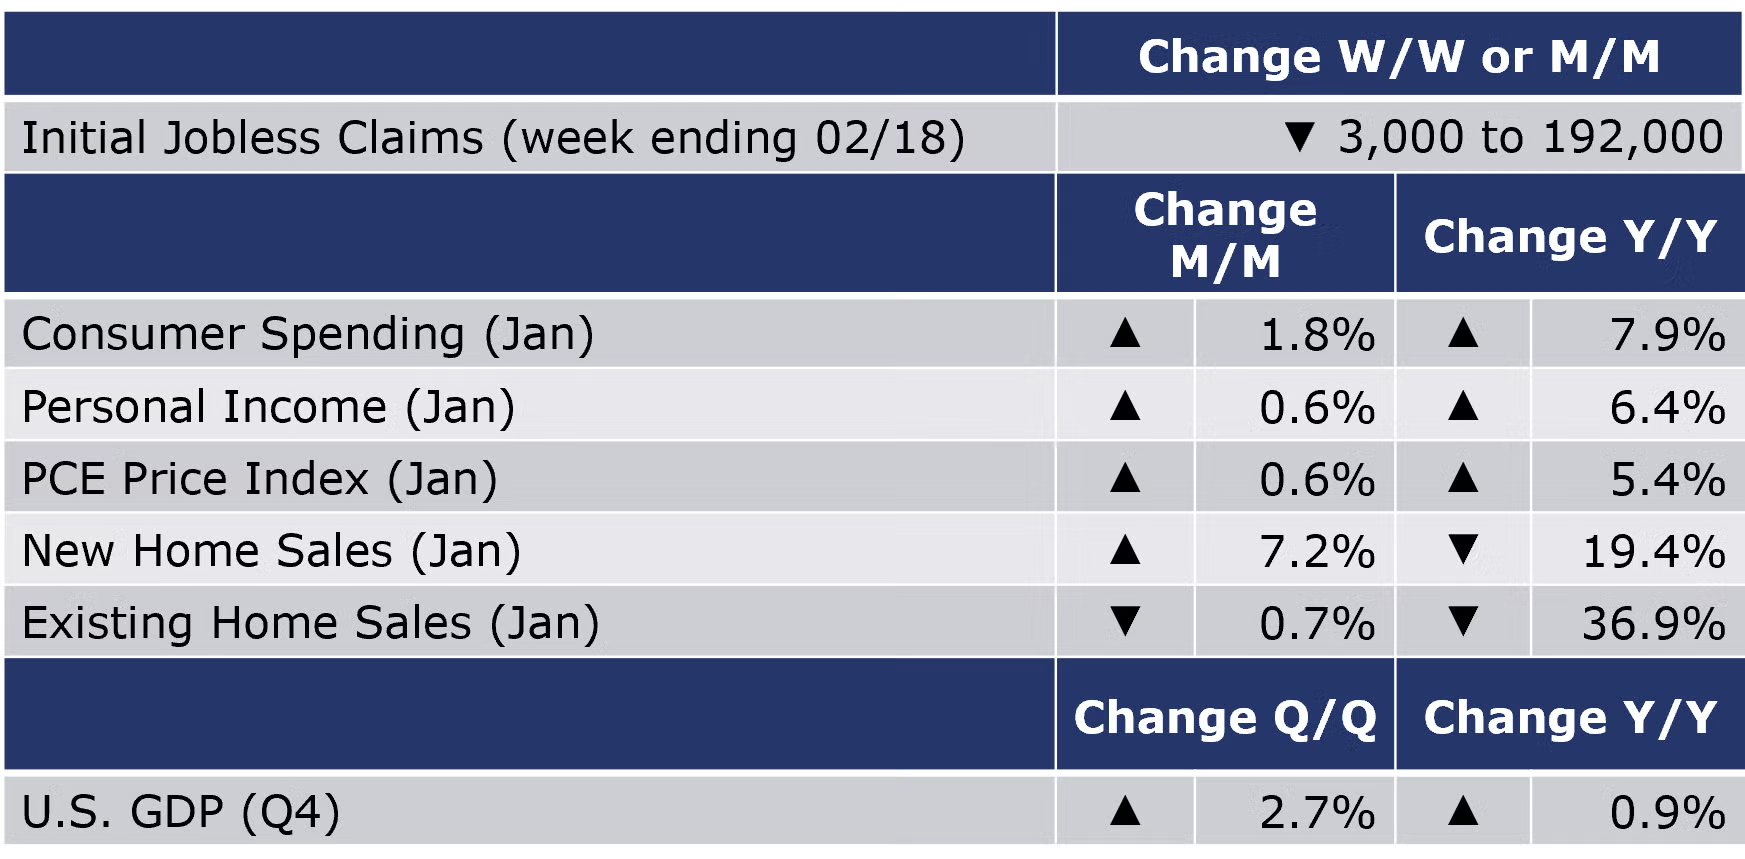
The number of new jobless claims decreased by 3,000 to 192,000 during the week ending 18 February. Continued claims were down 37,000 to 1.65 million for the February 11th week. The insured unemployment rate was 1.1%, a 0.1 percentage point down from the previous week's revised rate.
The BEA’s measure of consumer spending jumped 1.8% in January following two months of declines. It was the biggest gain in nearly two years and includes an uptick on spending on autos. The acceleration in spending reflects gains in both goods and services. Higher goods spending follows two months of decline. Consumer spending was up 7.9% Y/Y. Personal income, the aggregate spending power of the economy, continued to expand, up 0.6% with wages up 0.9% in January. Personal income was up 6.4% Y/Y. The personal savings rate (savings as a percent of after-taxes income) has been building the past 5 months and rose to a 4.7% annual rate of growth in January.
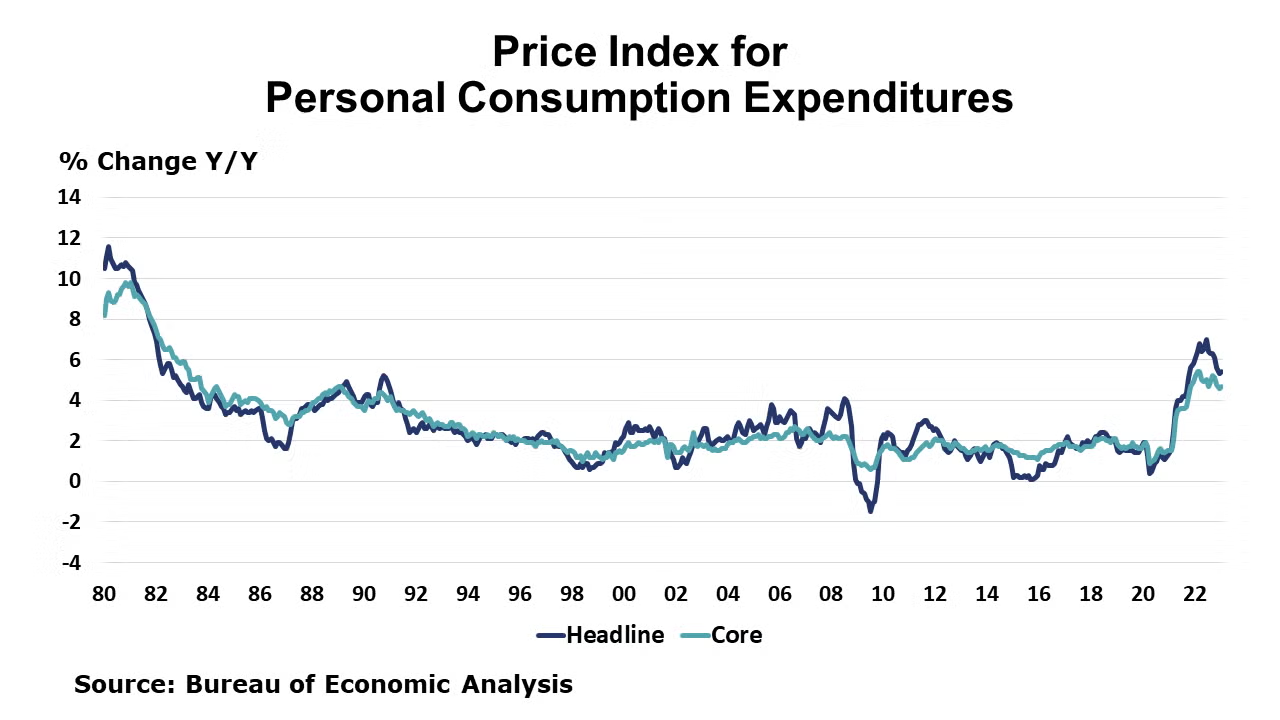
The personal consumption expenditures (PCE) price index rose 0.6% in January, the largest monthly gain since last June. Annual growth in the PCE price index, a measure of U.S. inflation the Federal Reserve watches closely, rose to 5.4% in January from 5.3%. Food and energy inflation continues to run hot with food prices up 11.1% Y/Y and energy goods and services up 9.6% Y/Y. Following several months of moderation the core PCE price index which strips out food and energy components, also rose, rising to a 4.7% pace of growth (from 4.6% in December). These most recent measures on U.S. inflation add pressure to the Fed to continue raising interest rates to bring inflation back down towards the 2% target.
Existing home sales fell 0.7% in January, which marks the 12th month of consecutive decline. Compared to a year ago, sales were off 36.9%. Existing home inventories grew at the end of January, but supply remained tight (2.9-months’). The median sales price was 1.3% higher than a year ago. Higher mortgage rates continue to negatively impact affordability for both first-time homebuyers and existing homeowners. Single-family home sales were down 0.8% in January, but existing condominium and co-op sales remained unchanged.
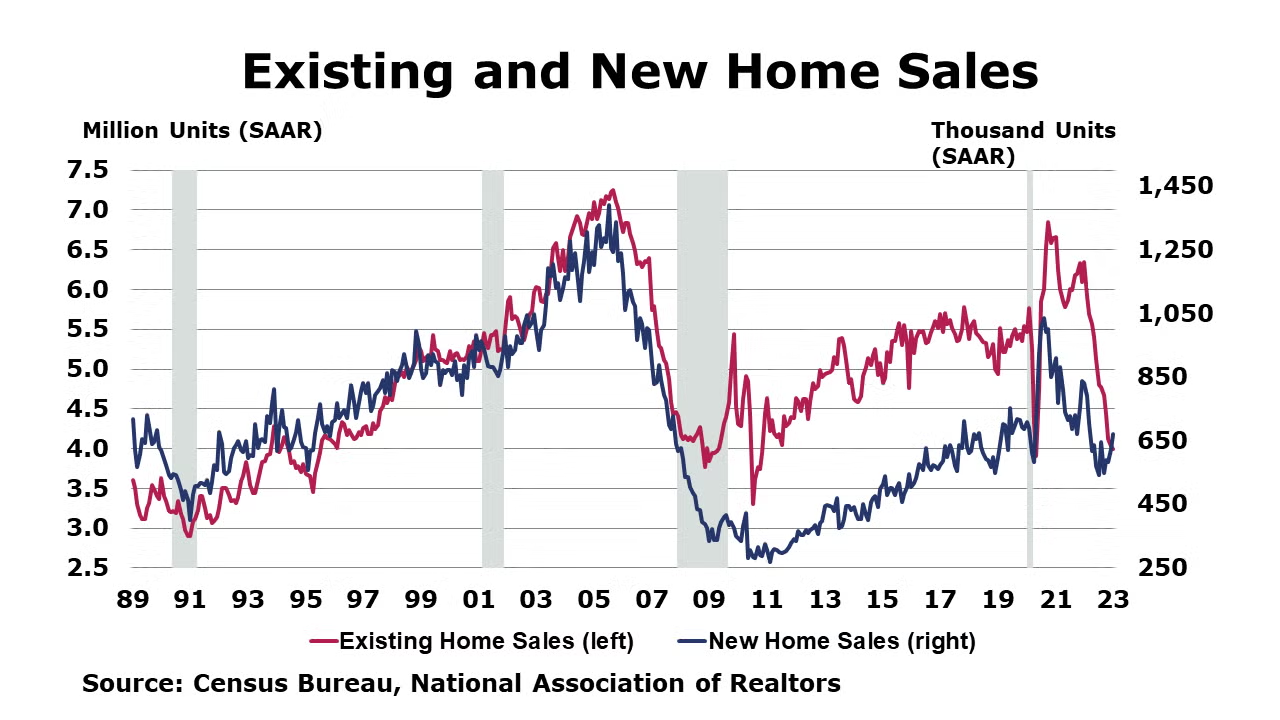
New home sales increased in January by 7.2%, compared to the same month last year although year-over-year sales remained lower by 19.4%. Higher sales in the south offset the declines in the northeast, mid-west and west regions. The number of new homes available for sale at the end of January was lower than the previous month. The inventory of new homes sat at 7.9%, lower than 8.7% in December and the 2022 peak (10.1%) in September.
In its second of three estimates, the BEA reported that Q4 U.S. GDP expanded at a 2.7% seasonally adjusted annual rate, lower than the 2.9% gain in last month’s “advance” estimate. The second estimate primarily reflected downward revisions to consumer spending and a wider trade deficit offsetting the upward revision in gross investment and private inventory. Compared to Q42021, U.S. GDP was up 0.9% Y/Y. The PCE price index increased by 4.3%, an upward revision of 0.4 percentage points.
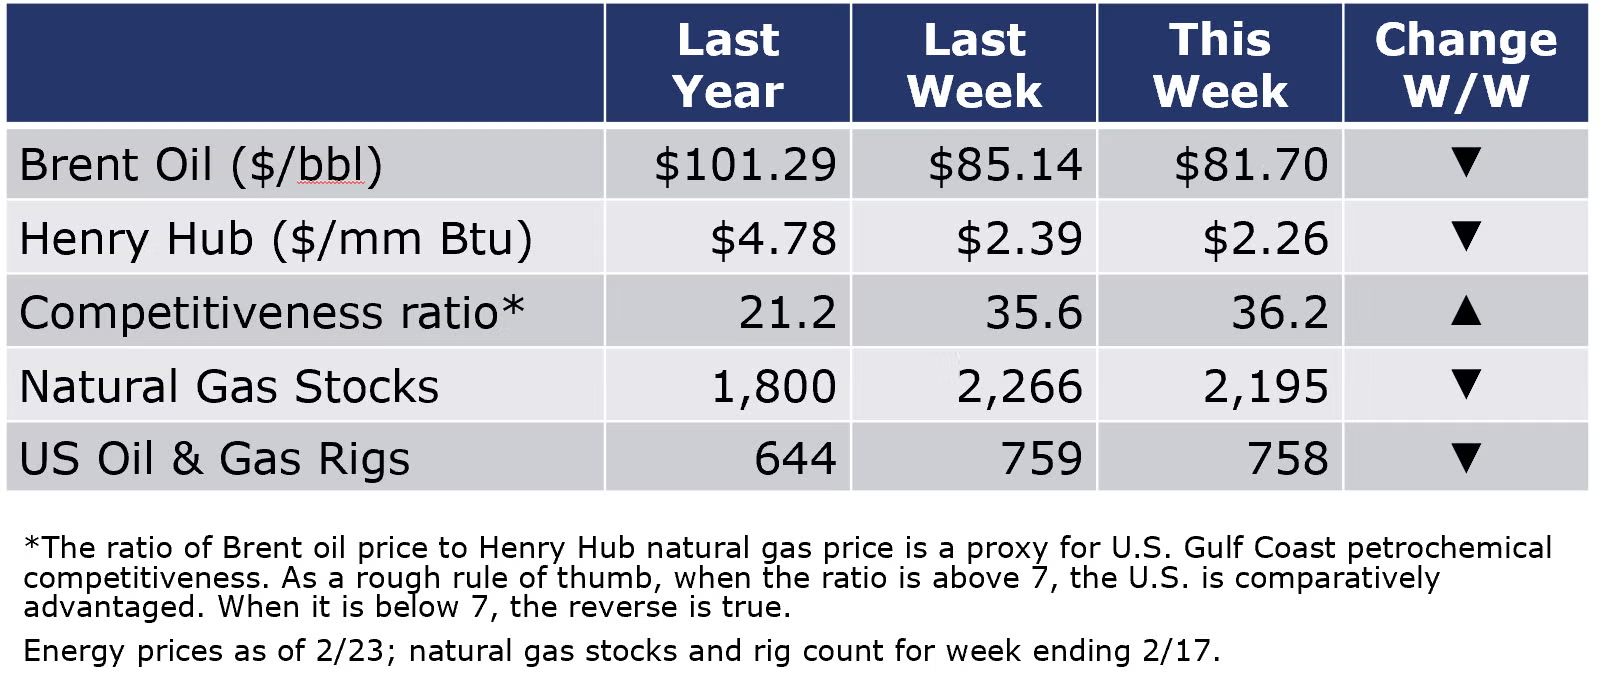
Oil prices firmed at $81.70 on Thursday after Brent crude posted its biggest one-day loss for seven weeks in the previous session. U.S. natural gas prices were down to $2.26 this week (compared to $2.39 last week and $4.78 last year). The combined oil and rig count was about the same as the week before at 758 during the week ending 2/17.
For the business of chemistry, the indicators brings to mind a yellow banner for basic and specialty chemicals.
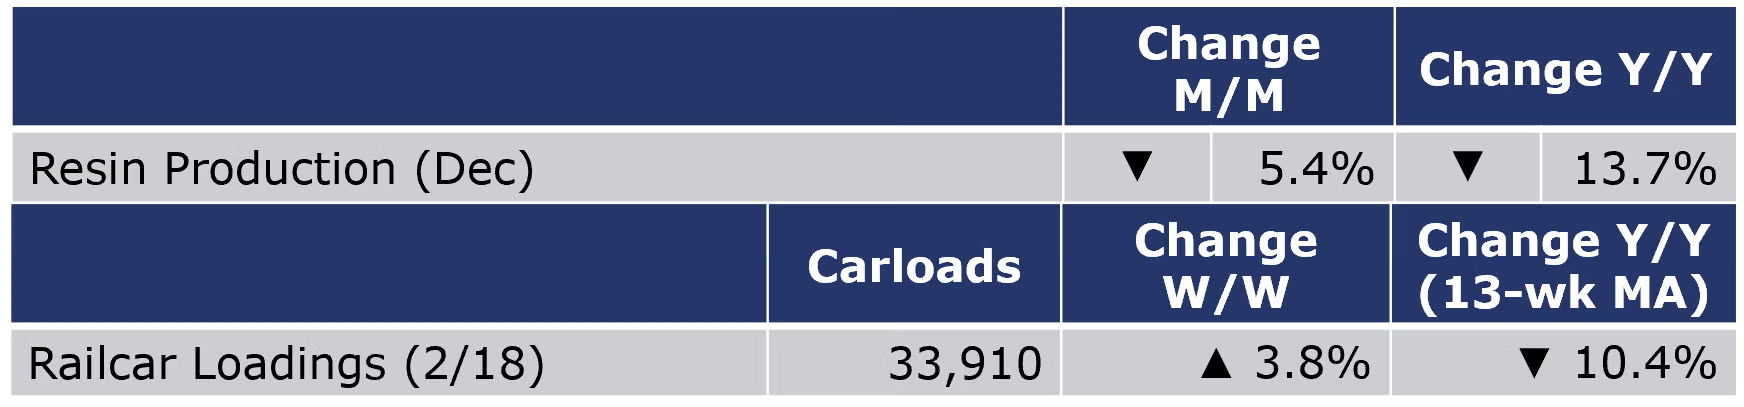

According to data released by the Association of American Railroads, chemical railcar loadings were up 3.8% to 33,910 during the week ending 18 February. Loadings were down 10.4% Y/Y (13-week MA), down 8.4% YTD/YTD and have been on the rise for eight of the last 13 weeks.
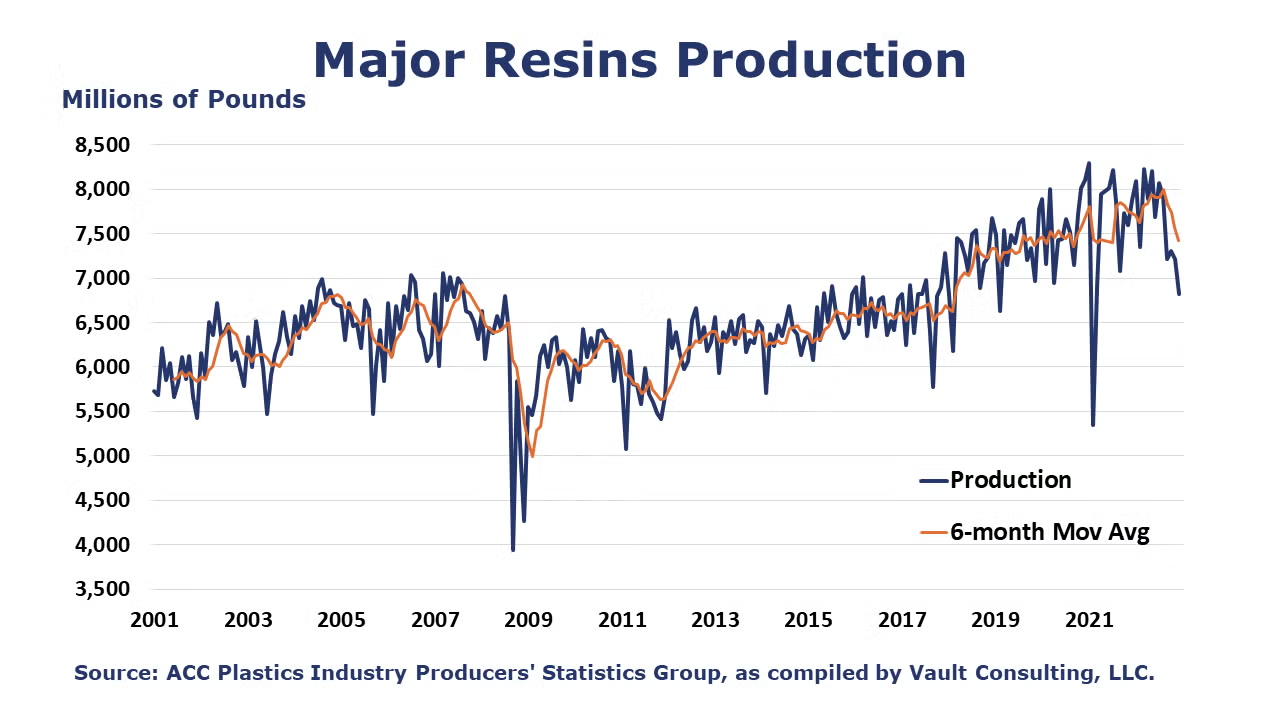
U.S. production of major plastic resins totaled 6.8 billion pounds during December 2022, a down 5.4% M/M, and down 13.7% Y/Y, according to statistics released by ACC. For the year as a whole, production was 92.1 billion pounds, a level up 1.2% Y/Y. Sales and captive (internal) use of major plastic resins was 7.4 billion pounds, down 1.3% M/M and down 4.1% Y/Y. At the end of 2022, total sales were 92.4 billion pounds, up 3.5% compared to 2021.
Note On the Color Codes
The banner colors represent observations about the current conditions in the overall economy and the business chemistry. For the overall economy we keep a running tab of 20 indicators. The banner color for the macroeconomic section is determined as follows:
Green – 13 or more positives
Yellow – between 8 and 12 positives
Red – 7 or fewer positives
For the chemical industry there are fewer indicators available. As a result we rely upon judgment whether production in the industry (defined as chemicals excluding pharmaceuticals) has increased or decreased three consecutive months.
For More Information
ACC members can access additional data, economic analyses, presentations, outlooks, and weekly economic updates through MemberExchange.
In addition to this weekly report, ACC offers numerous other economic data that cover worldwide production, trade, shipments, inventories, price indices, energy, employment, investment, R&D, EH&S, financial performance measures, macroeconomic data, plus much more. To order, visit http://store.americanchemistry.com/.
Every effort has been made in the preparation of this weekly report to provide the best available information and analysis. However, neither the American Chemistry Council, nor any of its employees, agents or other assigns makes any warranty, expressed or implied, or assumes any liability or responsibility for any use, or the results of such use, of any information or data disclosed in this material.
Contact us at ACC_EconomicsDepartment@americanchemistry.com