Running tab of macro indicators: 6 out of 20
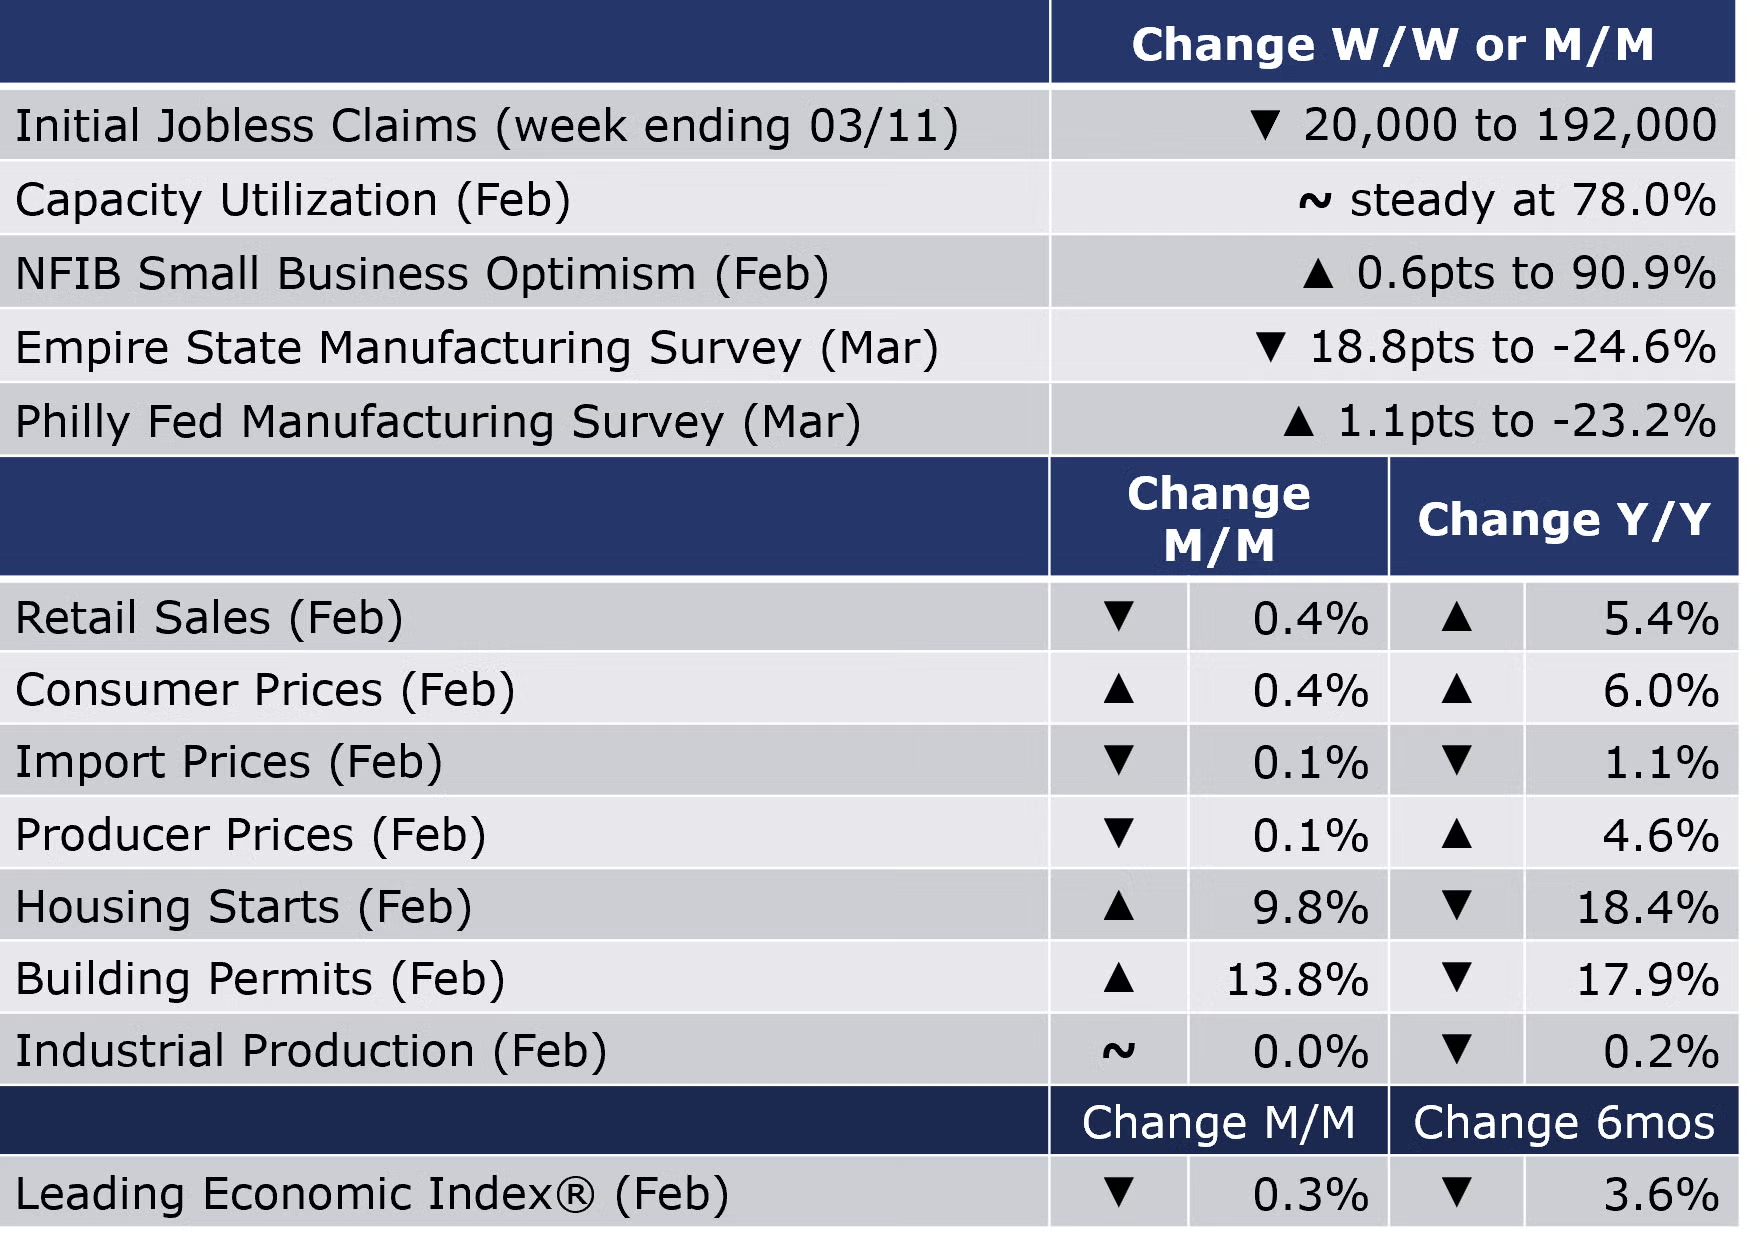
The number of new jobless claims fell by 20,000 to 192,000 during the week ending 11 March. Continuing claims decreased by 29,000 to 1.68 million, and the insured unemployment rate for the week ending 4 March was 1.2%, unchanged from the week prior.
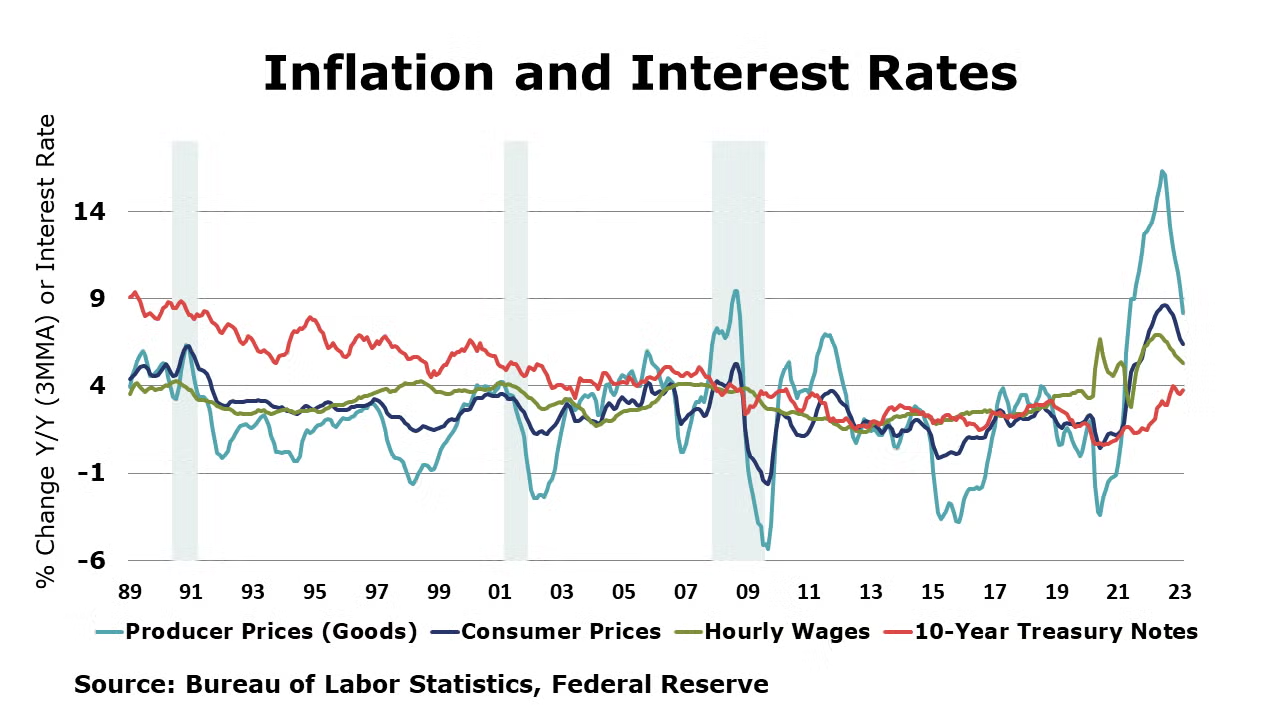
The pace of inflation growth continued to ease in February. Consumer prices rose by 0.4% in February and were up 6.0% from a year ago. Excluding the volatile food and energy components, core consumer prices were up 5.5% Y/Y. Both annual measures were their lowest since the latter part of 2021. The price index for shelter (including rent, lodging, and owners’ equivalent rent) was the largest contributor to the monthly increase in the headline index, accounting for over 70% of the increase. The indices for food, recreation, and household furnishings and operations also contributed to the gain. Headline producer prices edged lower by 0.1% in February as lower prices for food (led by a sharp drop in egg prices), energy, transportation services, and trade services declined offsetting continue price increases in core goods and other services. As with consumer prices, the pace of annual inflation growth slowed with a 4.6% Y/Y gain in headline producer prices and a 4.4% Y/Y gain in core producer prices. Import prices edged down 0.1% in February, pulled by lower fuel prices (natural gas was down 55.6% month/month). Except for a small blip in December, import prices have been moving down since last June and have decreased 1.1% over 12 months. Export prices rose 0.2% in February and have declined 0.8% over 12 months.
The NFIB Small Business Optimism Index increased 0.6 points in February to 90.9 but remains below the 49-year average of 98. Nearly half (47%) of owners reported job openings they could not fill and 20% reported that supply chain disruptions still have a “significant impact” on their business.
Advance estimates of U.S. retail and food services sales for February 2023 were down 0.4% from the previous month, and up 5.4% Y/Y. Compared to January, sales declined across nearly every category. Among the gains were sales at health and personal care stores (up 1%), general merchandise stores (up 1%), and non-store retailers (up 2%). Compared to a year ago, sales at food services and drinking places were up 15.3% while sales at electronics & appliance stores were down 2.8%.
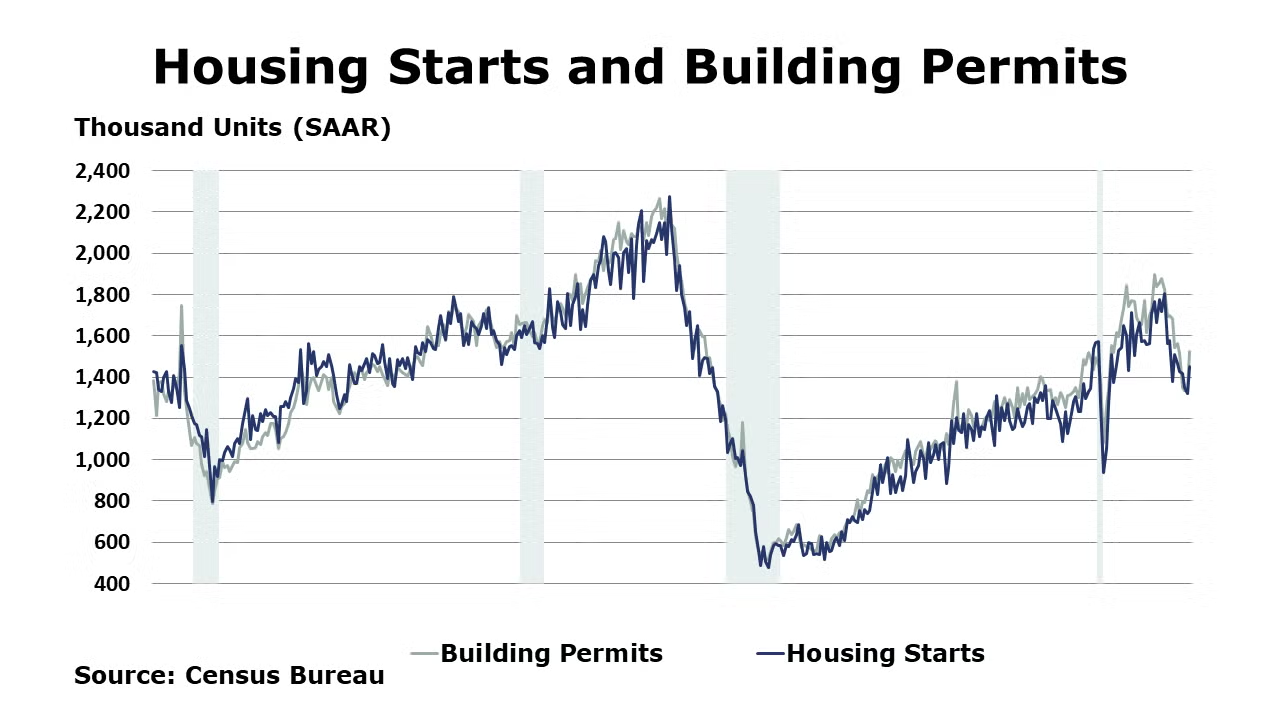
Seasonally adjusted housing starts surged in February, up by 9.8% following five consecutive months of decline. Chemistry-intensive single family starts rose by 1.1%. Relatively mild weather across much of the U.S. likely boosted homebuilding activity. Forward-looking building permits also rose, up 13.8%. Both starts and permits remained sharply lower than a year ago. The data are welcome news, however one month does not yet indicate a trend. Homebuilders were less pessimistic in February as the composite NAHB/Wells Fargo Housing Market Index rose two points to 44. A reading below 50 continues to suggest that the overall environment for homebuilding remains weak, however. Gains in current conditions and traffic were partially offset by a slight deterioration in expectations.
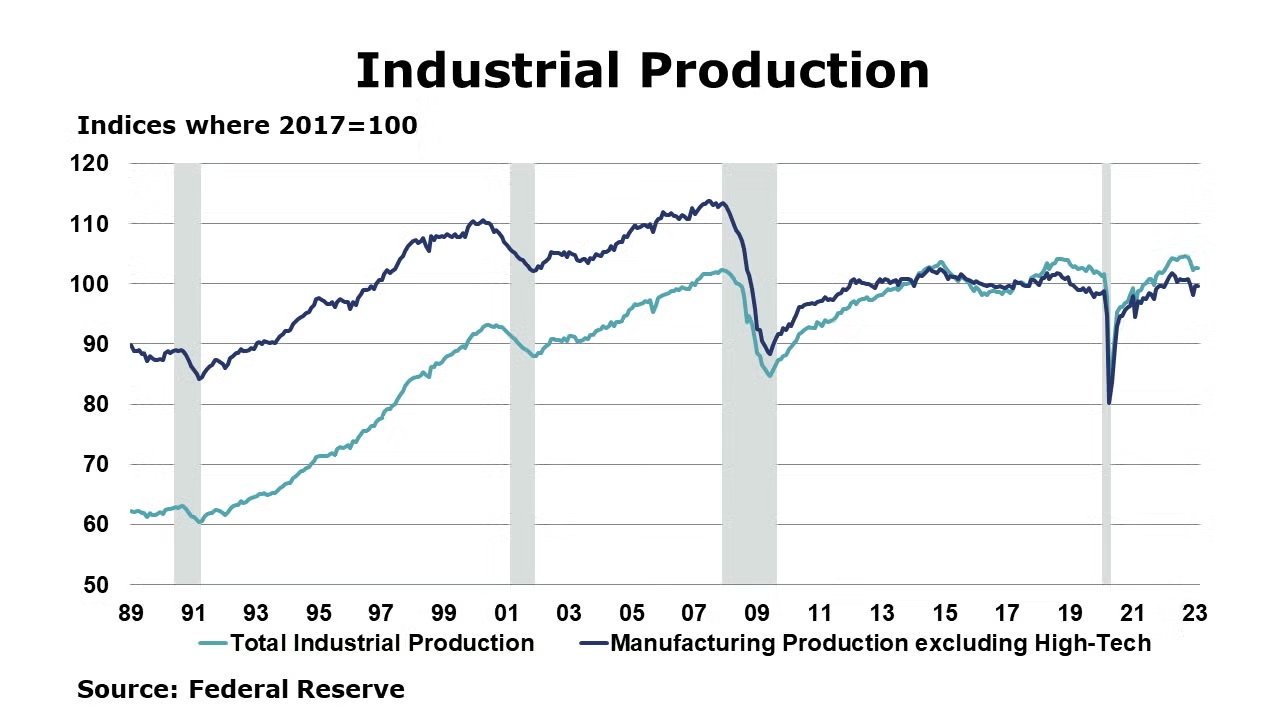
Headline industrial production was flat in February, following a 0.3% gain in January. Mining output was lower, but manufacturing output edged up (by 0.1%) following January’s partial rebound from December’s large decline. Performance among individual sectors was mixed. The largest output gains were in wood products, computers & electronics, electrical equipment & appliances, and chemicals. These gains were offset by losses in several sectors, including textiles, plastic & rubber products, paper, and nonmetallic mineral products. Capacity utilization remained steady at 78.0%, however capacity was 1.6% higher than a year earlier.
The Philadelphia Federal Reserve reported manufacturing activity in the region continued to decline overall. The general business conditions index remained negative but ticked up 1.1 points to -23.2 in February. This index has been negative since September 2022. The future business conditions index dropped 10 points to -8.0 in March as manufacturers signaled subdued expectations for growth over the next six months.
The Empire State Manufacturing Survey (reflecting conditions in New York state) for suggests business conditions continued to deteriorate for manufacturers in that region in March as the general business conditions index dropped 18.8 points to -24.6. New orders declined significantly, shipments declined modestly, and inventories were flat. Looking forward, the region’s manufacturers do not anticipate improvement in business conditions over the coming six months.
Dropping for the eleventh straight month, the latest read of the Conference Board’s Leading Economic Index® signals a U.S. recession in the near term. The LEI declined 0.3% in February and has declined 3.6% over the past 6 months – a comparison that has steepened.
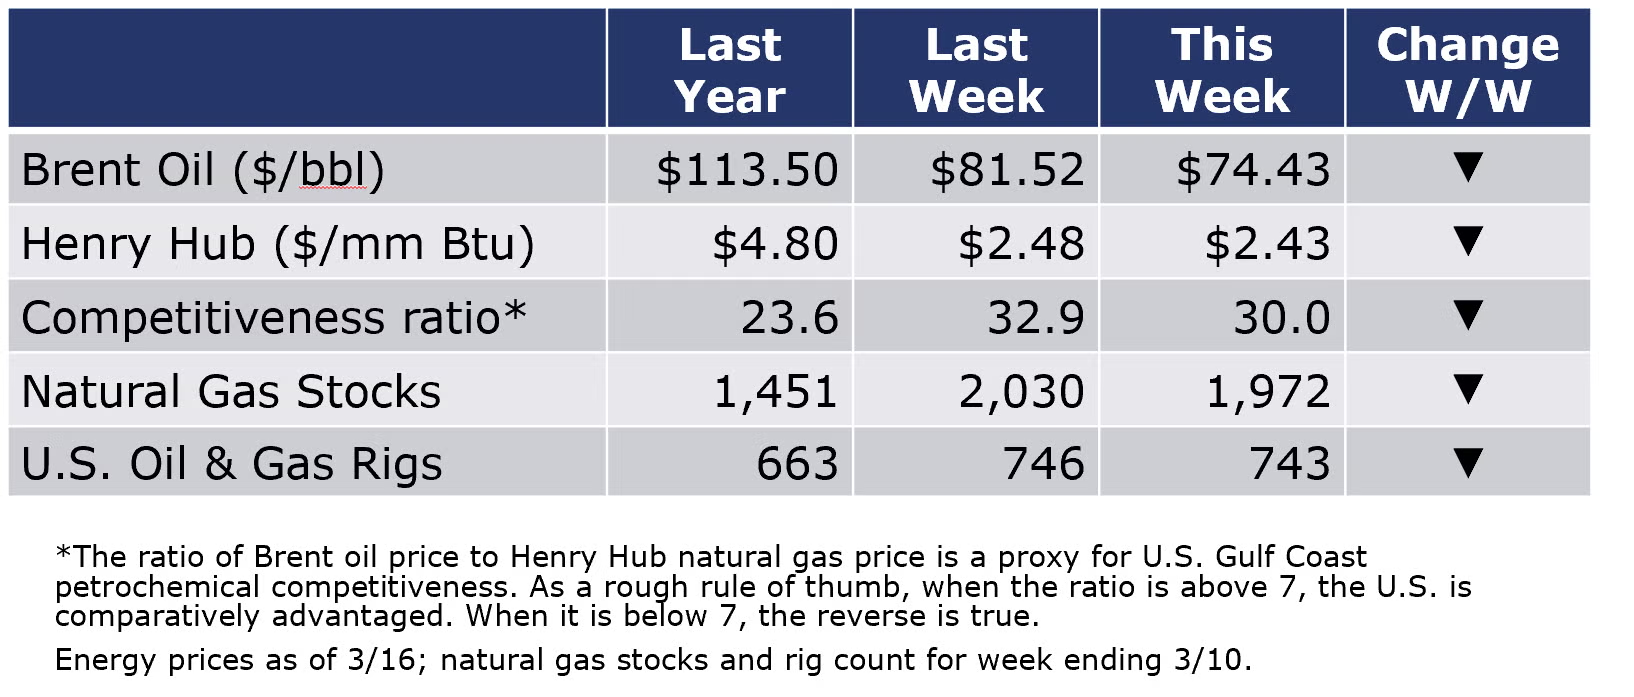
The combined oil and gas rig count moved lower (by 3) for the week ending 10 March. Oil prices also moved lower this week as the fallout from the recent banking turmoil continues to create uncertainty about financial conditions. Natural gas futures remained mostly stable as milder weather appears to be on the horizon for the next several weeks. Gas prices are half of what they were a year ago and U.S. inventories have more than caught up (after nearly a year of being lower than average) thanks to the mild winter.
For the business of chemistry, the indicators brings to mind a yellow banner for basic and specialty chemicals.
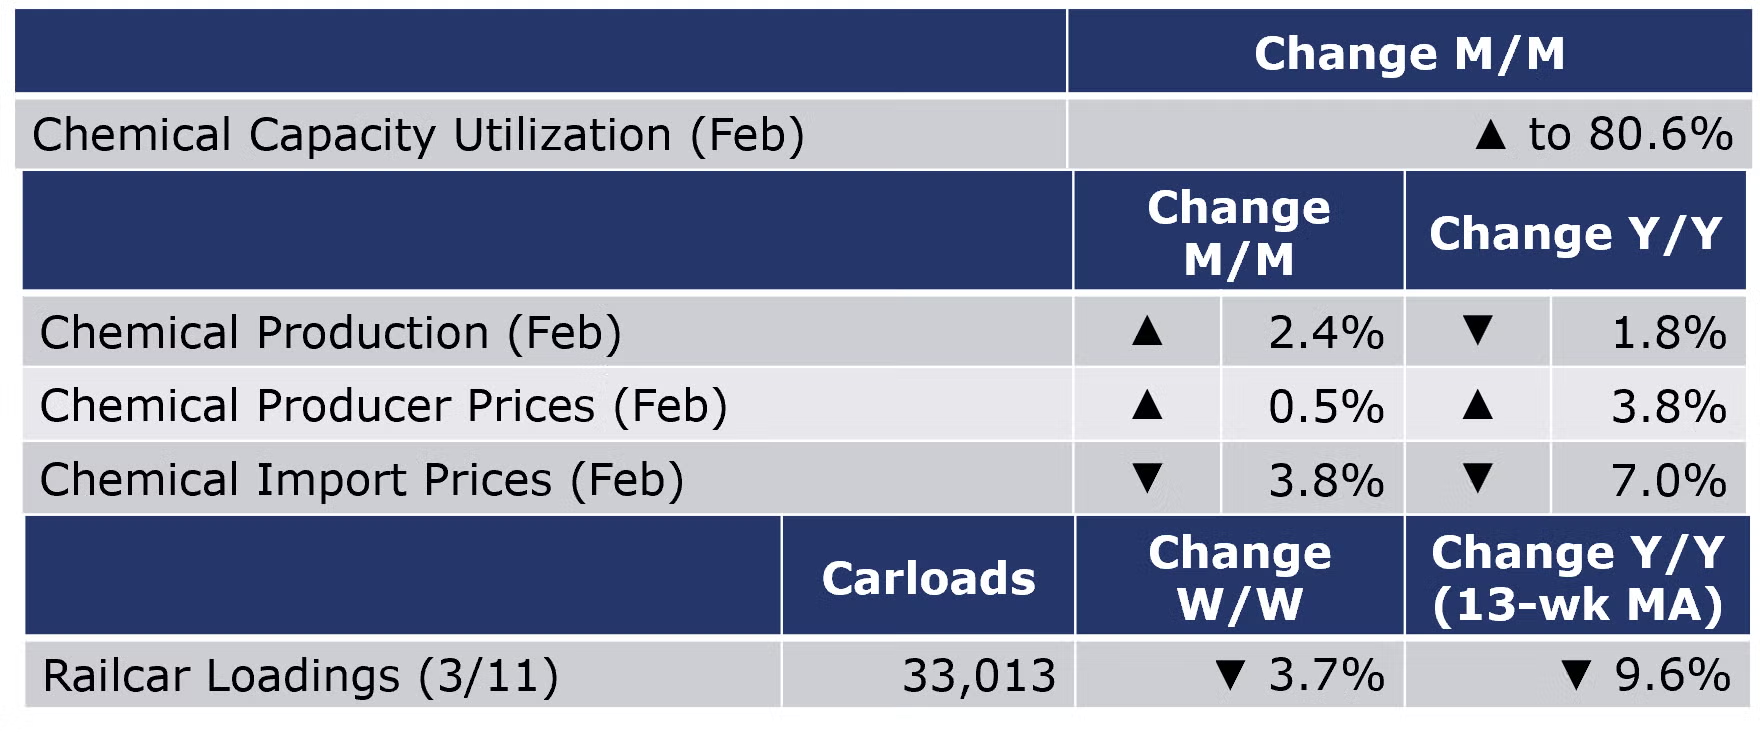
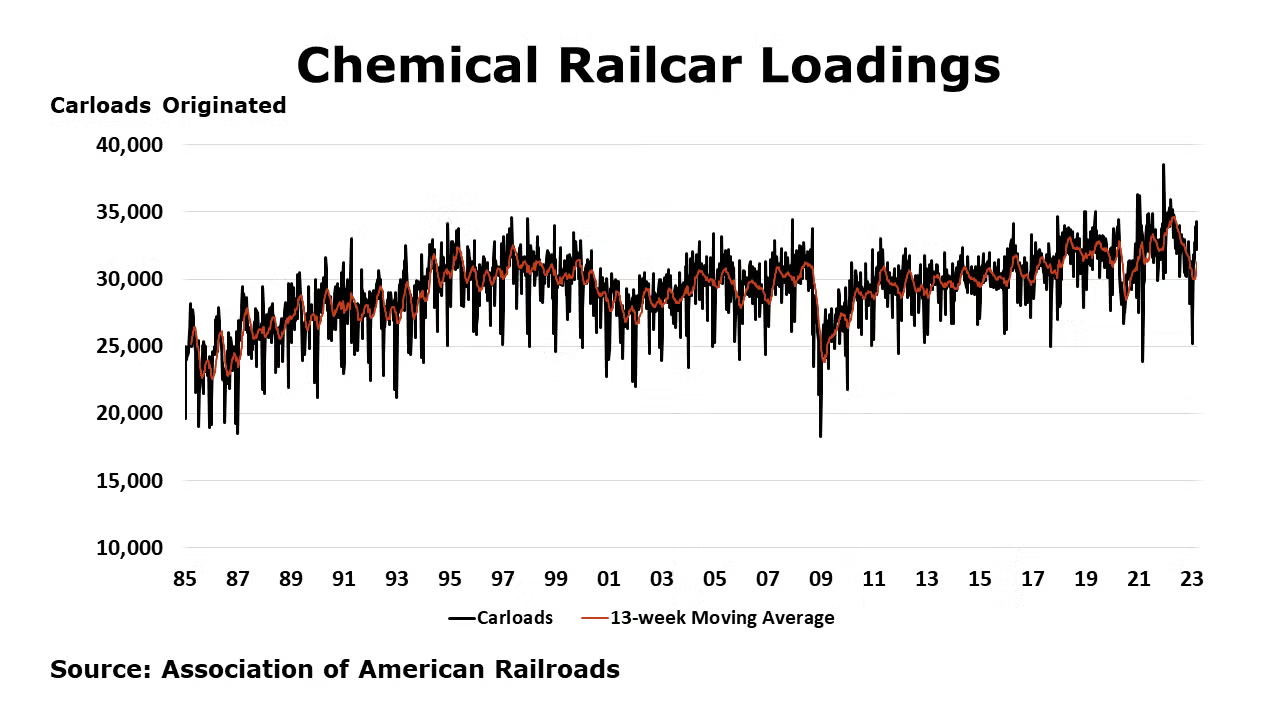
According to data released by the Association of American Railroads, chemical railcar loadings were down to 33,013 for the week ending March 11. Loadings were down 8.1% Y/Y (13-week MA), down (7.4%) YTD/YTD and have been on the rise for 9 of the last 13 weeks.
Chemical production continued to rebound in February, up 2.4% and following an upwardly revised 4.9% gain in January according to the Federal Reserve. The previous two months’ gains come after six consecutive monthly declines including a sharp drop in December related to disruptions from winter storm Elliott. There were monthly gains across all categories, except inorganic chemicals. Capacity utilization tightened in February, up to 80.6%. Both production and capacity utilization were below year ago levels.
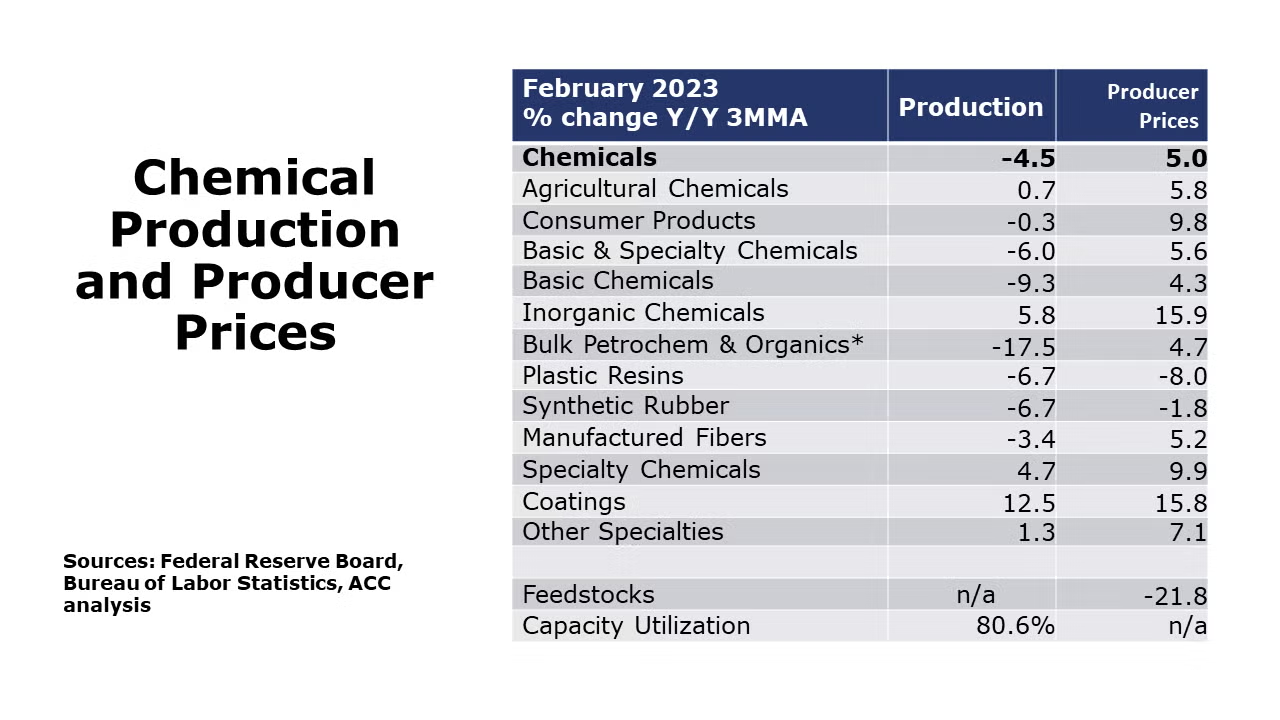
Chemical producer prices rose 0.5% in February, the first monthly increase in the past eight months. Higher prices for plastic resins, inorganic chemicals, consumer products, and other specialty chemicals offset declines in organic chemicals, synthetic rubber, coatings, and agricultural chemicals. Chemical prices were up 3.8% Y/Y.
Chemical import prices fell 3.8% in February and were down 7.0% Y/Y. At the same time chemical export prices edged up 0.5% but were down 5.9% Y/Y.
Note On the Color Codes
The banner colors represent observations about the current conditions in the overall economy and the business chemistry. For the overall economy we keep a running tab of 20 indicators. The banner color for the macroeconomic section is determined as follows:
Green – 13 or more positives
Yellow – between 8 and 12 positives
Red – 7 or fewer positives
For the chemical industry there are fewer indicators available. As a result we rely upon judgment whether production in the industry (defined as chemicals excluding pharmaceuticals) has increased or decreased three consecutive months.
For More Information
ACC members can access additional data, economic analyses, presentations, outlooks, and weekly economic updates through MemberExchange.
In addition to this weekly report, ACC offers numerous other economic data that cover worldwide production, trade, shipments, inventories, price indices, energy, employment, investment, R&D, EH&S, financial performance measures, macroeconomic data, plus much more. To order, visit http://store.americanchemistry.com/.
Every effort has been made in the preparation of this weekly report to provide the best available information and analysis. However, neither the American Chemistry Council, nor any of its employees, agents or other assigns makes any warranty, expressed or implied, or assumes any liability or responsibility for any use, or the results of such use, of any information or data disclosed in this material.
Contact us at ACC_EconomicsDepartment@americanchemistry.com

