Running tab of macro indicators: 8 out of 20
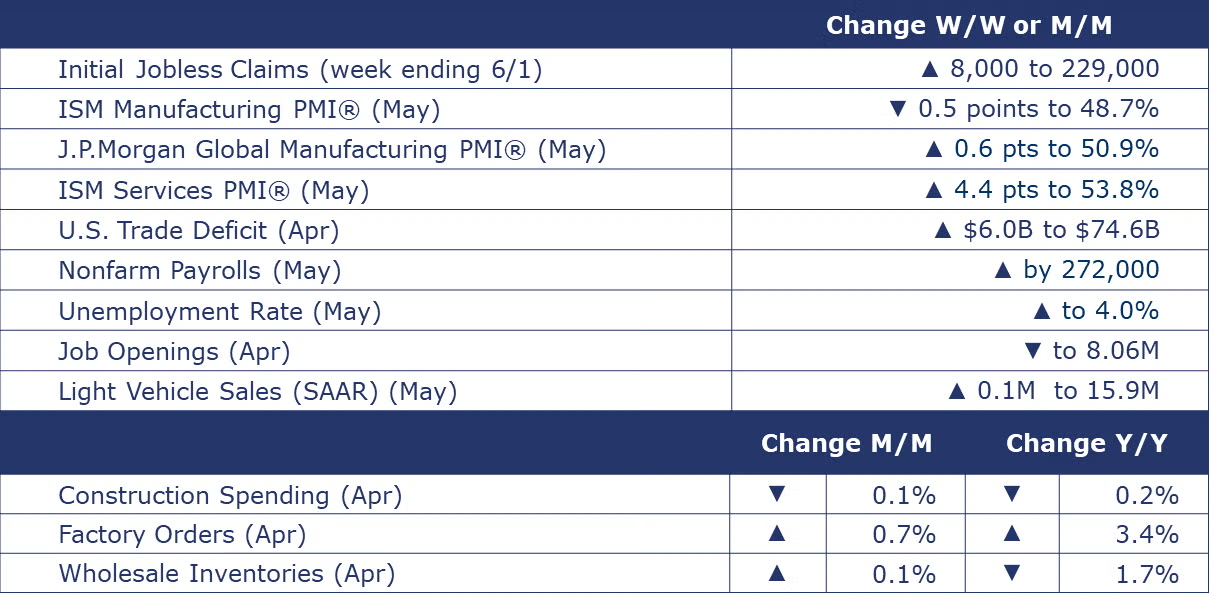
The number of new jobless claims rose by 8,000 to 229,000 during the week ending June 1. Continuing claims increased by 2,000 to 1.792 million, and the insured unemployment rate for the week ending May 25 was unchanged at 1.2%.
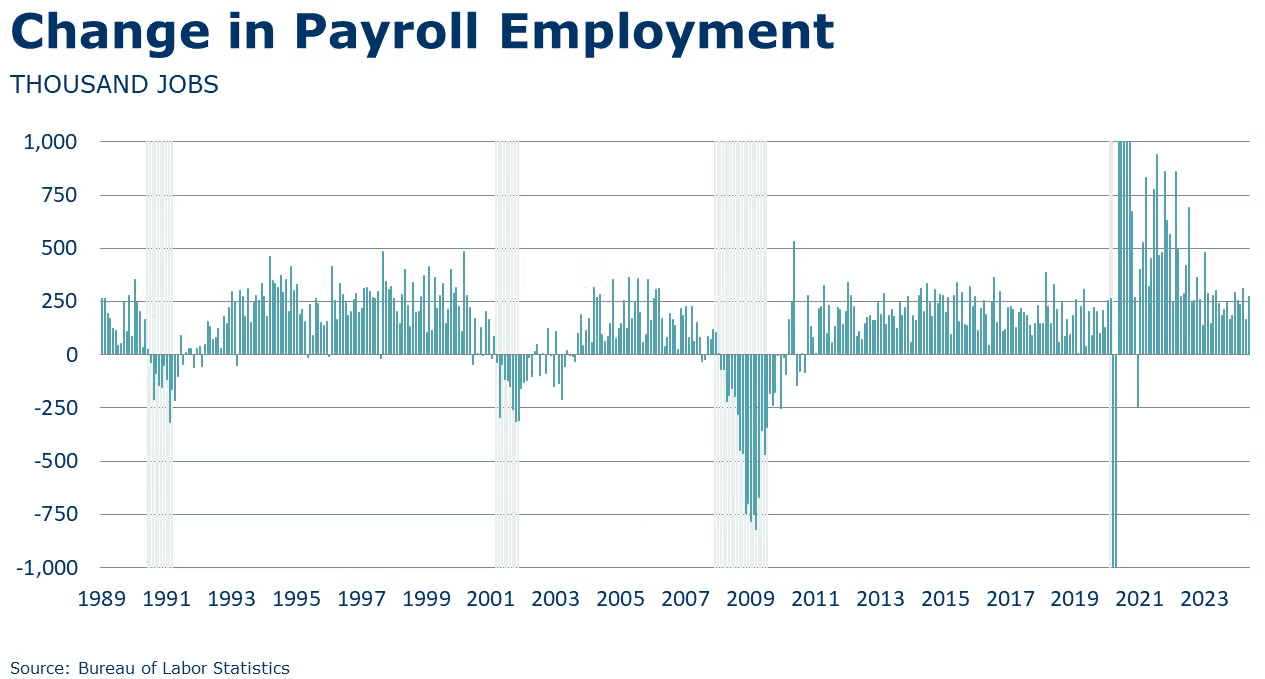
Following slower job growth in April, growth in nonfarm payrolls (from the establishment survey) accelerated in May, up by 272,000. As usual, the largest gains were in the services sector, however manufacturing employment expanded by 8,000 and construction employment expanded by 21,000. A bellwether for labor market trends, employment in temporary help services continued to fall for a fourth consecutive month. Average hourly earnings for all employees rose at a 4.1% annual rate, slightly higher than in April. With wages growing faster than inflation, real incomes continued to rise, allowing households to continue to spend. From the household survey, the number of employed people fell faster than the decline in the labor force. As a result, the unemployment rate ticked higher to 4.0%, the highest rate since January 2022. It’s not uncommon for the employment data from the household and establishment surveys to diverge, especially around turning points.
Light vehicle sales continued to move higher in May, up by 0.1 million to a 15.9 million seasonally adjusted annual rate (SAAR). There were gains in sales of both autos and light trucks. Despite demand for vehicles, a good labor market, and greater availability, high prices and borrowing costs have continued to be a bit of a headwind.

Construction spending fell 0.1% in April as declines in nonresidential projects offset higher spending in the residential sector.
Following a brief visit above the neutral mark in March, the ISM Manufacturing PMI® eased for a second consecutive month in May, down by 0.5 points to 48.7%. A reading below 50 indicates a contraction in U.S. manufacturing activity. Production, employment, and export orders expanded, but new orders and order backlogs contracted. Imports were higher. Inventories contracted and customer inventories were deemed to be “too low”. Supplier deliveries were reported to be faster and prices increased at a slower pace. Seven industries (including chemical products) reported expansion while seven reported contraction.
The J.P.Morgan Global Manufacturing PMI® rose 0.6 points to 50.9 in May. It was the fourth consecutive reading over the 50-mark following 16 months of contraction. Output grew at a faster rate with strengthening noted for the US, China, and the UK and contraction easing in Japan and the euro area. New orders grew though export orders growth was at a slower rate. Sentiment on future output was improved with growth expected. Employment nudged into expansion. Input cost and selling price inflation strengthened.
Factory orders rose again in April, up another 0.7%. There were strong gains in orders for consumer durable goods, computers & ICT goods, motor vehicles and defense capital goods. A proxy for core business investment, orders for nondurable goods, excluding aircraft, were up by 0.2%, erasing last month’s 0.2% decline. Headline factory orders were up 3.4% Y/Y, while core business investment orders were up 2.9% Y/Y. Unfilled orders continued to expand slowly (up 0.2%), with a gain in consumer durable goods. Factory shipments also rose in April, up by 1.0% with broad gains across most major categories. Inventories ticked slightly higher, up by 0.1%, with a build in capital goods inventories offsetting declines in other categories. Compared to a year ago, inventories were 0.3% higher, while shipments were up by 5.7% Y/Y. The inventories-to-shipments ratio continued to ease from 1.47 in March to 1.45 in April, its lowest reading in nearly two years (June 2022).
Wholesale inventories rose by 0.1% in April. The largest gains in inventories occurred in autos, machinery, and pharmaceuticals. Inventory declines were largest in farm products, apparel, and groceries. Sales at the wholesale level rose 0.1%, following a 1.3% decline in March. The largest gains in sales were in professional equipment (including computers), pharmaceuticals and autos. Compared to a year ago, sales were higher by 1.4% while inventories were off 1.7% Y/Y. The inventories-to-sales ratio was unchanged at 1.35 in April. A year ago, the ratio was 1.39.
Following a reading below 50 in April, ISM’s Services PMI® rose 4.4 percentage points to 53.8 in May, the 46th gain in the past 48 months. Services activity was higher and new orders grew faster. Labor related challenges persist with difficulties backfilling positions and controlling labor expenses.
The U.S. trade deficit in goods and services rose by 8.7% in April to $74.6 billion as gains in imports exceeded gain in exports. U.S. goods exports rose driven by pharmaceuticals, capital goods including electric apparatus, industrial machinery, and semiconductors. Exports of industrial supplies and materials fell in April. Goods imports also increased driven by cars, computer accessories, telecoms equipment, and crude oil.
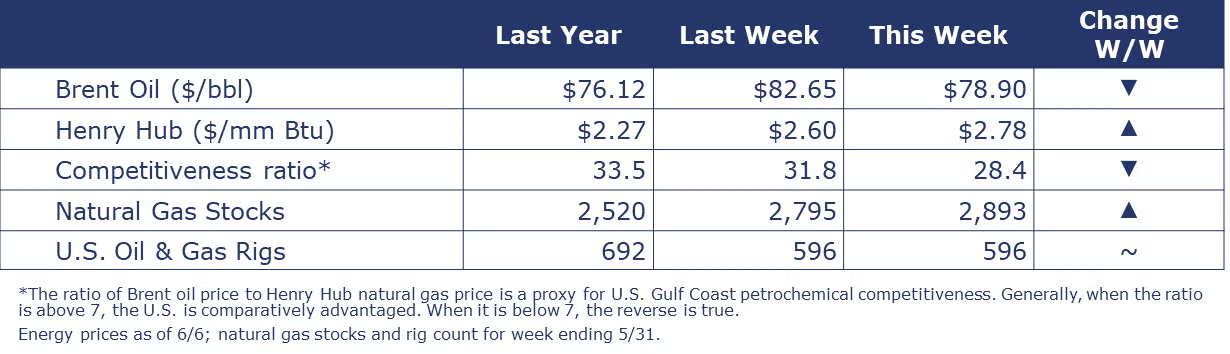
Oil prices were lower on weaker manufacturing data in the U.S. and concern about oversupply as gains from non-OPEC producers could offset the continuation of production cuts from OPEC+ producers. U.S. natural gas futures rose this week on a hot summer forecast and the first severe heat wave of the season on the West Coast. A brief uptick in European prices after a production outage in Norway eased as production resumed toward the end of the week. The combined oil and gas rig count remained stable at 496 for the week ending May 31st.
Indicators for the business of chemistry bring to mind a yellow banner.
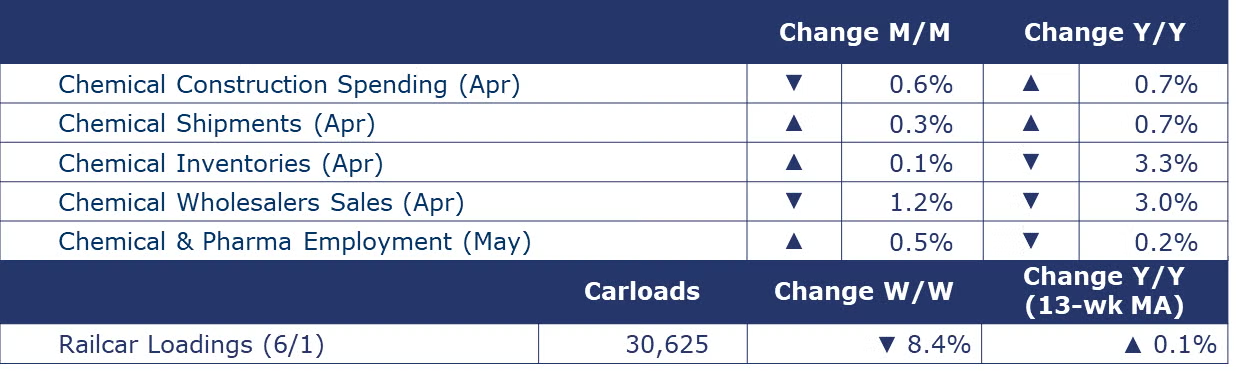
According to data released by the Association of American Railroads, chemical railcar loadings were down to 30,625 for the week ending June 1. Loadings were up 0.1% Y/Y (13-week MA), up (3.9%) YTD/YTD and have been on the rise for 7 of the last 13 weeks.
Within the details of the ISM Manufacturing PMI® report, the chemical industry was one of seven industries that reported growth in May. New orders, production, employment, raw material prices, order backlogs were reported to be higher. Import volumes were lower. Supplier deliveries were reported to be slower. Inventories were reported to be lower and customer inventories were deemed to be “too low”. One chemical products industry respondent commented, “[It] seems like a minor slowdown is happening. With less spending in the economy, less pressure on us for our products.”
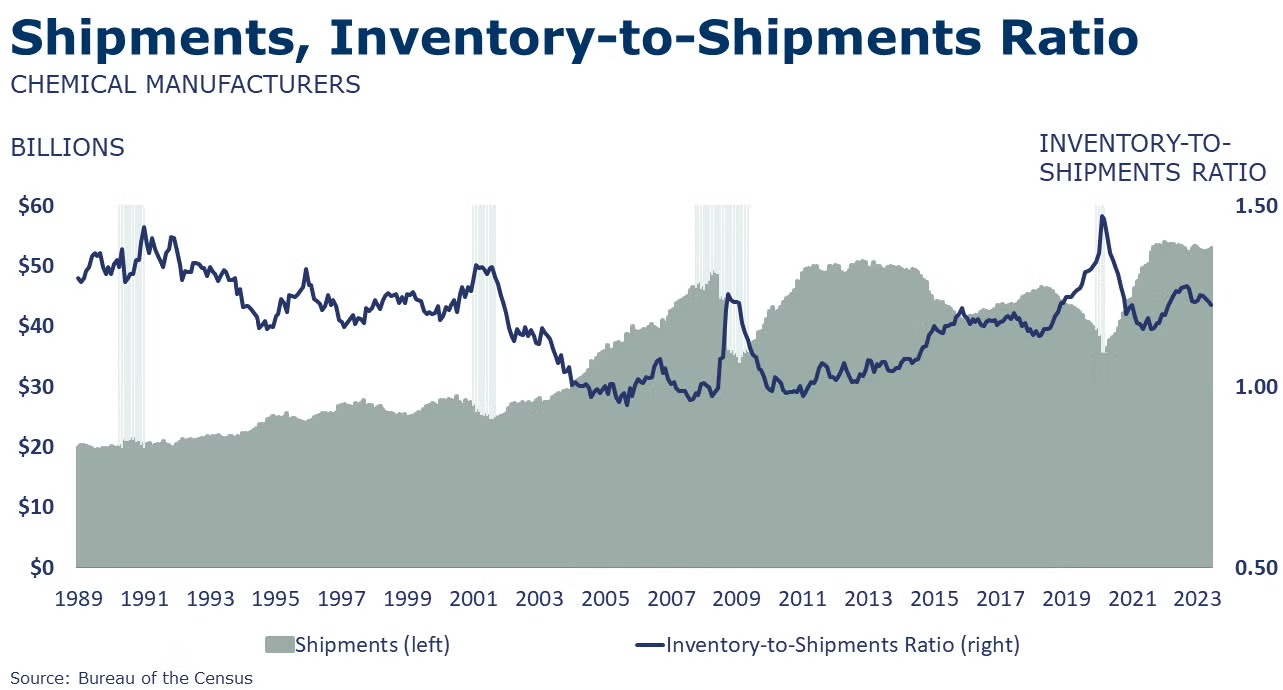
Chemical shipments rose for a third consecutive month, by 0.3% in April to $53.3 billion. There were gains across all major segments, with the largest increase in shipments of coatings & adhesives. Following five straight months of declines, chemical inventories edged slightly higher (by 0.1%) with declines in agricultural chemicals and coatings & adhesives that were offset by a gain in other chemical inventories. Compared to a year ago, chemical shipments were up 0.7% while inventories were 3.3% lower Y/Y. The inventories-to-shipments ratio for chemicals fell from 1.20 in March to 1.19 in April, the lowest reading in more than two years (February 2022).
Sales of chemicals at the wholesale level fell by 1.2% to $13.1 billion in April. Wholesale chemical inventories also fell, by 0.7%. Compared to a year ago, sales were down 3.0% while inventories were off by 9.1% Y/Y. The inventories-to-sales ratio nudged up to 1.11 in April from 1.10 in March. A year ago, the ratio was 1.18.
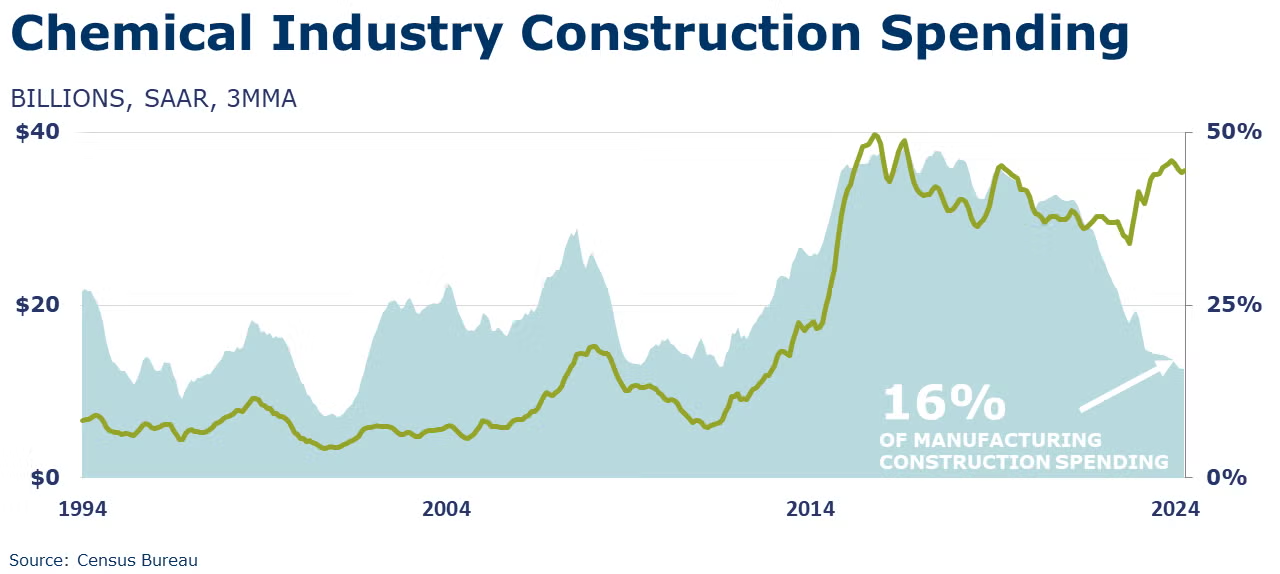
Chemical industry construction spending fell 0.6% in April to $35.7 billion annual rate. Compared to a year ago, however, chemical industry construction spending remained higher by 0.7%. Chemical industry construction spending accounted for nearly 16% of total construction spending for manufacturing structures.
Chemical and pharmaceutical industry employment grew by 4,100 (0.5%) to 903,100 in May. The number of production workers rose by 6,200 while the number of nonproduction/supervisory workers fell by 2,100. Compared to last May, employment levels were lower by 2,000 (-0.2%). Chemical industry average wages rose 4.2% Y/Y, slightly faster than in April, but at a markedly slower pace than the beginning of the year. The average workweek rose by half an hour to 41.9 hours. Combined with the increase in production workers, the labor input into the chemical industry rose, suggesting growth in May. This is consistent with the details in the ISM Manufacturing PMI® report.
Note On the Color Codes
Banner colors reflect an assessment of the current conditions in the overall economy and the business chemistry of chemistry. For the overall economy we keep a running tab of 20 indicators. The banner color for the macroeconomic section is determined as follows:
Green – 13 or more positives
Yellow – between 8 and 12 positives
Red – 7 or fewer positives
There are fewer indicators available for the chemical industry. Our assessment on banner color largely relies upon how chemical industry production has changed over the most recent three months.
For More Information
ACC members can access additional data, economic analyses, presentations, outlooks, and weekly economic updates through ACCexchange.
In addition to this weekly report, ACC offers numerous other economic data that cover worldwide production, trade, shipments, inventories, price indices, energy, employment, investment, R&D, EH&S, financial performance measures, macroeconomic data, plus much more. To order, visit http://store.americanchemistry.com/.
Every effort has been made in the preparation of this weekly report to provide the best available information and analysis. However, neither the American Chemistry Council, nor any of its employees, agents or other assigns makes any warranty, expressed or implied, or assumes any liability or responsibility for any use, or the results of such use, of any information or data disclosed in this material.
Contact us at ACC_EconomicsDepartment@americanchemistry.com.

