Running tab of macro indicators: 7 out of 20
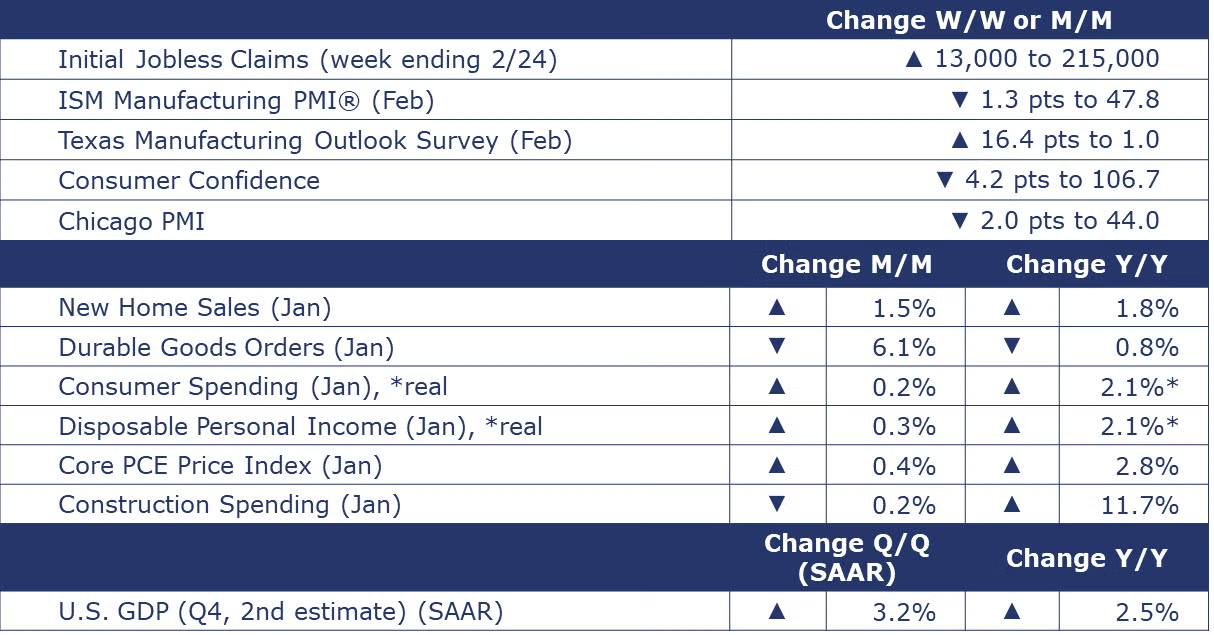
The number of new jobless claims rose by 13,000 to 215,000 during the week ending February 24. Continuing claims rose by 45,000 to 1.9 million, and the insured unemployment rate for the week ending February 17 rose 0.1 percentage point to 1.3%.
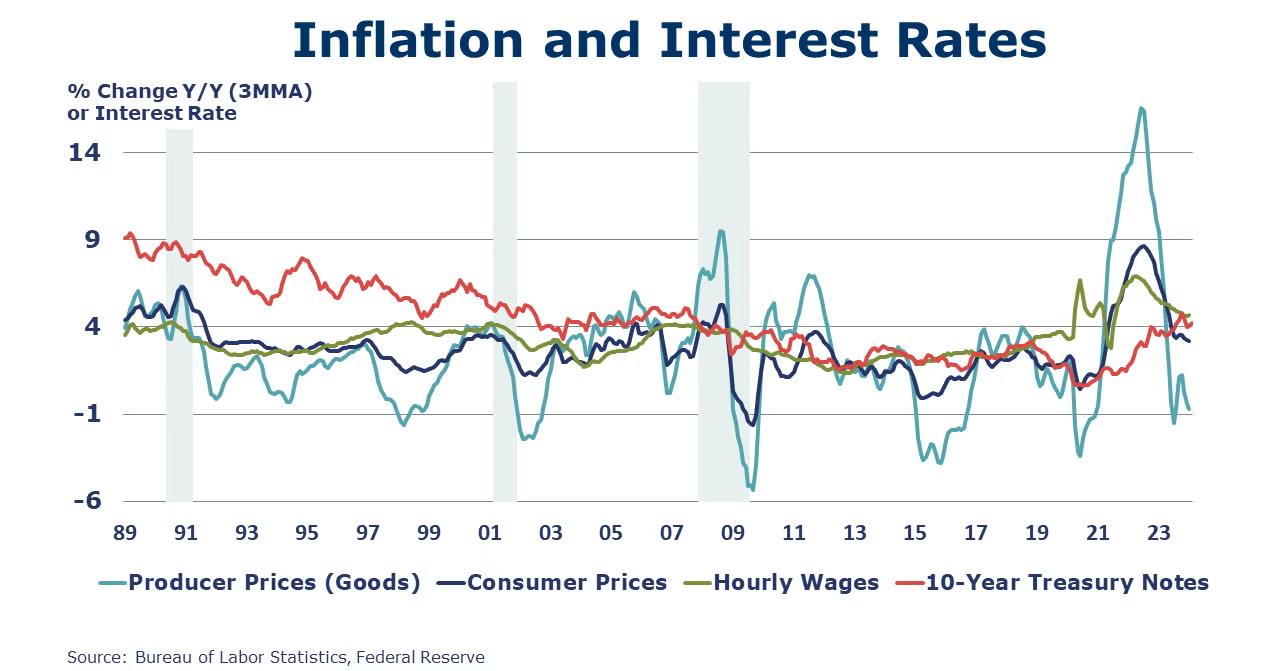
Consumer spending increased 0.2% in January following a 0.7% gain in December. The increase reflects higher spending on services. Goods spending declined. Aggregate personal income (the spending power of those consumers) rose 1.0%. Disposable personal income rose 0.3%. The headline price index for personal consumption expenditures (PCE) moderated to a 2.4% Y/Y pace. Excluding volatile food and energy, growth in the core PCE price index fell to a 2.8% Y/Y pace, getting closer to the Fed’s preferred target of 2%.
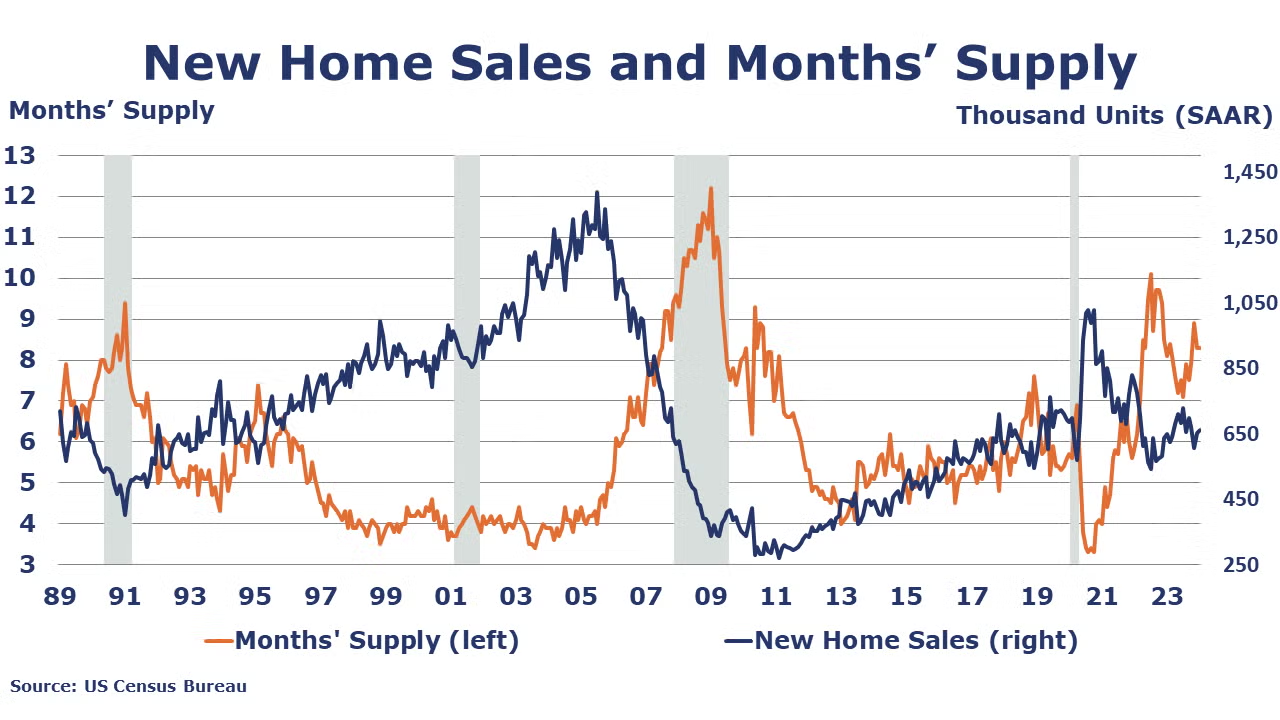
New home sales rose 1.5% in January to a SAAR of 661,000, a level up 1.8% Y/Y. New home sales rose in all regions except the South. Months’ supply remained at 8.3 months reflecting a limited increase in inventory. A year ago, months’ supply was at 8.1 months.
The ISM Manufacturing PMI® continues to indicate contraction in the U.S. industrial sector. The index, which has been below the 50-neutral mark for 16 months, dropped 1.3 points to 47.8% in February, meaning the rate of contraction accelerated. According to ISM, new orders and backlogs contracted as did production and employment. Both exports and imports expanded. Supplier deliveries are slowing, raw materials inventories contracted, and customers’ inventories were reported as “too low”. Manufacturers experienced rising prices. Of the 17 manufacturing industries tracked, 8 reported growth – Apparel, Leather & Allied Products; Nonmetallic Mineral Products; Primary Metals; Plastics & Rubber Products; Fabricated Metal Products; Chemical Products; Miscellaneous Manufacturing; and Transportation Equipment.
Two regional manufacturing surveys (Richmond and Dallas) conducted by the Federal Reserve indicated relatively flat manufacturing activity in February. Expectations about future business conditions improved slightly, and employment ticked upward. A third regional survey, in the Kansas City Region, found a slight drop in manufacturing activity and future business conditions while employment ticked up.
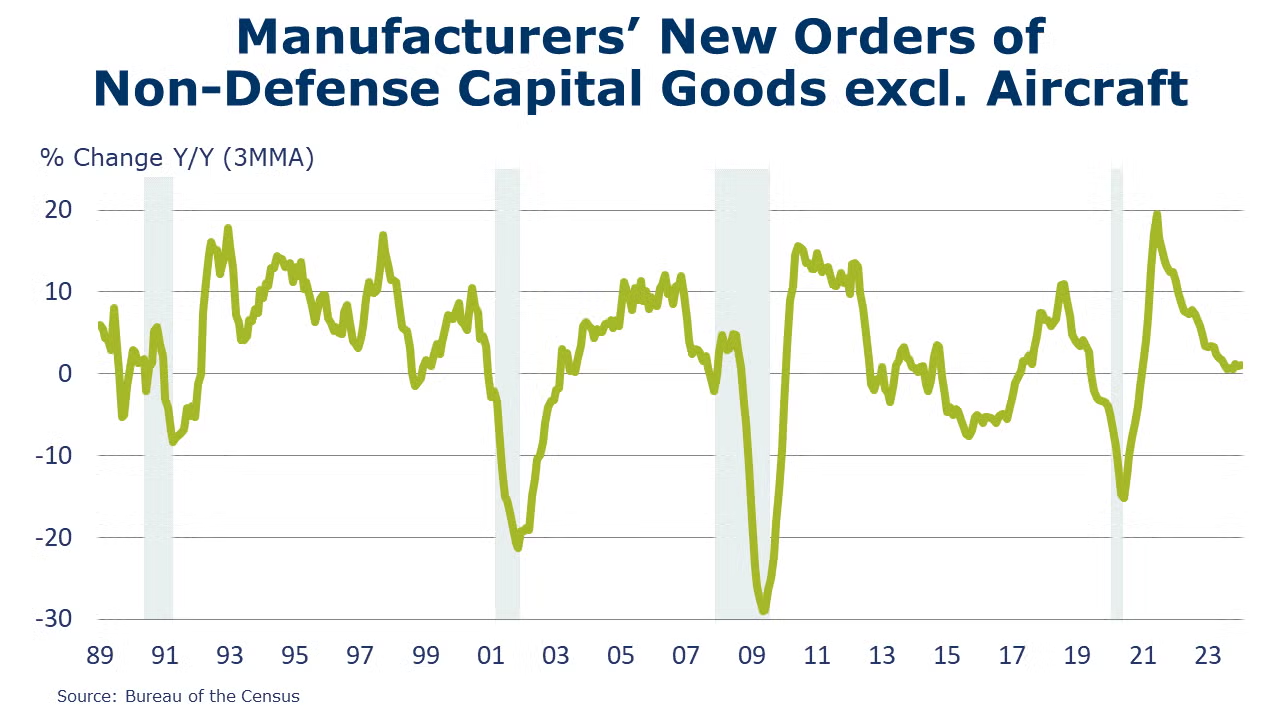
Durable goods orders fell 6.1% in January. A sharp drop in aircraft orders (specifically Boeing) was the primary factor in the decline in orders. Excluding transportation, orders were down 0.3%. New orders for computers and related products were up 5.8%.
The Conference Board Consumer Confidence Index® fell in February, after three months of gains, to 106.7, down from a revised 110.9 in January. In addition to inflation, consumers expressed concern about the labor market situation and the U.S. political environment.
GDP for 4Q (2nd estimate) increased 3.2% Q/Q, reflecting increases in consumer spending, exports, state/local government spending, residential and nonresidential fixed investment, and federal government spending, partly offset by a decrease in private inventory investment. On a Y/Y basis, GDP was up 2.5%.
Dipping by just 0.2% in January, construction spending in the U.S was relatively stable at a level 11.7% higher compared to a year ago. Private residential spending rose 0.2% M/M to a level up 5.2% Y/Y. Gains in new single-family construction activity offset a decline in multi-family. Private non-residential construction spending declined 0.1% M/M, relatively stable and remaining strong compared to last year (up 15.2% Y/Y). Manufacturing construction spending rose 2.0% to a level up 36.6% Y/Y.
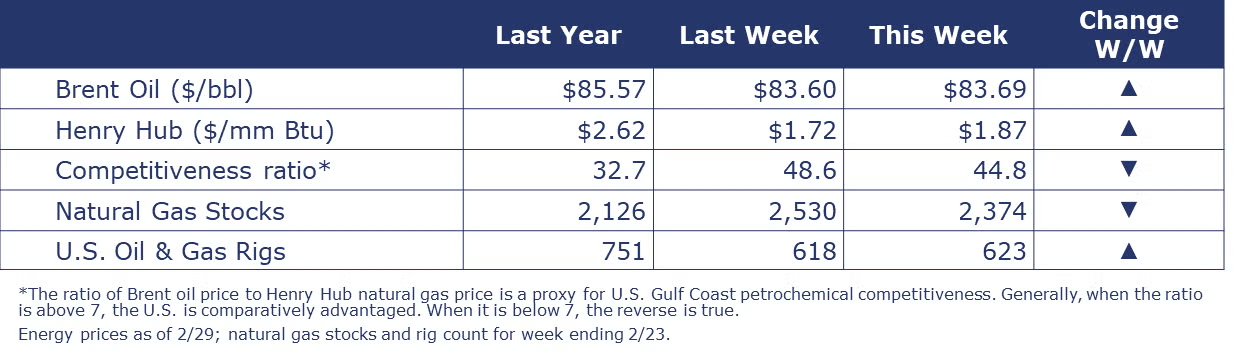
Oil prices moved slightly higher over the week. U.S. natural gas prices moved higher after EIA reported that working gas in storage declined by 96 Bcf from the previous week, exceeding estimates. The combined oil and gas rig count rose by 5 to 623.
Indicators for the business of chemistry bring to mind a yellow banner.
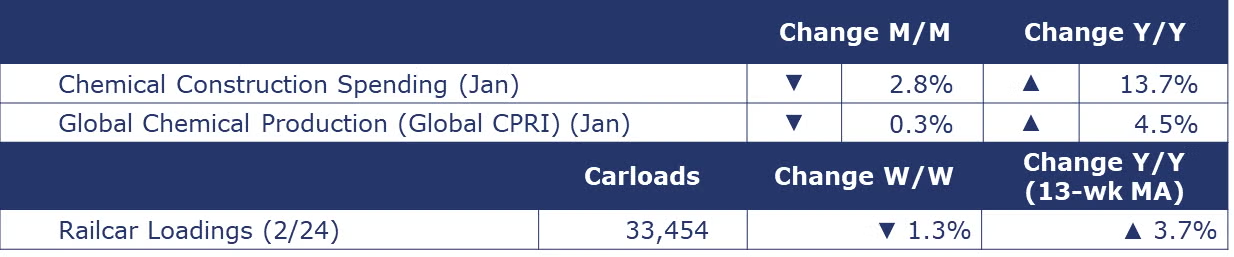
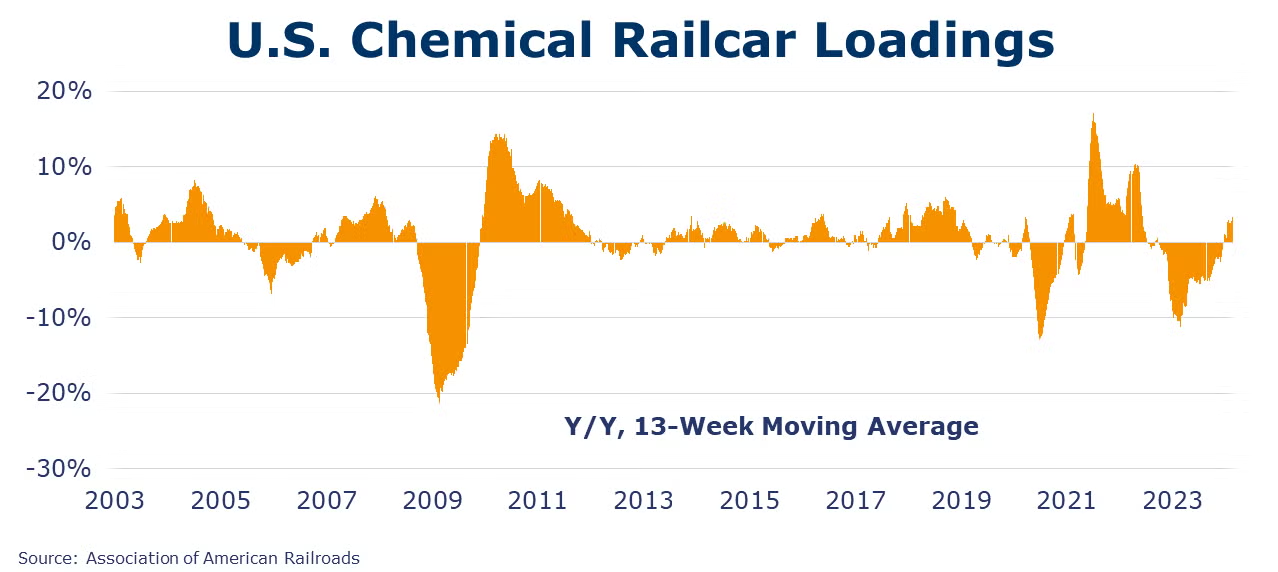
According to data released by the Association of American Railroads, chemical railcar loadings were down to 33,454 for the week ending February 24. Loadings were up 3.7% Y/Y (13-week MA), up 4.3% YTD/YTD and have been on the rise for 7 of the last 13 weeks.
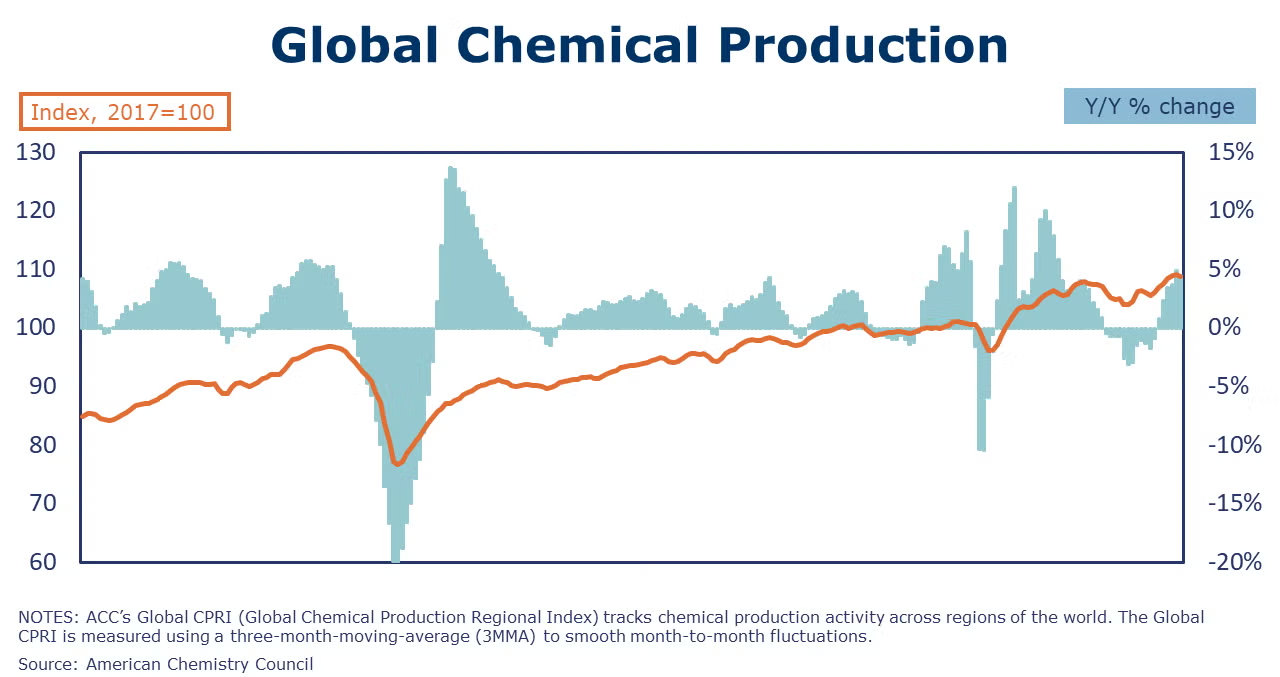
Following a 0.2% gain in December, ACC’s Global Chemical Production Regional Index (Global CPRI) eased in January (lower by 0.3%) All regions recorded negative growth except for Africa & Middle East where production was flat. Activities in the U.S. eased as the January freeze led to a decline in output in the Gulf Region. China’s production moved down as the country was preparing for the Lunar New Year celebration. Global chemicals production growth was up 4.5% Y/Y.
Chemical industry construction spending slowed down (by 2.8%) in January but remains 13.7% higher Y/Y. Chemical industry spending represented about 16% of total manufacturing construction spending in January.
The ISM Manufacturing PMI® report indicated the chemical industry was one of the manufacturing industries that registered growth in February. One respondent from the chemical industry commented, “Currently seeing increasing sales in our business. Most delivery dates are in the second quarter of 2024.” Chemicals saw a rise in new orders (though export orders contracted) and the industry was one of just two major industries reporting a pickup in production. The ISM report, explained the expansion in the chemical industry was important because the industry is “foundational, providing products across the manufacturing sector.” Chemical inventories were drawn down in February and order backlogs contracted. Encouraging for future orders and production, chemical manufacturers reported their customer inventories as “too low”.
Also in the ISM report, chemicals employment declined in February. The ISM shared that across manufacturing sectors reducing labor, “companies are continuing to reduce head counts using layoffs (which account for 50 percent of reduction activity), attrition and hiring freezes.” Chemical companies saw slower supplier deliveries and continue to navigate higher raw materials prices.
Note On the Color Codes
Banner colors reflect an assessment of the current conditions in the overall economy and the business chemistry of chemistry. For the overall economy we keep a running tab of 20 indicators. The banner color for the macroeconomic section is determined as follows:
Green – 13 or more positives
Yellow – between 8 and 12 positives
Red – 7 or fewer positives
There are fewer indicators available for the chemical industry. Our assessment on banner color largely relies upon how chemical industry production has changed over the most recent three months.
For More Information
ACC members can access additional data, economic analyses, presentations, outlooks, and weekly economic updates through ACCexchange.
In addition to this weekly report, ACC offers numerous other economic data that cover worldwide production, trade, shipments, inventories, price indices, energy, employment, investment, R&D, EH&S, financial performance measures, macroeconomic data, plus much more. To order, visit http://store.americanchemistry.com/.
Every effort has been made in the preparation of this weekly report to provide the best available information and analysis. However, neither the American Chemistry Council, nor any of its employees, agents or other assigns makes any warranty, expressed or implied, or assumes any liability or responsibility for any use, or the results of such use, of any information or data disclosed in this material.
Contact us at ACC_EconomicsDepartment@americanchemistry.com.

