Running tab of macro indicators: 9 out of 20
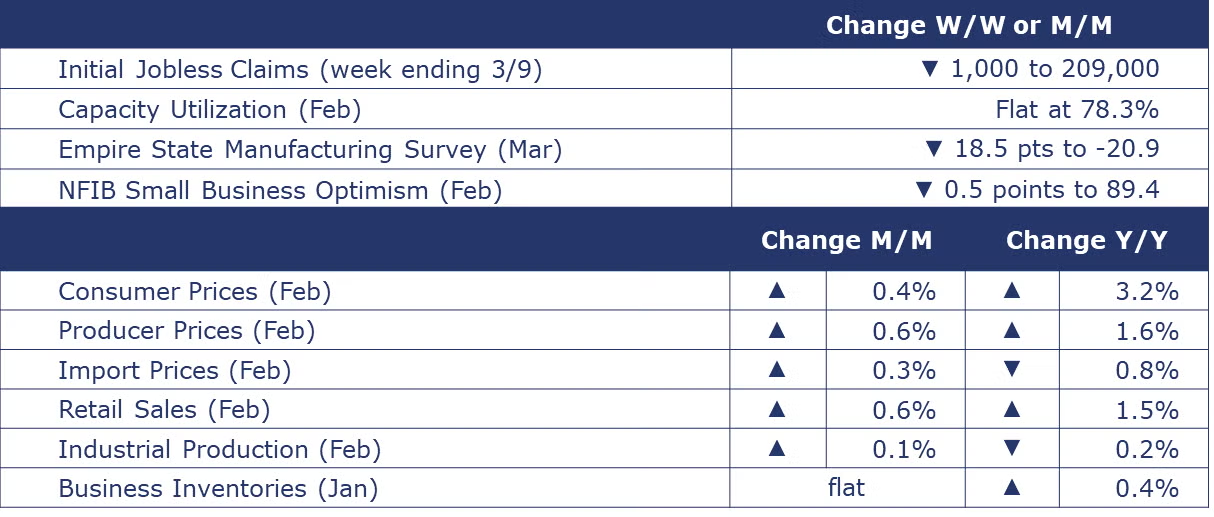
The number of new jobless claims fell by 1,000 to 209,000 during the week ending March 9. Continuing claims increased by 17,000 to 1.8 million, and the insured unemployment rate for the week ending March 2 was unchanged at 1.2%.
Following a weather-impacted 1.1% decline in January, retail sales rebounded in February, up 0.6%. The largest percentage gains were in motor vehicles & parts, building materials, electronics & appliances, and gas station sales (reflecting higher gasoline prices). Sales at restaurants and bars were up 0.4%. Several categories saw lower sales, including furniture & furnishings, grocery stores, clothing & accessories, and health & personal care. Sales from online platforms eased slightly. Compared to last February, retail sales were 1.5% higher.

Consumer prices came in ahead of expectations in February, up by 0.4% from January, the fastest monthly gain since September. The gain in February was driven by higher prices for gasoline, transportation services, and shelter. Excluding the volatile food and energy components, core consumer prices also rose by 0.4%, the same as in January. On an annual basis, headline consumer prices were up 3.2% (an accelerated pace compared to January), and core prices were up by 3.8%, continuing its slow downward descent.
Producer prices also rose by more than expected in February, up by 0.6% from January, led by strong gains in energy prices. Excluding food and energy, core goods prices were up 0.3%. Compared to a year ago, headline producer prices were up 1.6% Y/Y while core goods prices were up 2.8% Y/Y. Both annual comparisons show an acceleration compared to last month.
Led by gains in fuel imports, U.S. import prices rose by 0.3% in February following a 0.8% gain in January. Over the past 12 months, import prices have come down 0.8%. Fuel import prices are down 4.1% over the past 12 months. Export prices had been softening through the last quarter of 2023 but picked up 0.9% in January and another 0.8% in February. Over the past 12 months, export prices have moderated by 1.8%.
Combined business inventories were flat in January, as a gain in retail inventories was offset by lower inventories at the manufacturing and wholesale levels. Combined business sales fell, however, down by 1.3% with declines across the value chain. Winter storms across much of the U.S. disrupted sales activity in January. Compared to a year ago, sales were off 1.2% while inventories were up by 0.4%. The inventories-to-sales ratio ticked higher to 1.39 from 1.38 in December and was higher than last January’s ratio of 1.37.
The NFIB Small Business Optimism Index decreased in February to 89.4, marking the 26th consecutive month below the 50-year average of 98. Twenty-three percent of small business owners reported that inflation was their single most important business problem in operating their business, up three points from last month and replacing labor quality as the top problem.
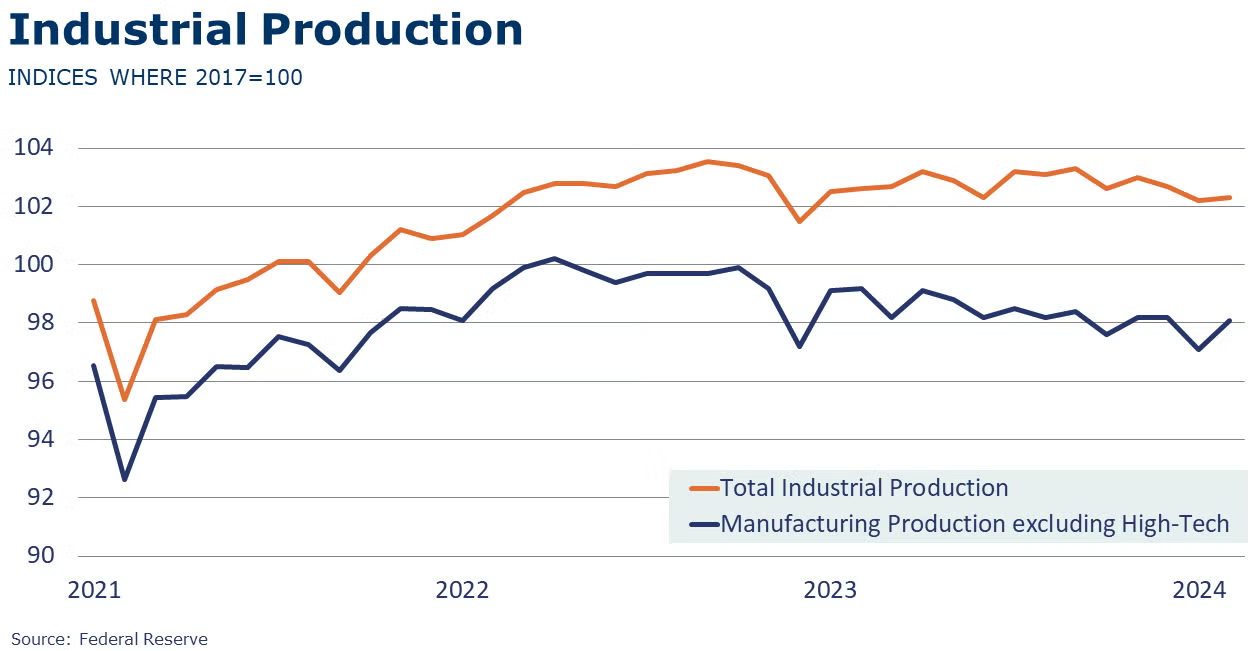
Following declines in December and January (due to winter storms), industrial production edged higher, by 0.1%, in February. Utility output fell back sharply (following a surge in January) and mining and manufacturing activity expanded. Manufacturing output (on a NAICS basis) was up by 0.9% with gains across a broad range of industries. The largest gains in output were in wood products, miscellaneous durable manufacturing, motor vehicles, furniture, machinery, chemicals, printing, and paper. Headline capacity utilization was flat, but manufacturing capacity utilization tightened from 76.4% in January to 77.0% in February, a rate still below the Q4 average, however. Compared to a year ago, overall industrial production was 0.2% lower and capacity utilization was lower than the 79.5% posted last February. Over the past year, industrial capacity grew by 1.4%.
Manufacturing activity continued to contract in New York, declining significantly in March. The index for general business conditions fell 18.5 points to -20.9. New orders and shipments were down. Employee count and hours worked also declined. Manufacturers were cautiously optimistic, expecting business conditions to have improved 6 months ahead. About half of manufacturers expect to see stronger demand in the form of a rising level of new orders. The pace of input price increases moderated somewhat in March while the pace of selling prices held steady. Manufacturers expect inflationary pressures to continue through the short term.
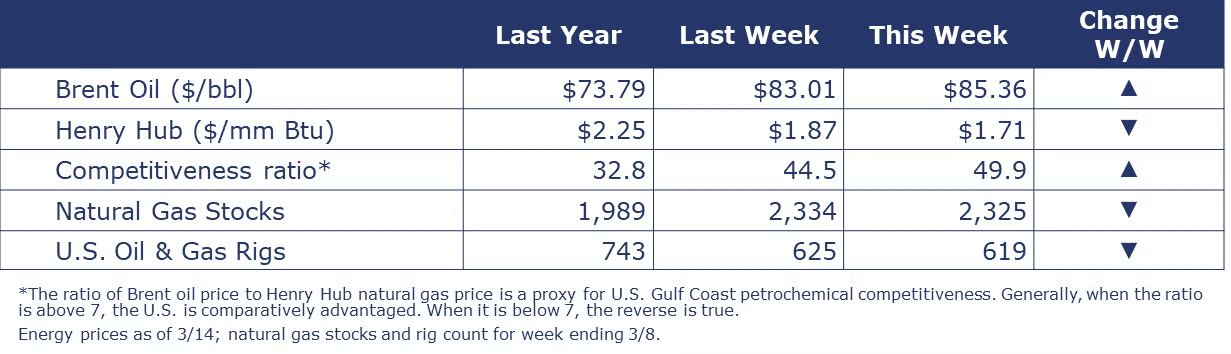
Oil prices were higher following Ukrainian attacks on Russian oil refineries. In addition, EIA reported a larger than expected stock drawdown. Spot prices at the Henry Hub fell to their lowest level since the 1990’s as the mild winter gets ready to turn to Spring and inventories are 37% above average. The combined oil and gas rig count fell by six to 619.
Indicators for the business of chemistry bring to mind a yellow banner.
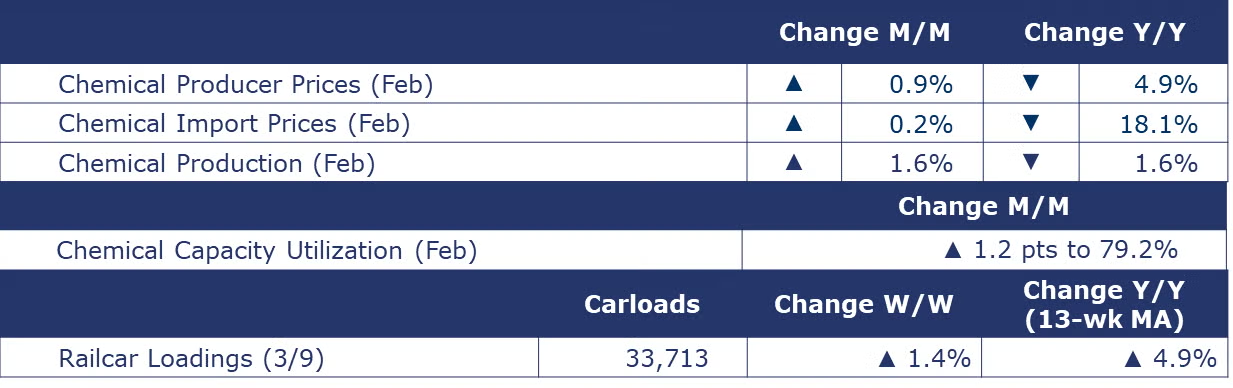
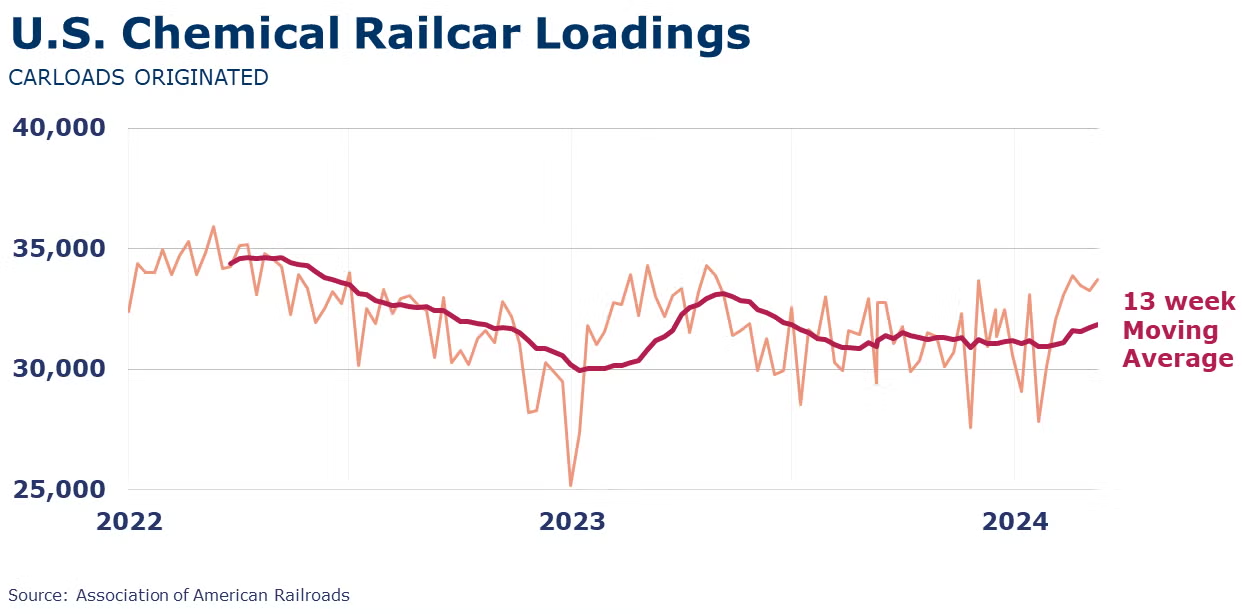
According to the Association of American Railroads, chemical railcar loadings were up to 33,713 for the week ending March 9. Loadings were up 4.9% Y/Y (13-week MA), up 4.2% YTD/YTD and have been on the rise for 7 of the last 13 weeks. We’re noticing positive momentum in the chemical railcar loadings data. Following 65 weeks straight of decline, Y/Y comparisons on the 13-week moving average of chemical rail loadings has been positive for the last 12 weeks.
Following three months of declines, chemical producer prices rose by 0.9%, the highest monthly gain since mid-2022. There were gains in the prices of plastic resins, synthetic rubber, organic chemicals, manufactured fibers, and consumer products. Those gains were partially offset by lower prices for agricultural chemicals, coatings, and inorganic chemicals. Compared to a year ago, prices remained lower by 4.9%.
U.S. chemical import prices rose 0.2% in February following 3 months of gains. Prices are down 18.1% Y/Y. U.S. chemical export prices were roughly stable in February, moderating by 0.1%. Compared to a year ago, chemical export prices are 8.9% lower.
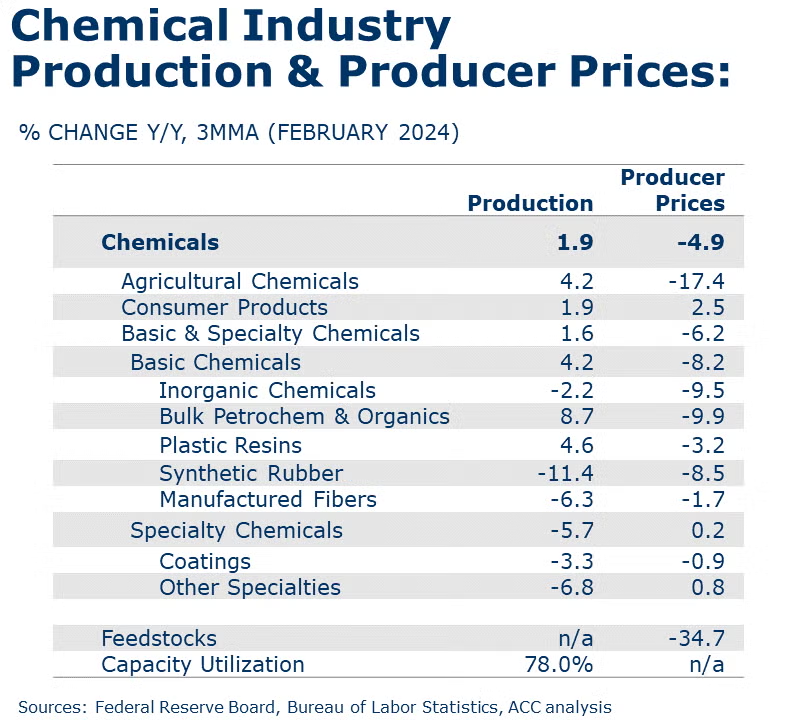
Following winter storm-related disruptions in January, chemical production rebounded in February, up by 1.6%. There were output gains across most chemistries, especially organic chemicals and plastic resins. Output of coatings & adhesives and inorganic chemicals declined and agricultural chemicals production was flat. Compared to a year ago, chemical production remained lower by 1.6%. Chemical capacity utilization also rebounded in February, up by 1.2 percentage points to 79.2%, still below a year ago, however.
Note On the Color Codes
Banner colors reflect an assessment of the current conditions in the overall economy and the business chemistry of chemistry. For the overall economy we keep a running tab of 20 indicators. The banner color for the macroeconomic section is determined as follows:
Green – 13 or more positives
Yellow – between 8 and 12 positives
Red – 7 or fewer positives
There are fewer indicators available for the chemical industry. Our assessment on banner color largely relies upon how chemical industry production has changed over the most recent three months.
For More Information
ACC members can access additional data, economic analyses, presentations, outlooks, and weekly economic updates through ACCexchange.
In addition to this weekly report, ACC offers numerous other economic data that cover worldwide production, trade, shipments, inventories, price indices, energy, employment, investment, R&D, EH&S, financial performance measures, macroeconomic data, plus much more. To order, visit http://store.americanchemistry.com/.
Every effort has been made in the preparation of this weekly report to provide the best available information and analysis. However, neither the American Chemistry Council, nor any of its employees, agents or other assigns makes any warranty, expressed or implied, or assumes any liability or responsibility for any use, or the results of such use, of any information or data disclosed in this material.
Contact us at ACC_EconomicsDepartment@americanchemistry.com.


