Running tab of macro indicators: 11 out of 20
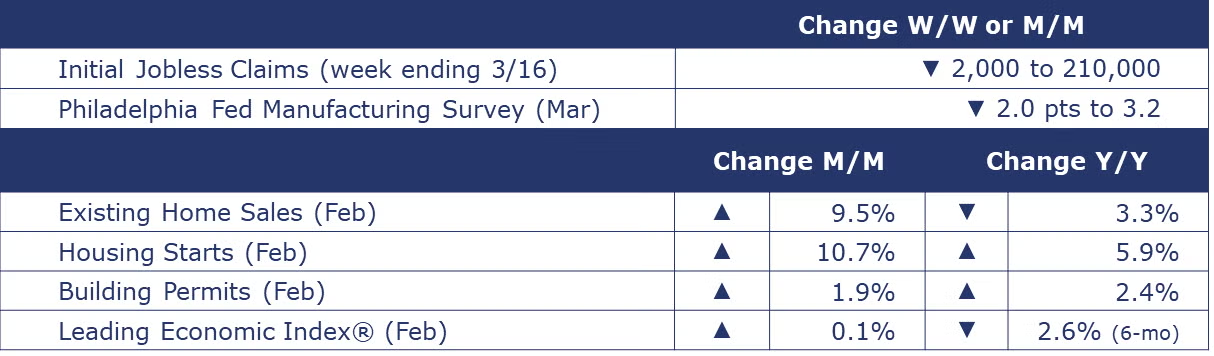
The number of new jobless claims fell by 2,000 to 210,000 during the week ending March 16. Continuing claims increased by 4,000 to 1.8 million, and the insured unemployment rate for the week ending March 9 was unchanged at 1.2%.
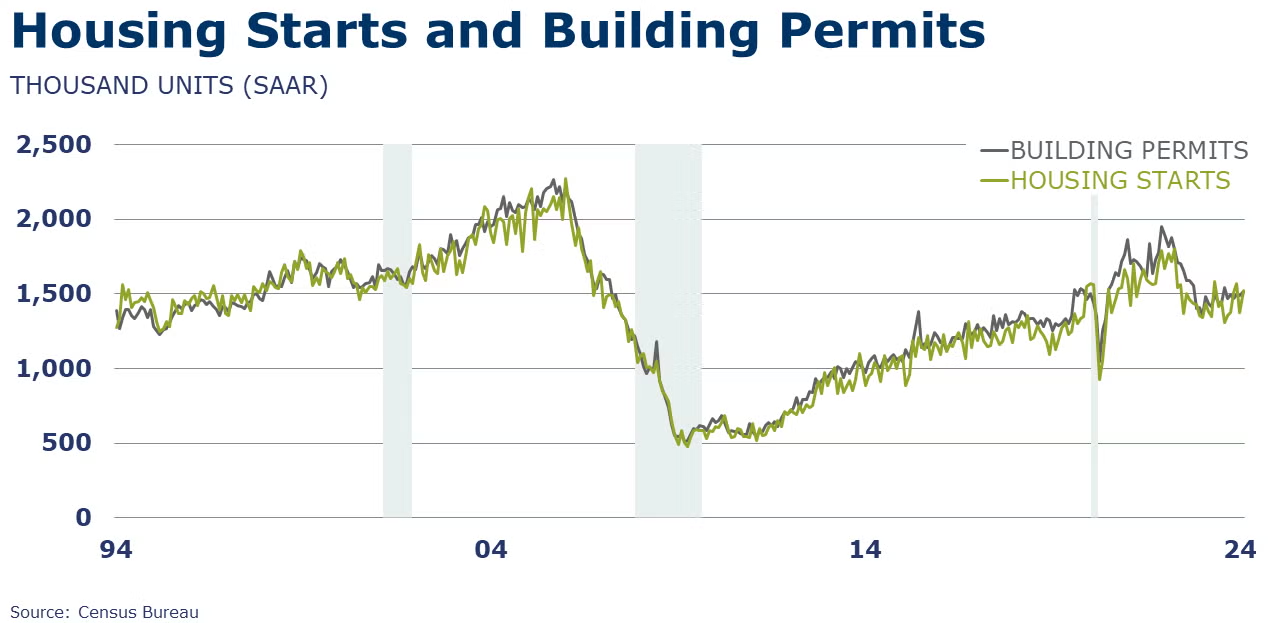
Following a drop in January, housing starts rebounded in February, up 10.7% to a 1.52 million seasonally adjusted annual pace. Chemistry intensive single-family starts rose 11.6%. Gains also occurred in multi-family and across all regions, except the West. Forward-looking building permits rose 1.9% with gains in single-family and multi-family. Building permits rose across all regions. Compared to a year ago, both building permits and housing starts were up by 2.4% and 5.9%.
NAHB’s builder sentiment gauge indicated homebuilders were confident about the single-family home market in March. The NAHB’s index hit an eighth month high and moved above a neutral reading. Builders are seeing improvement in prospective buyers’ traffic as the low inventory of homes in the housing market and declining mortgage rates are encouraging new home construction.
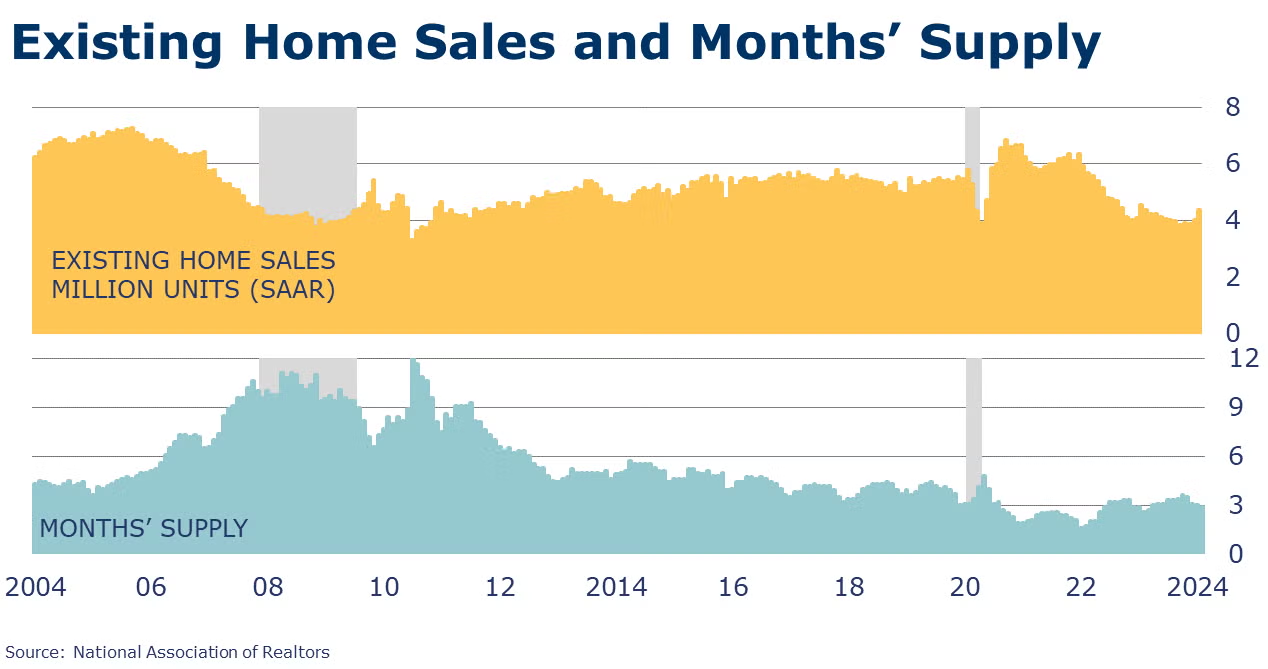
Existing home sales increased by 9.5% in February to a 4.38-million-unit pace but remain 3.3% below levels a year ago. Sales were up in all regions except the Northeast where they were flat. For the eighth month in a row, sales prices were higher on a Y/Y basis. The median existing home sales price rose 5.7% in February. Unsold inventories fell from 3.0 months’ supply in January to 2.9 months in February.
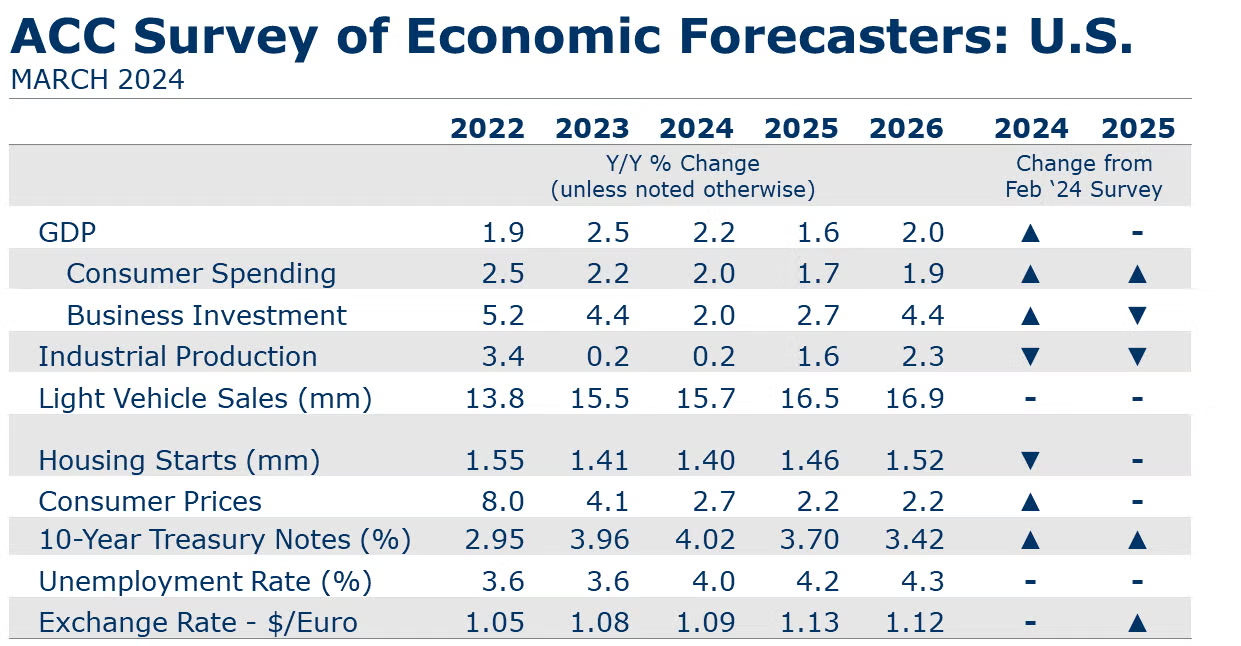
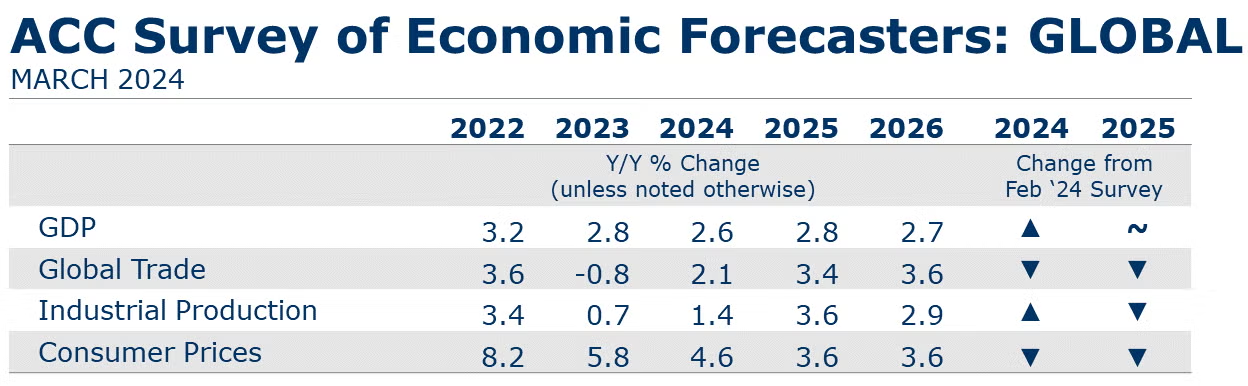
SURVEY OF ECONOMIC FORECASTERS
- A resilient labor market continues to provide strength in spending power for U.S. households despite the temporary disruptions related to January’s winter storms. Expectations for 2024 continued to improve for several key indicators.
- U.S. GDP is expected to grow by 2.2% in 2024 and by 1.6% in 2025.
- Consumer spending growth is expected to downshift to a 2.0% Y/Y pace in 2024 (from 2.2% in 2023) and slow further to a 1.7% gain in 2025.
- Higher borrowing costs and heightened uncertainty have cooled growth in business investment which is expected to decelerate to a 2.0% pace in 2024 before increasing to a 2.7% gain in 2025 as interest rates decline.
- Following a 0.2% gain in 2023, we look for industrial production to come in around the same pace (0.2%) in 2024 before strengthening to a 1.6% pace in 2025.
- Vehicle inventories started the year well ahead of where they were at the beginning of 2023, but higher borrowing costs have tempered demand. Sales of autos and light trucks are expected to grow to 15.7 million in 2024 (still below trend) before rising to a 16.5 million pace in 2025.
- Struggling with high prices, labor costs, and mortgage rates, new homebuilding has found some support from historically low inventories of existing homes. Housing starts are expected to remain essentially flat at 1.40 million in 2024 before rising to a 1.46 million pace in 2025 as mortgage rates come down.
- The unemployment rate is expected to move higher from near 50-year lows to average 4.0% in 2024 and 4.2% in 2025.
- Recent data shows that inflation is slowing, though it remains above the Fed’s target and the Fed has indicated that they are taking a cautious approach to rate cuts. Growth in consumer prices is expected to decelerate to a 2.7% pace in 2024 and 2.2% in 2025.
- Sticky inflation is expected to keep pressure on interest rates. Expectations for 10-year Treasury yields were slightly higher for 2024, but easing into 2025 as rate cuts are expected to start in mid-2024.
- Global GDP growth was revised up to 2.6% for 2024 and held at 2.8% for 2025. Global activity is forecast to expand at a 2.7% pace in 2026.
- Global inflation pressures have eased since 2022. Inflation will continue to moderate, advancing at a 4.6% pace this year (2024) and further easing toward an average 3.3% pace over the 2027-2031 period.
- Global manufacturing was weak and lacked momentum through 2023, expanding by less than 1% over the year. Growth will return as demand recovers. The industrial sector is forecast to grow 1.4% this year and pick up to a 3.6% pace in 2025.
- Relatively weak demand for manufactured goods was observed throughout the past year in flat or falling new orders – both domestic and export. Muted external demand for industrial goods hampered world trade volumes and trade contracted in 2023. Trade volumes are forecast to recover this year by 2.1% and by 3.4% in 2025.
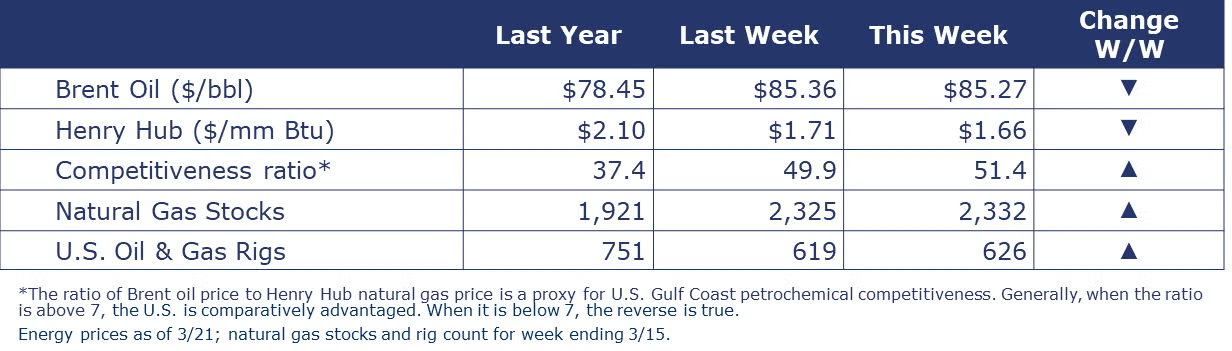
The combined oil and gas rig count rose by 7 to 626. U.S. natural gas prices eased slightly and remain near pandemic-level lows. Warmer weather last week allowed the first inventory build of the year. Inventories are now 41% higher than the five-year historic average. Oil prices moved higher on lower exports from KSA and Iraq and upwardly revised expectations for global oil demand.
Indicators for the business of chemistry bring to mind a yellow banner.

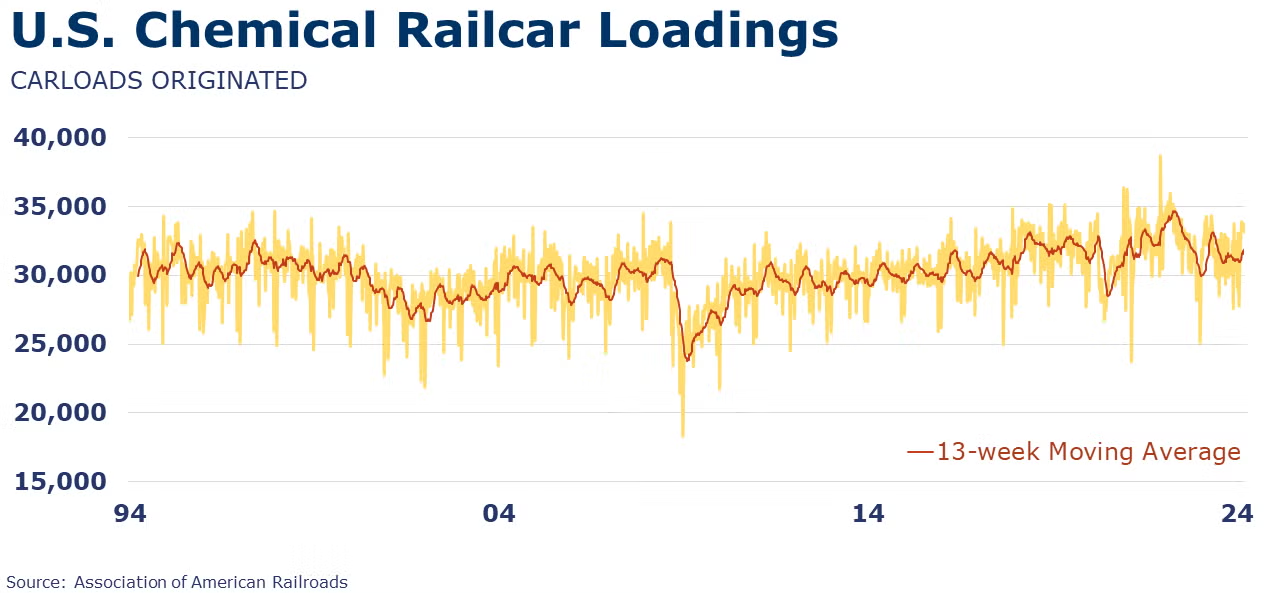
According to data released by the Association of American Railroads, chemical railcar loadings were down to 33,134 for the week ending March 16. Loadings were up 4.1% Y/Y (13-week MA), up 4.4% YTD/YTD and have been on the rise for 6 of the last 13 weeks.
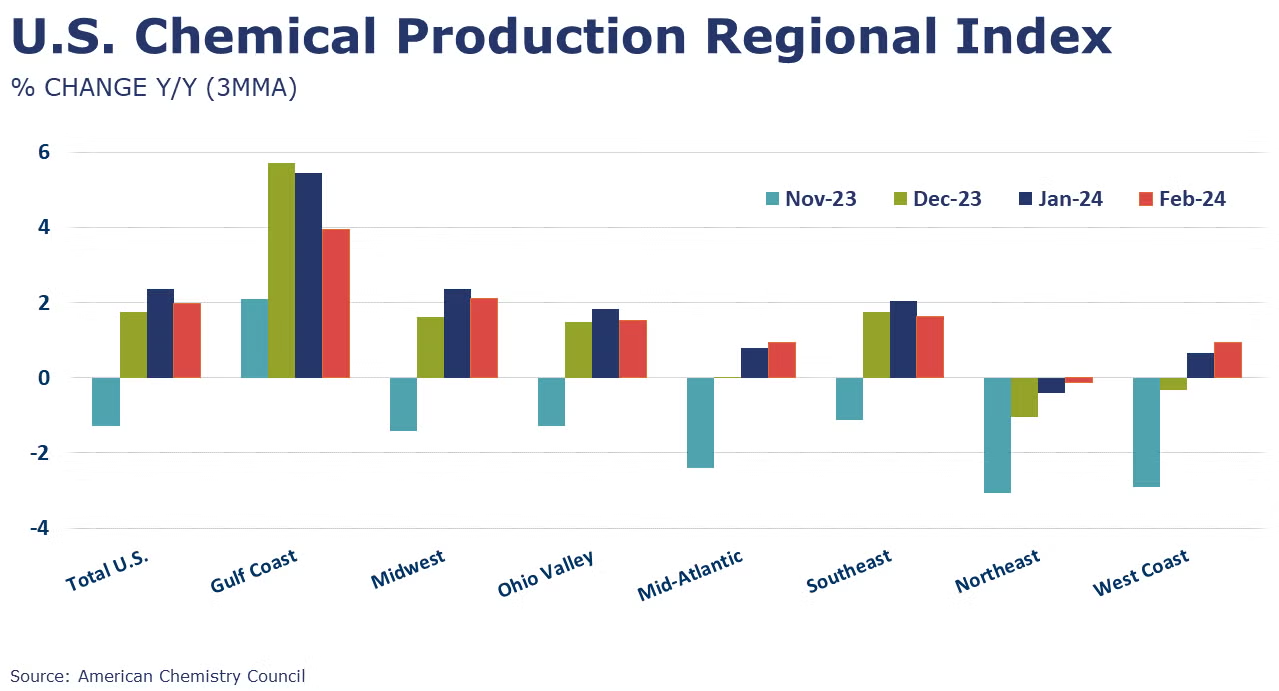
ACC's U.S. Chemical Production Regional Index (U.S. CPRI) rose 0.4% in February, following a 0.1% decline in January. Output rose across all regions, reflecting in part a rebound from January’s freeze that disrupted output especially in the Gulf Coast region. Compared to last February, output was 2.0% higher, with Y/Y gains in all regions (except the Northeast).
Note On the Color Codes
Banner colors reflect an assessment of the current conditions in the overall economy and the business chemistry of chemistry. For the overall economy we keep a running tab of 20 indicators. The banner color for the macroeconomic section is determined as follows:
Green – 13 or more positives
Yellow – between 8 and 12 positives
Red – 7 or fewer positives
There are fewer indicators available for the chemical industry. Our assessment on banner color largely relies upon how chemical industry production has changed over the most recent three months.
For More Information
ACC members can access additional data, economic analyses, presentations, outlooks, and weekly economic updates through ACCexchange.
In addition to this weekly report, ACC offers numerous other economic data that cover worldwide production, trade, shipments, inventories, price indices, energy, employment, investment, R&D, EH&S, financial performance measures, macroeconomic data, plus much more. To order, visit http://store.americanchemistry.com/.
Every effort has been made in the preparation of this weekly report to provide the best available information and analysis. However, neither the American Chemistry Council, nor any of its employees, agents or other assigns makes any warranty, expressed or implied, or assumes any liability or responsibility for any use, or the results of such use, of any information or data disclosed in this material.
Contact us at ACC_EconomicsDepartment@americanchemistry.com.


