Running tab of macro indicators: 11 out of 20
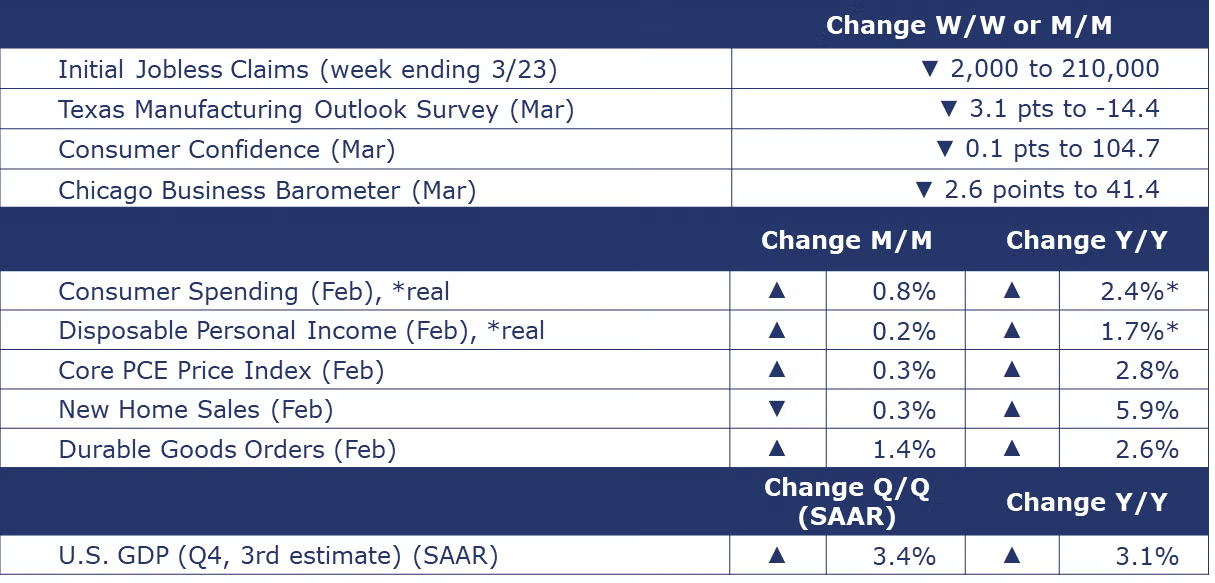
The number of new jobless claims fell by 2,000 to 210,000 during the week ending March 23. Continuing claims increased by 24,000 to 1.8 million, and the insured unemployment rate for the week ending March 16 was unchanged at 1.2%.
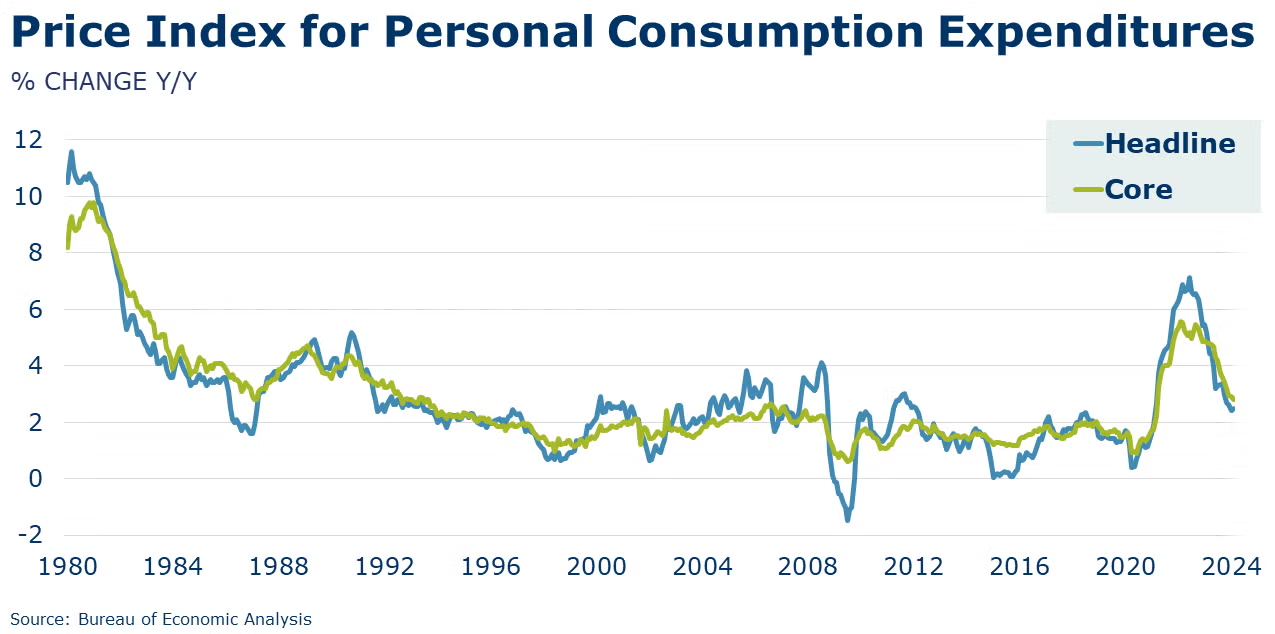
Consumer spending accelerated in February, up by 0.8%, well ahead of an expected rebound from January’s weather-related disruptions. The composition of consumer spending continued to tilt towards services. Real (adjusted for inflation) consumer spending on services was up 0.6% while spending on goods edged higher by 0.1%. Following a 1.0% gain in personal income in January (partially related to Federal cost-of-living adjustments), aggregate personal income rose 0.3% on stronger employee compensation. Compared to a year ago, real disposable personal income was up 1.7% while real consumer spending was up 2.4%. This is the first time since December 2022 that annual spending growth has exceeded income growth. The savings rate dipped to 3.6%, the lowest since November 2022. These may be indications that consumers are reaching the limits of their ability to spend. The Fed’s preferred measure of inflation, the core price index for personal consumption expenditures (PCE) eased to a 2.8% Y/Y pace in February, remaining ahead of the Fed’s 2% target. The headline PCE price index (including food and energy), however, was up 2.5% Y/Y, slightly higher than last month’s print.
Following gains the previous two months, new home sales eased in February, down by 0.3%. The decline may reflect slightly higher mortgage rates during the month, as affordability remains a headwind for many potential homebuyers. Sales were higher in the South and Midwest, but lower in the Northeast and Midwest regions. Inventories edged higher, up 1.3%. As a result, the supply of new homes rose from 8.3 months in January to 8.4 months in February. The median sales price continued to move lower, down from a year ago for a sixth consecutive month, by 7.6%.
Concerned by elevated price levels, consumer confidence dipped in March, down by 0.1 points to 104.7. While consumers remained optimistic about the current situation, they became more pessimistic about the future. While fears of a recession continued to trend downward, consumers are becoming increasingly worried about the U.S. political environment. Expectations for the next six months slipped to their lowest level since October 2023 as consumers’ outlook for jobs, income, and business conditions deteriorated. Consumers’ buying plans for interest rate-sensitive big-ticket items (cars, appliances, homes) fell again.
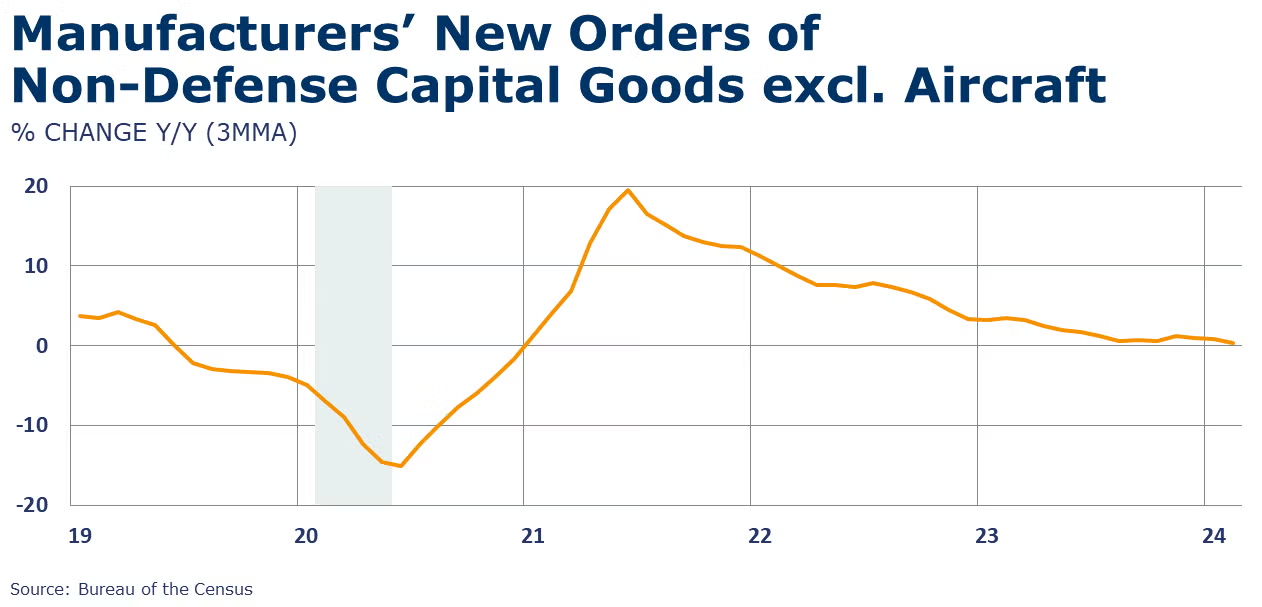
Following declines in January and December, headline durable goods orders rose 1.4% in February. There were broad-based gains with the largest percentage increases in orders for aircraft (civilian and defense), computers, machinery, motor vehicles, and primary metals. Core business orders also rose, up by 0.7%, following declines the previous two months. Compared to a year ago, headline orders were up 2.6% Y/Y while core business orders were up 0.5% Y/Y.
The third and final estimate of Q4 GDP showed that the U.S. economy grew at a 3.4% seasonally adjusted annual rate (SAAR) during the last three months of 2023. The update primarily reflected upward revisions to consumer spending and business fixed investment that were partly offset by a downward revision to private inventory investment. Compared to Q4 2022, GDP was 3.1% higher. With the final numbers in for Q4, for the year as a whole, GDP grew by 2.5%.
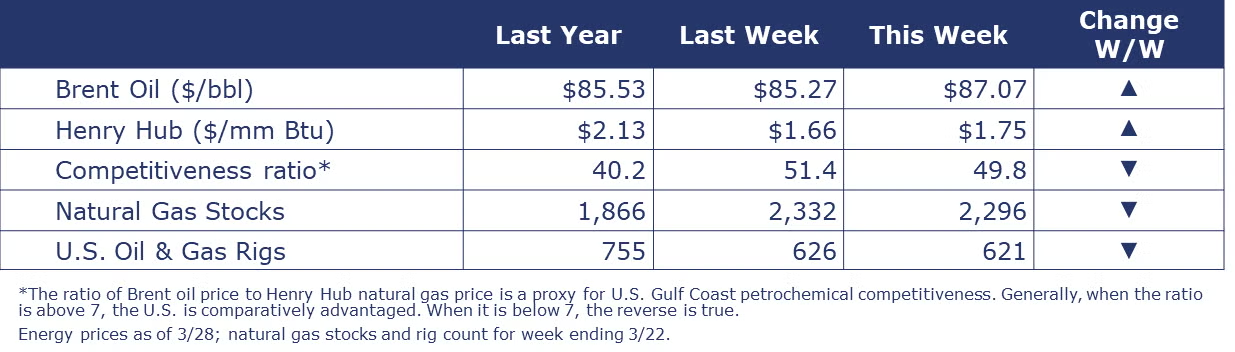
Oil prices advanced this week with a smaller than expected inventory build. U.S. natural gas prices continued to bounce around recent lows. The combined oil and gas rig count fell by five to 621 during the week ending 22 March. Over the same week, natural gas inventories were 36 BCF lower (following a small build the previous week). Natural gas inventories remain more than 40% above their five-year historic average going into the shoulder season between periods of heating and cooling demand.
Indicators for the business of chemistry bring to mind a yellow banner.

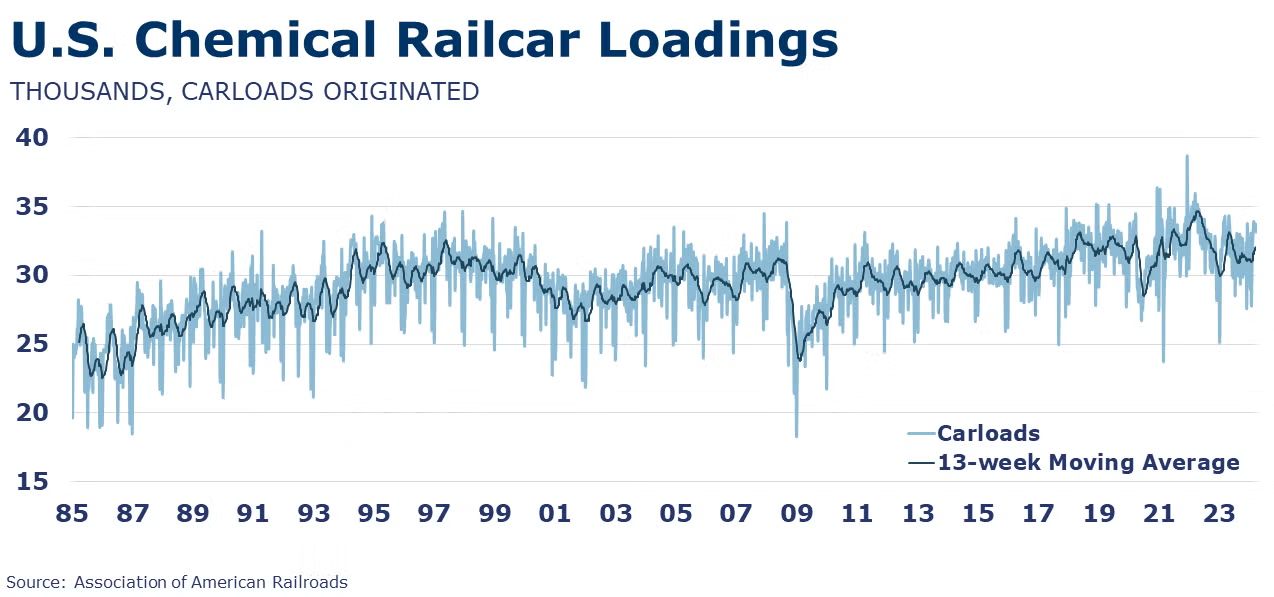
According to the Association of American Railroads, chemical railcar loadings were up to 33,702 for the week ending March 23. Loadings were up 3.6% Y/Y (13-week MA), up (4.5%) YTD/YTD and have been on the rise for 7 of the last 13 weeks.
Note On the Color Codes
Banner colors reflect an assessment of the current conditions in the overall economy and the business chemistry of chemistry. For the overall economy we keep a running tab of 20 indicators. The banner color for the macroeconomic section is determined as follows:
Green – 13 or more positives
Yellow – between 8 and 12 positives
Red – 7 or fewer positives
There are fewer indicators available for the chemical industry. Our assessment on banner color largely relies upon how chemical industry production has changed over the most recent three months.
For More Information
ACC members can access additional data, economic analyses, presentations, outlooks, and weekly economic updates through ACCexchange.
In addition to this weekly report, ACC offers numerous other economic data that cover worldwide production, trade, shipments, inventories, price indices, energy, employment, investment, R&D, EH&S, financial performance measures, macroeconomic data, plus much more. To order, visit http://store.americanchemistry.com/.
Every effort has been made in the preparation of this weekly report to provide the best available information and analysis. However, neither the American Chemistry Council, nor any of its employees, agents or other assigns makes any warranty, expressed or implied, or assumes any liability or responsibility for any use, or the results of such use, of any information or data disclosed in this material.
Contact us at ACC_EconomicsDepartment@americanchemistry.com.


