Running tab of macro indicators: 10 out of 20
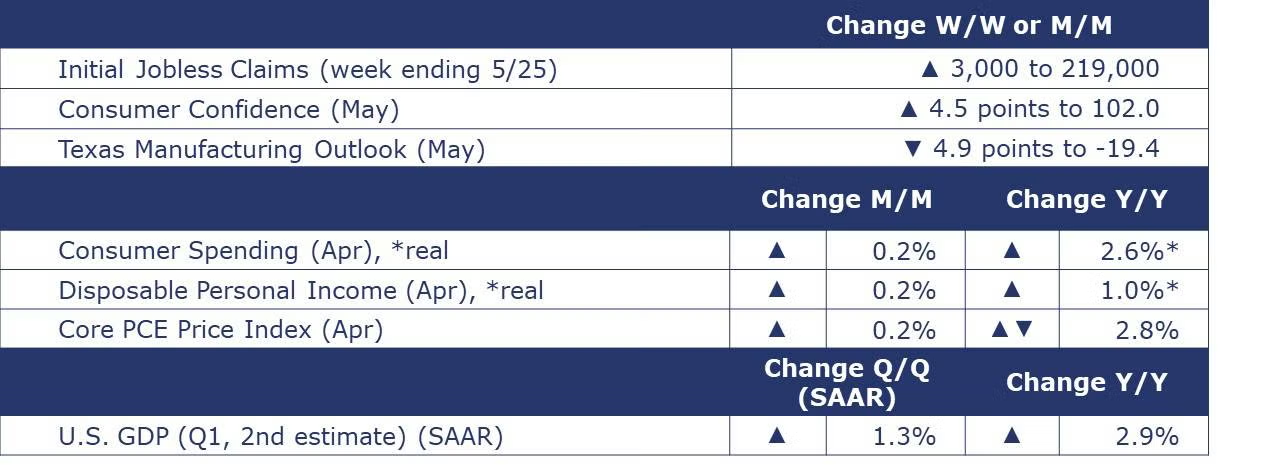
The number of new jobless claims rose by 3,000 to 219,000 during the week ending May 25th. Continuing claims increased by 4,000 to 1.79 million, and the insured unemployment rate for the week ending May 18th was unchanged at 1.2%. Several measures of price growth also were revised lower.
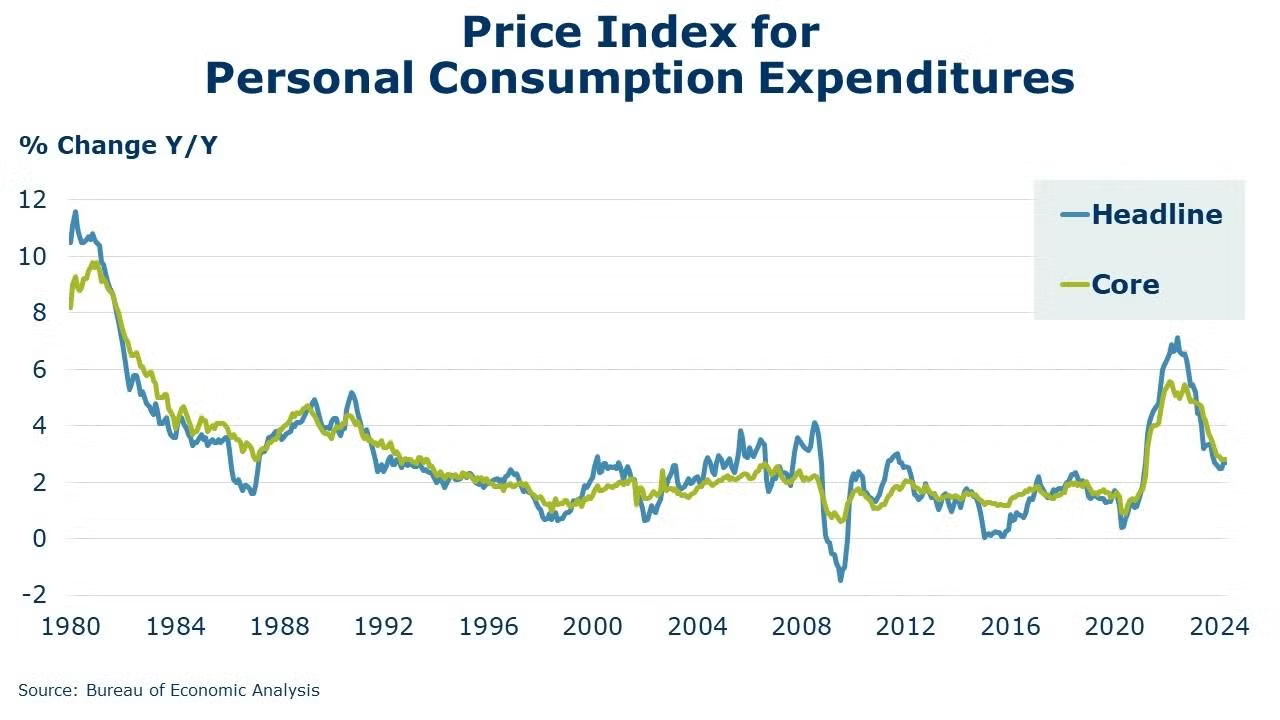
Growth in consumer spending slowed in April to a 0.2% gain. April’s modest increase follows large gains of 0.7% in both February and March. Because of the early timing of Easter and many spring breaks this year, some spending may have been pulled into March. In April, a decline in spending on goods was offset by continued gains in spending on services. Disposable personal income (DPI) also rose by 0.2%. After taking inflation into account, both real DPI and real consumer spending eased slightly. Compared to a year ago, real consumer spending was up 2.6% while real DPI was up 1.0% Y/Y. The annual growth in the price index for personal consumption expenditures (PCE) remained steady at 2.7% while the Fed’s preferred core PCE price index remained ahead by 2.8% Y/Y for a third consecutive month. With many consumers still confident in the labor market, the savings rate remained steady at 3.6%.
Following three consecutive months of declines, the Conference Board’s Consumer Confidence Index® rose by 4.5 points in May to 102.0. While present conditions and expectations were higher than last month, consumers remain anxious about the future. Inflation expectations ticked up and the survey also revealed an increase in consumers’ concerns about a recession over the next 12 months. On a six-month moving average basis, purchasing plans for homes were unchanged in May at their lowest level since August 2012. While still relatively depressed, buying plans for autos rose slightly for a second month, and buying plans for most big-ticket appliances increased for the first time in several months. Meanwhile, buying plans for electronics products were largely unchanged except for smartphones, which saw renewed interest.
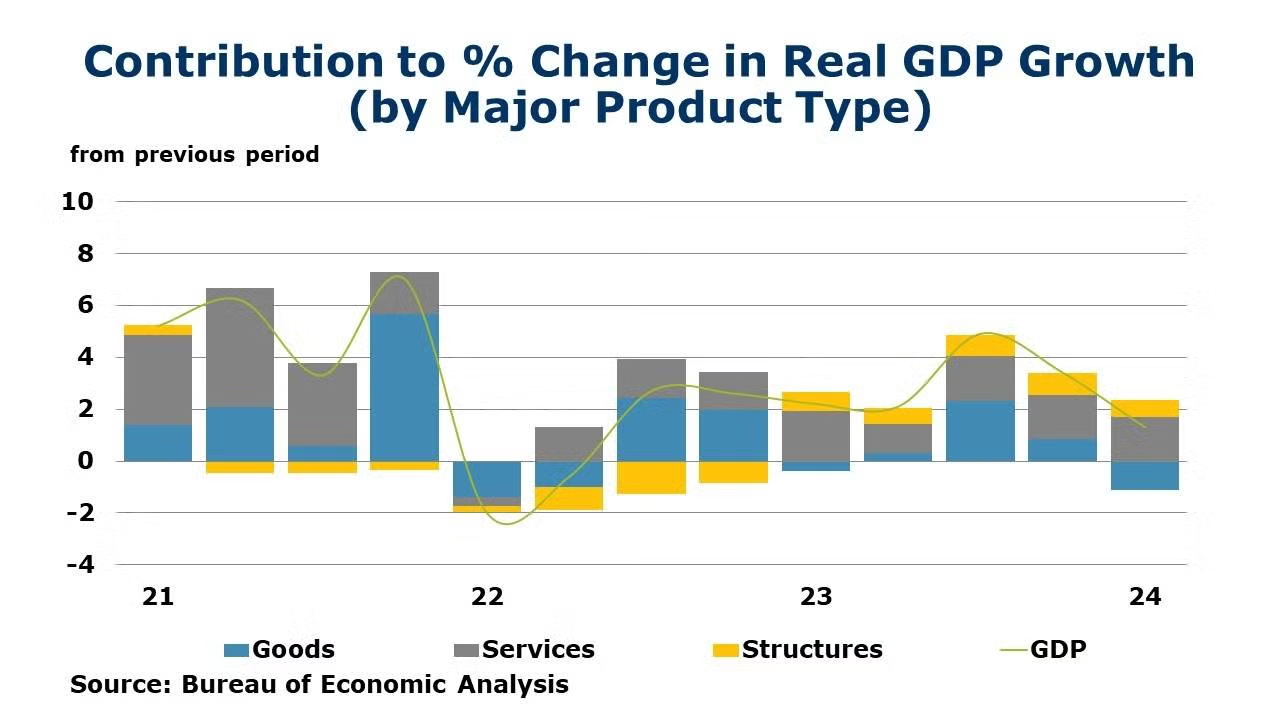
The BEA’s second estimate of Q1 GDP growth came in at 1.3% on a seasonally adjusted annual rate (SAAR). Compared to last month’s advance estimate, there were downward revisions to consumer spending, government consumption and inventory investment that were only partially offset by upward revisions to state and local government spending, fixed investment (both nonresidential and residential).
Fed Beige Book
A compilation of anecdotal information on the regional economies in the 12 districts, the Beige Book is published eight times per year. Interesting excerpts follow here:
- National economic activity continued to expand from early April to mid-May; however, conditions varied across industries and Districts.
- Most Districts reported slight or modest growth, while two noted no change in activity.
- Retail spending was flat to up slightly, reflecting lower discretionary spending and heightened price sensitivity among consumers.
- Auto sales were roughly flat, with a few Districts noting that manufacturers were offering incentives to spur sales.
- Travel and tourism strengthened across much of the country, boosted by increased leisure and business travel, but hospitality contacts were mixed in their outlooks for the summer season.
- Activity in transportation services was mixed, as port and rail activity increased whereas reports of trucking and freight demand varied.
- Manufacturing activity was widely characterized as flat to up, though two Districts cited declines.
- Tight credit standards and high interest rates continued to constrain lending growth.
- Housing demand rose modestly, and single-family construction increased, though there were reports of rising rates impacting sales activity.
- Conditions in the commercial real estate sector softened amid supply concerns, tight credit conditions, and elevated borrowing costs.
- Energy activity was largely stable, whereas agricultural reports were mixed, as drought conditions eased in some Districts, but farm finances/incomes remained a concern.
- Overall outlooks grew somewhat more pessimistic amid reports of rising uncertainty and greater downside risks.
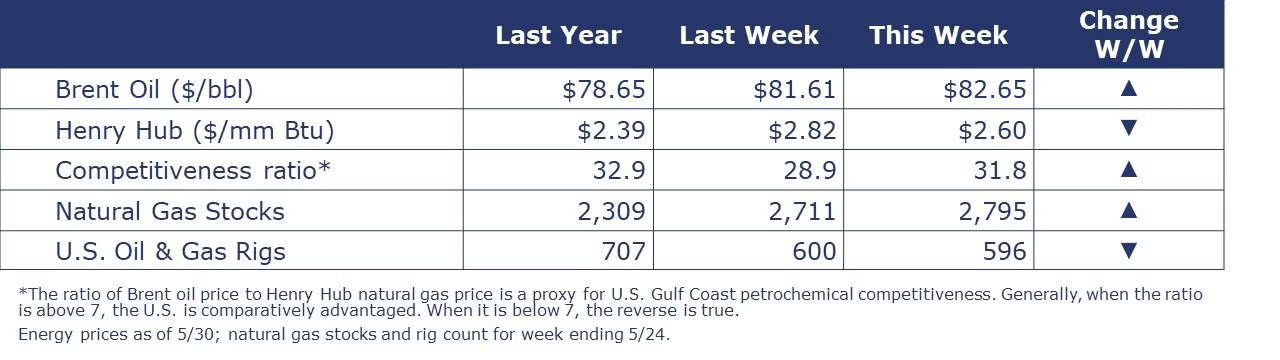
Oil prices were slightly higher than a week ago in anticipation of the OPEC+ meeting this weekend to review its production quotas. U.S. natural gas eased a little this week due to cooler weather and expectations that production levels will rise this summer. This is despite the gas-directed rig count falling to below 100 for the first time since 2021. Of the 600 or so gas rigs, only 99 were active at the end of last week. Adding in the 497 oil-directed rigs, the combined oil and gas rig count fell by four to 596 during the week ending May 24th.
Indicators for the business of chemistry bring to mind a yellow banner.
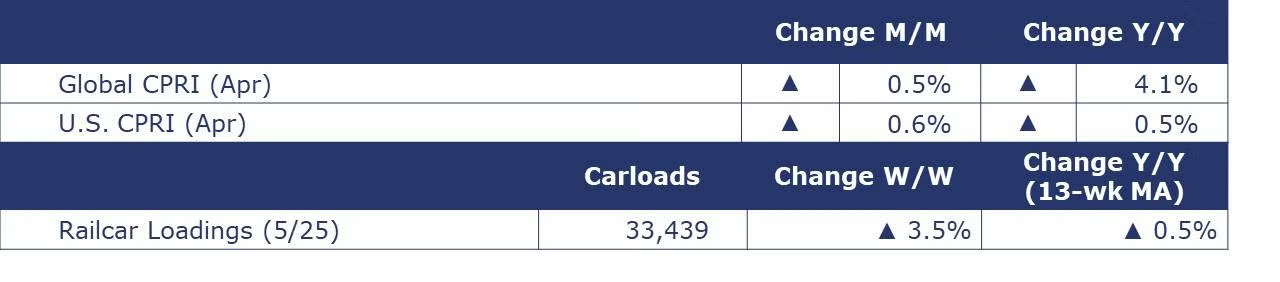
According to data released by the Association of American Railroads, chemical railcar loadings were up to 33,439 for the week ending May 25th. Loadings were up 0.5% Y/Y (13-week MA), up (4.0%) YTD/YTD and have been on the rise for seven of the last 13 weeks.
Chemical Industry Details from the Beige Book
- In the Sixth District (Atlanta), “railroads saw gains in automotive, chemicals, forest products and minerals freight volumes, as well as growing momentum in intermodal shipments.” In addition, “petrochemical manufacturers reported continued progress in carbon capture and storage projects.”
- In the Eleventh District (Dallas), “Food and chemical manufacturers noted a rise in demand, and Gulf Coast producers led year-over-year growth in U.S. industrial chemical output.” In addition, “Chemical producers also noted a weak Chinese economy as a risk.”
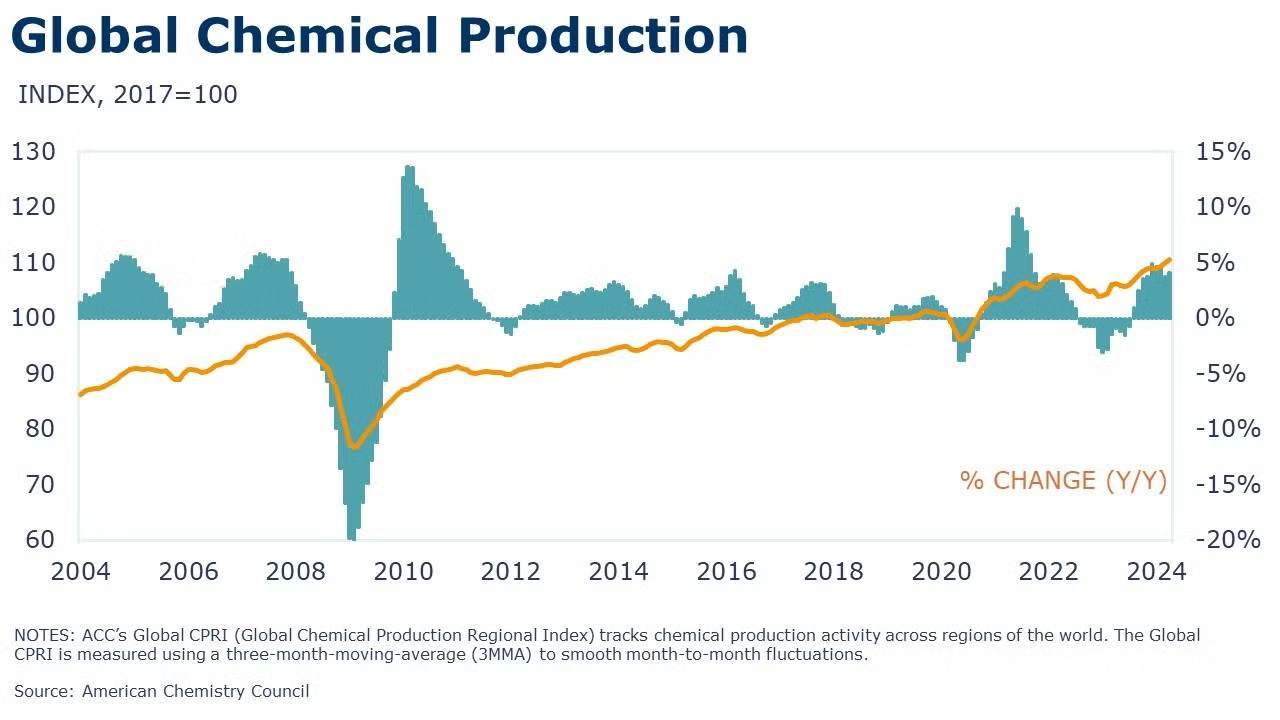
Following a 0.5% gain in March, ACC’s Global Chemical Production Regional Index (Global CPRI) rose by another 0.5% in April. Growth was observed in all regions, with significant contributions from the U.S., China, Japan, Korea, Germany, and Italy. All segments grew with agricultural chemicals gaining the most and accelerating. Global chemicals production growth was up 4.1% Y/Y.
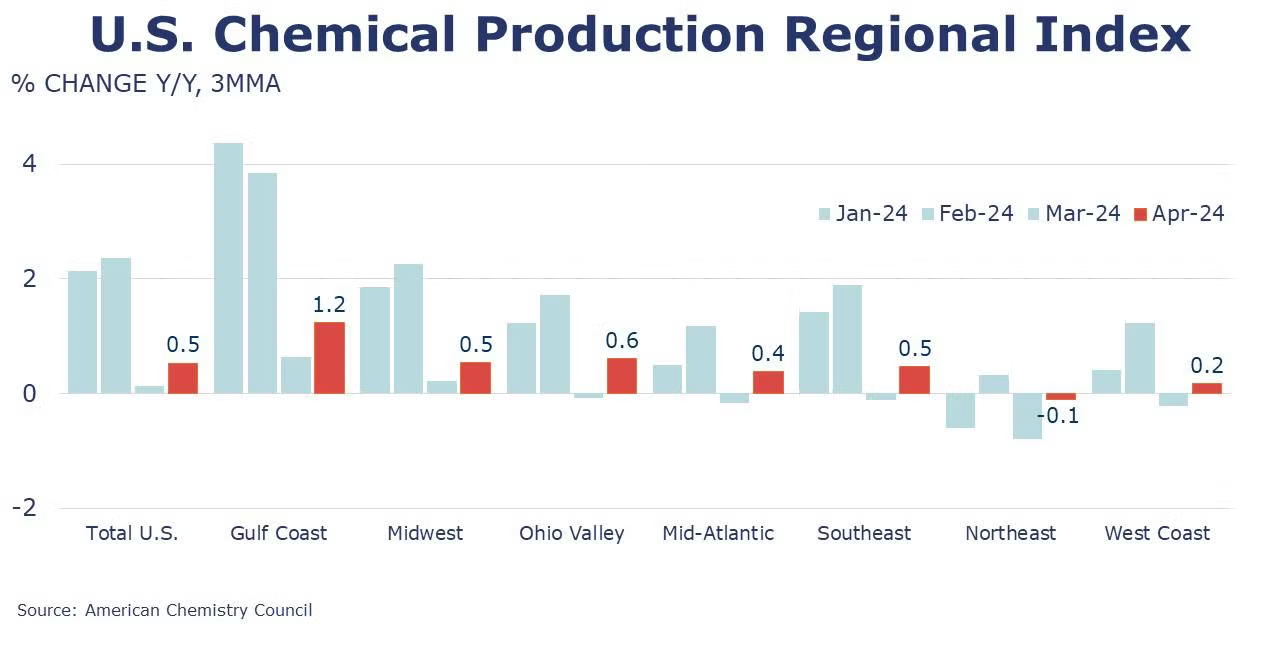
The U.S. CPRI rose 0.6% in April, the third monthly gain in a row. The U.S. CPRI measures chemical production trends on a three-month moving average (3MMA) to smooth month-to-month volatility. Chemical production was higher across all regions in April. The strongest gains were in the Gulf Coast and Northeast regions. Compared to a year ago, the U.S. CPRI was up 0.5%, the fifth consecutive positive annual comparison. Compared to a year ago, chemical production was trending higher across all regions, except the Northeast which was still slightly lower than April 2023.
Note On the Color Codes
Banner colors reflect an assessment of the current conditions in the overall economy and the business chemistry of chemistry. For the overall economy we keep a running tab of 20 indicators. The banner color for the macroeconomic section is determined as follows:
Green – 13 or more positives
Yellow – between 8 and 12 positives
Red – 7 or fewer positives
There are fewer indicators available for the chemical industry. Our assessment on banner color largely relies upon how chemical industry production has changed over the most recent three months.
For More Information
ACC members can access additional data, economic analyses, presentations, outlooks, and weekly economic updates through ACCexchange.
In addition to this weekly report, ACC offers numerous other economic data that cover worldwide production, trade, shipments, inventories, price indices, energy, employment, investment, R&D, EH&S, financial performance measures, macroeconomic data, plus much more. To order, visit http://store.americanchemistry.com/.
Every effort has been made in the preparation of this weekly report to provide the best available information and analysis. However, neither the American Chemistry Council, nor any of its employees, agents or other assigns makes any warranty, expressed or implied, or assumes any liability or responsibility for any use, or the results of such use, of any information or data disclosed in this material.
Contact us at ACC_EconomicsDepartment@americanchemistry.com.

