Running tab of macro indicators: 15 out of 20
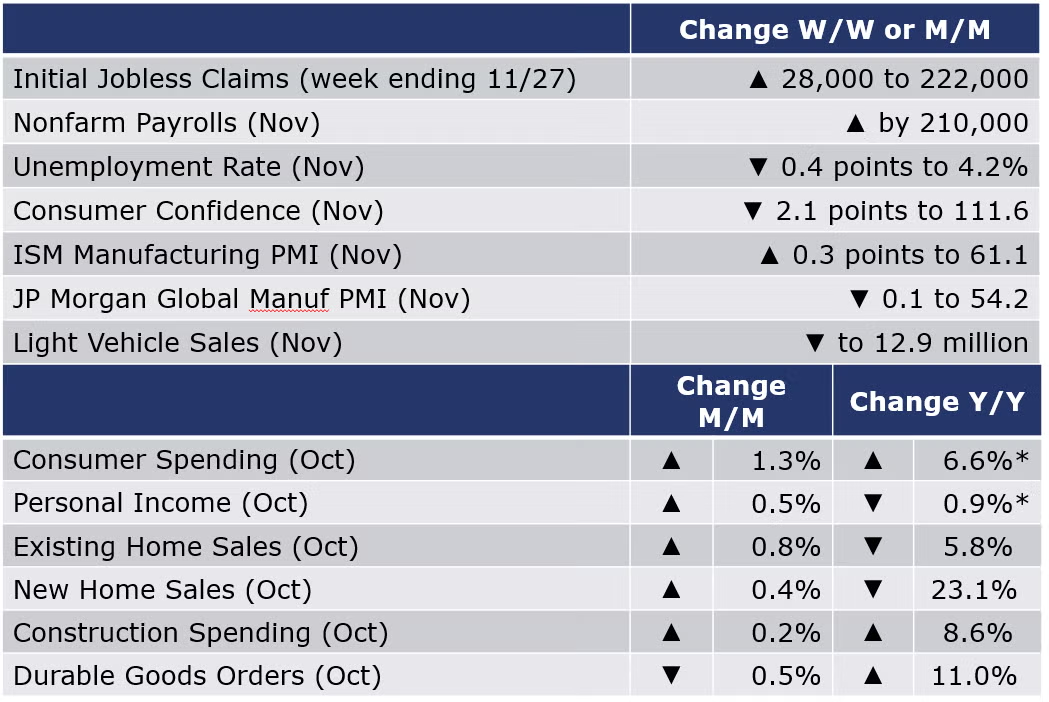
Reflecting ongoing friction in labor markets, growth in nonfarm payrolls slowed as the U.S. economy added 210,000 jobs in November, less than half the anticipated gain. November’s gain follows a 546,000 gain in October and an increase of 379,000 in September. There were gains across nearly all major sectors except retail trade, state & local government (including schools), and mining & logging. The manufacturing sector added 31,000 jobs. The average hourly wage for all workers rose 4.8% Y/Y. In the separate household survey, the unemployment rate fell by 0.4 points to 4.2% in November reflecting large gains in employment, inconsistent with the generally more reliable establishment survey (cited above). The participation rate edged up to 61.8% in November. The participation rate remains 1.5 points lower than prior to the pandemic, however, as many who left the labor force have been reluctant to re-enter.
The number of new jobless claims rose by 28,000 to 222,000 during the week ending 27 November. The previous week, claims had fallen to a 52-year low of 194,000. Continuing claims decreased by 107,000 to 1.96 million, and the insured unemployment rate for the week ending 20 November edged lower to 1.4%.
Consumer spending surged in October, up by 1.3% with strong spending in goods and a solid gain in services. Personal income also rose, by 0.5%. That follows a 1.0% decline in September as enhanced unemployment benefits programs ended. The savings rate eased to 7.3% which is comparable to pre-pandemic rates of savings. Inflation, as measured by the PCE deflator, also continued to accelerate and was up 5.0% Y/Y. Excluding food and energy, prices were up 4.1% Y/Y. Both measures showed the highest pace of inflation in three decades.
Following an October increase, consumer confidence declined in November, down 2.1 points to 109.5. The report noted that the share of consumers planning to purchase homes, automobiles, and major appliances decreased during the month, although, overall, confidence remains relatively high suggesting that economic expansion is likely to continue into the new year.
Existing home sales rose for a second straight month in October, up by 0.8%. Compared to a year ago, existing home sales were up by 5.8%. Median sales prices continued to advance, up 13.1% Y/Y. Inventories at the end of the month fell by 0.8% resulting in a 2.4-month supply, the same as the previous month and down just slightly from a 2.5-month pace in October 2020. Existing home sales are on track for their best year in 15 years. New home sales also moved higher in October, up by 0.4%. Inventories at the end of the month rose and at the current sales pace represent a 6.3-month supply, up from 6.1 months in September and 3.5 months in October 2020. Compared to a year ago, new home sales were off 23.1% Y/Y.
Construction spending edged higher in October, up by 0.2%. Following gains throughout much of the past year, spending on residential projects fell for a second straight month. Spending on private nonresidential projects rose 0.2% and spending on public projects was up 1.8%. Compared to a year ago, construction spending was up 8.6%.
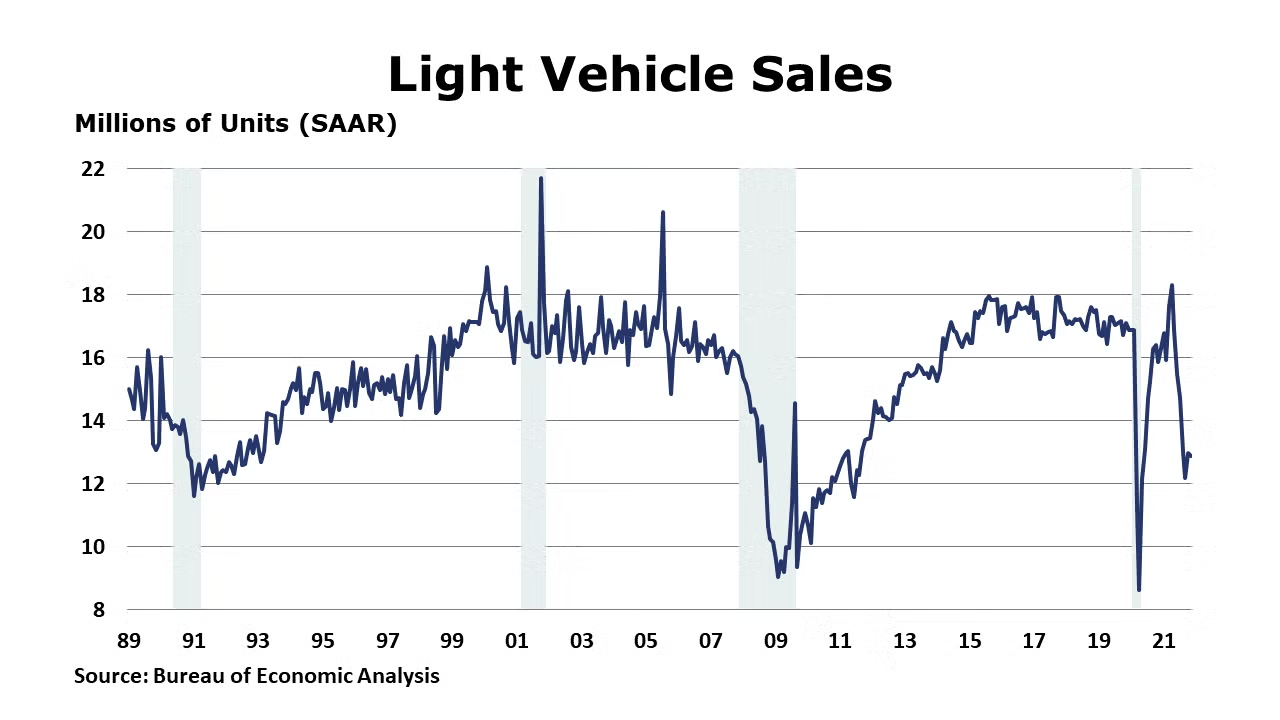
Supply chain issues continue to weigh on auto producers. Light vehicle sales eased slightly, down from a 13.0 million unit seasonally adjusted pace in October to a 12.9 million unit pace in November. Sales of light trucks ticked lower while passenger car sales were essentially flat.
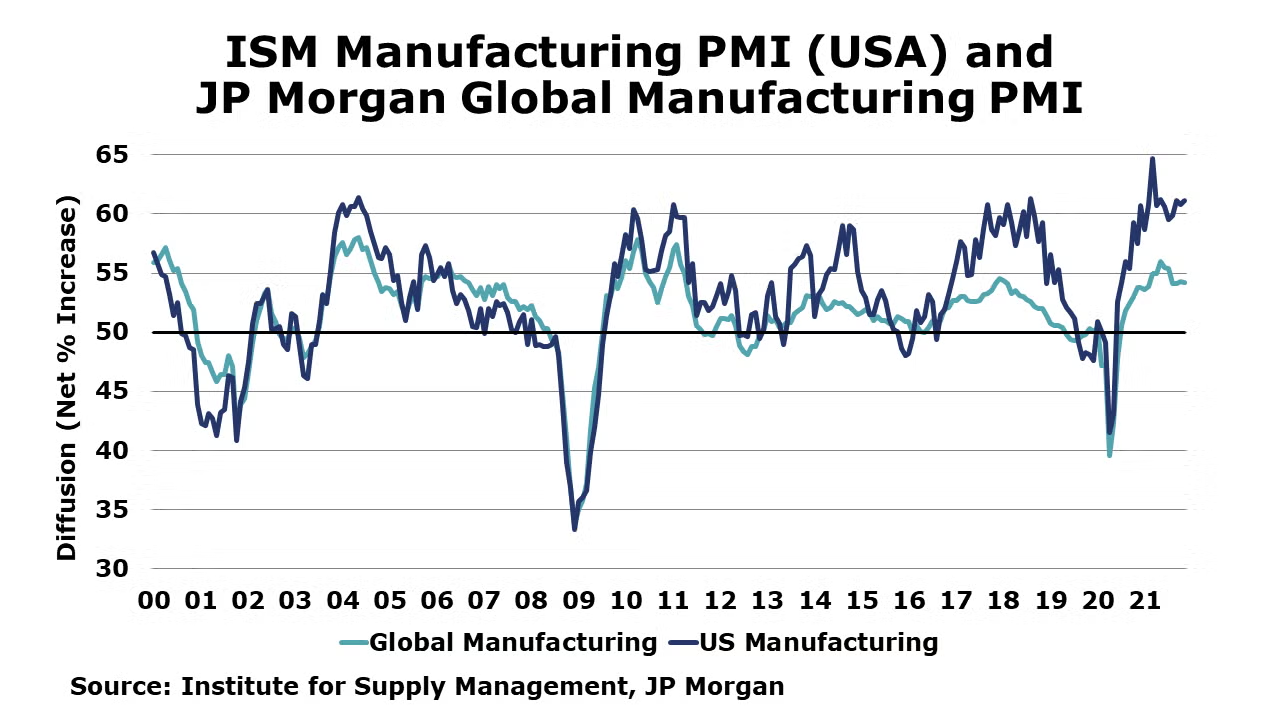
The ISM’s Manufacturing Purchasing Managers Index (PMI) rose 0.3 points in November to 61.1 with most industries posting growth during the month. Readings above 50 indicate expansion. New orders, production, and employment continued to expand at a faster pace, while inventories and new export orders expanded at a slower pace. Supplier delivery times continued to slow, but at a slower pace. The average lead time for production materials remained at a record high of 96 days while lead times for capital expenditures rose to a new record 160 days. The report suggests that manufacturing activity remained robust, but supply constraints remain. The JP Morgan Global Manufacturing PMI edged lower by 0.1 points to 54.2 in November, suggesting the global manufacturing sector continued to expand at a slightly slower rate. Readings from four of the 30 nations indicated manufacturing contracted last month, including China, Brazil, Mexico, and Myanmar.
Durable goods orders eased for a second month in October, down by 0.5%. Declines in orders for aircraft, computers, and machinery were offset by rising orders in motor vehicles, electrical equipment, communications equipment, and metals. Core business orders were up by 0.6%, the eighth consecutive gain. Compared to a year ago, headline orders were up by 11.0% while core business orders were up 11.9% Y/Y.
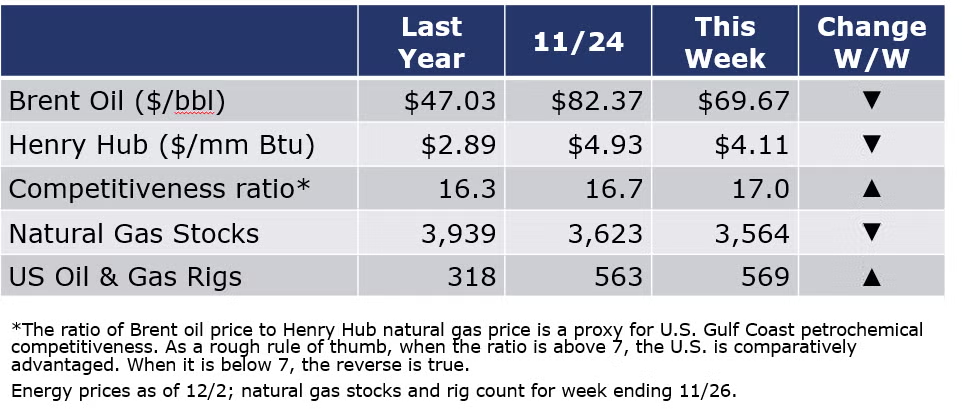
Oil prices continued to move lower during the week as the emergence of the Omicron variant created concerned about the global recovery. Natural gas prices also declined. The combined oil and gas rig count rose by six to 569 during the week ending 26 November. The winter heating season has started as natural gas inventories fell for a second week, down by 59 BCF.
For the business of chemistry, the indicators still bring to mind a yellow banner for basic and specialty chemicals.
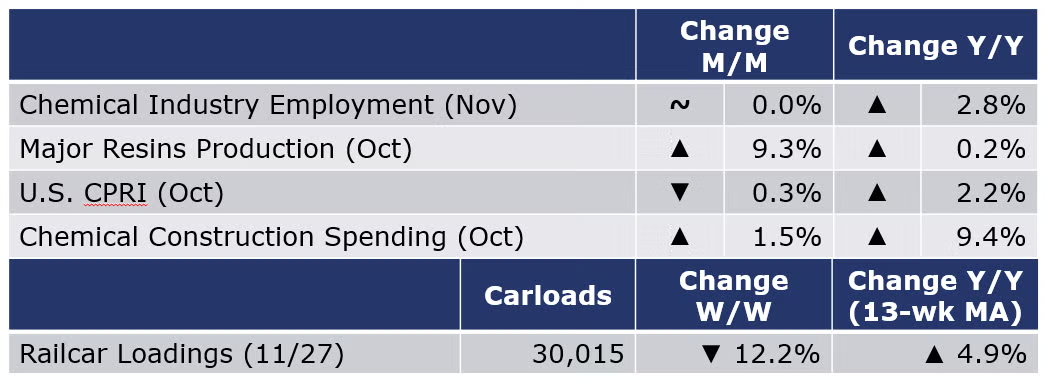
According to data released by the Association of American Railroads, chemical railcar loadings, the best ‘real time’ indicator of chemical industry activity, fell by 4,159 (12.2%) to 30,015 railcars during the week ending 27 November (week 47, which included the Thanksgiving holiday). Loadings were up 4.9% Y/Y, up 5.6% YTD/YTD and have been on the rise for 7 of the last 13 weeks.
The ISM Manufacturing PMI reported that the chemical industry was among the industries that posted growth in November. New orders, production, and backlogs expanded at moderate-to-strong levels. Chemical industry employment and inventories expanded while supplier deliveries were slower. Customer inventories continued to be deemed too low. Among the comments from a chemical producer, “Petrochemical supply chain is slowly showing signs of improvement after multiple weather disruptions in 2021.” A respondent in the plastics & rubber products sector noted that during November they were “starting to notice improvement in availability/lead time [for resins].”
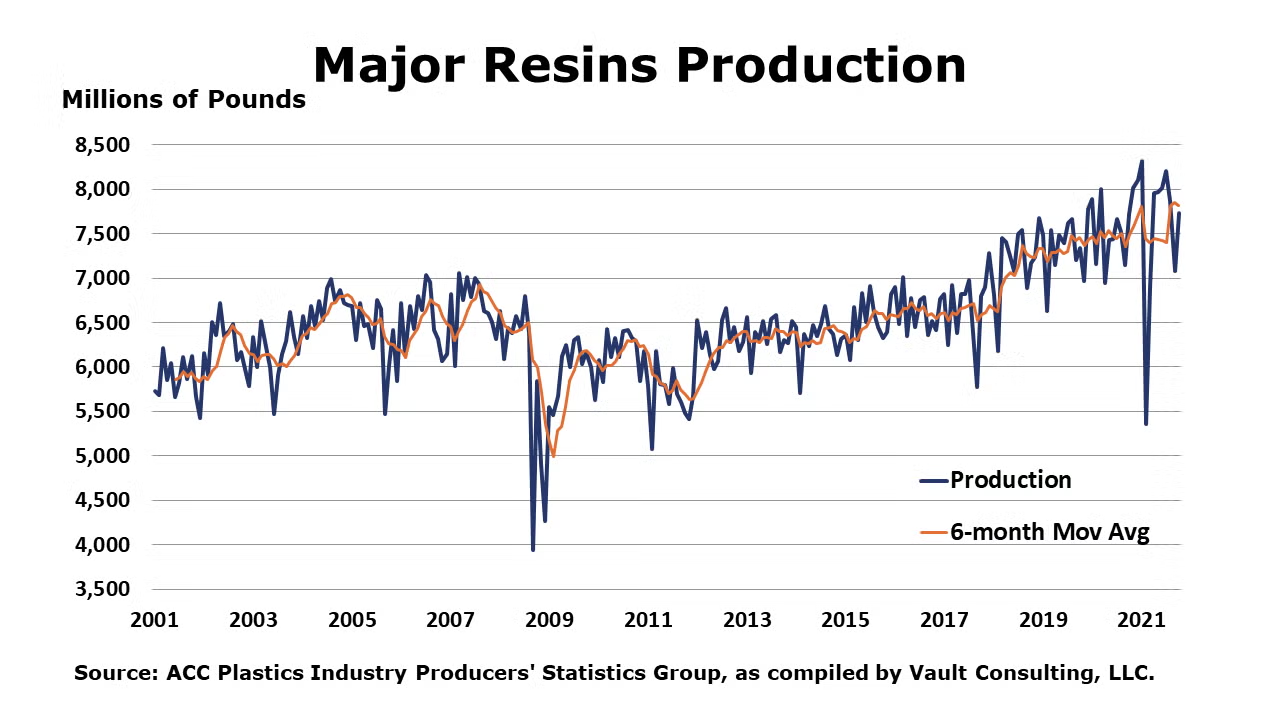
U.S. production of major plastic resins totaled 7.8 billion pounds during October 2021, up 9.3% compared to the prior month, and up 0.2% compared to the same month in 2020, according to statistics released by ACC. Year-to-date production was 75.5 billion pounds, a 0.7% increase Y/Y. Sales and captive (internal) use of major plastic resins totaled 7.4 billion pounds, up 4.0% percent compared to the prior month, and down 0.2% Y/Y. Year-to-date sales and captive use were 74.2 billion pounds, down 2.3% Y/Y.
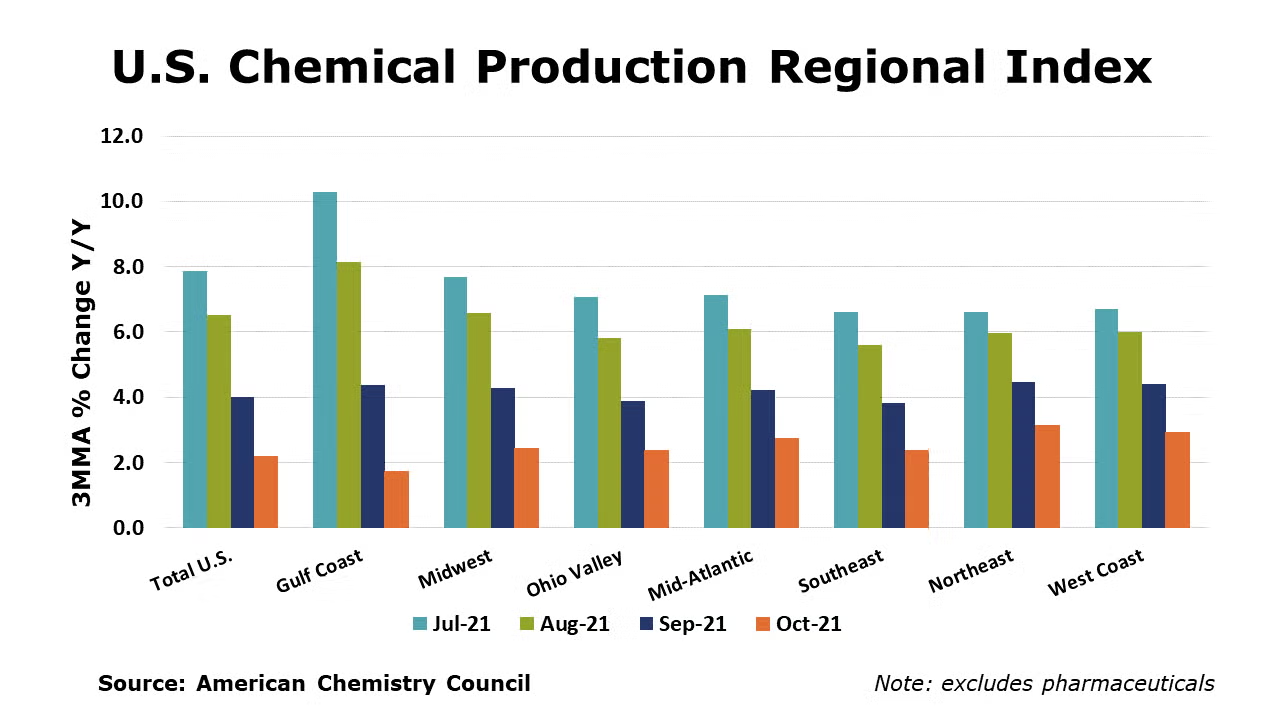
The U.S. Chemical Production Regional Index (U.S. CPRI), which is measured as a three-month moving average (3MMA), eased by 0.3% in October following a 1.6% decline in September and a 0.4% decline in August. Chemical output declined in all other regions, except the Northeast. With lingering hurricane and other supply chain disruptions, the largest decline was in the Gulf Coast. Compared with October 2020, U.S. chemical production was ahead by 2.2%, a weaker comparison than last month, due to lingering impacts from Hurricane Ida. Chemical production continued to be higher than a year ago in all regions, however.
Chemical production, as measured on 3MMA basis, was mixed in October with an improving trend in the production of synthetic rubber, manufactured fibers, other specialty chemicals, fertilizers, adhesives, coatings, and consumer products. These gains were offset, however, by weakness in organic chemicals, plastic resins, basic inorganic chemicals, industrial gases, and crop protection chemicals.
As nearly all manufactured goods are produced using chemistry in some form, manufacturing activity is an important indicator for chemical demand. Manufacturing output continued edged higher for a sixth consecutive month in October, by 0.1% (on a 3MMA basis). The 3MMA trend in manufacturing production was mixed with gains in the output of food & beverages, aerospace, construction supplies, fabricated metal products, machinery, computers, semiconductors, refining, iron & steel products, plastic products, rubber products, tires, paper, printing, apparel and furniture.
Chemical employment (including pharmaceuticals) was flat in November. Production workers rose by 2,000, while the number of supervisory and non-production workers was lower the same number. Compared to a year ago, chemical employment was up by 23,200 (2.8%). Average wages for production workers rose 3.5% Y/Y to $26.79. The total labor input was higher for the month, consistent with the ISM report that suggested the chemical industry expanded in November.
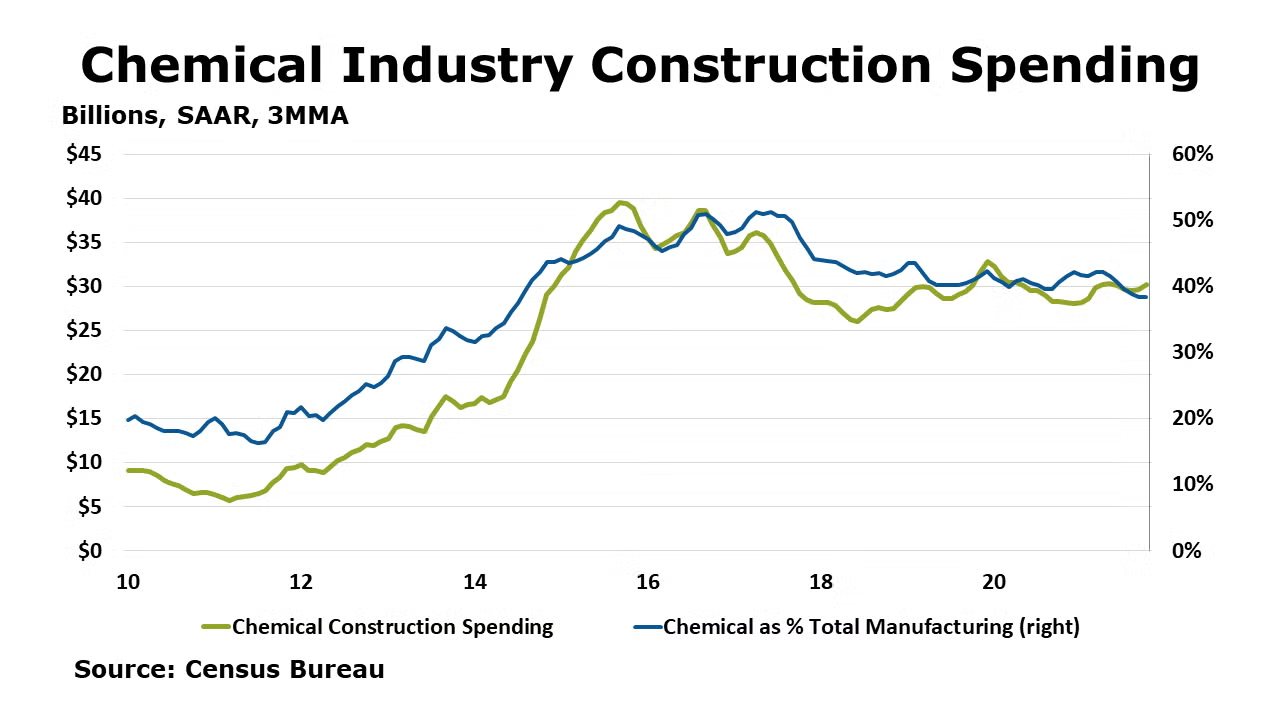
Chemical construction spending rose in October for a third consecutive month, up by 1.5%. Compared to a year ago, construction spending on chemical manufacturing projects was up 9.4% Y/Y. As a share of total construction spending on manufacturing projects, chemicals represented nearly 39%.
Following the announcement of the new Omicron variant, the benchmark S&P 500 index ended the month lower by 0.6% in November. Chemical equity prices, as measured by the S&P index for chemical companies also eased, off 0.8% for the month. Equity prices are often a good indicator of future activity and represent one component of the leading economic indicators. Compared to the beginning of the year, chemical equities were up 15.7% while the S&P 500 index was up 21.6% year-to-date.
Note On the Color Codes
The banner colors represent observations about the current conditions in the overall economy and the business chemistry. For the overall economy we keep a running tab of 20 indicators. The banner color for the macroeconomic section is determined as follows:
Green – 13 or more positives
Yellow – between 8 and 12 positives
Red – 7 or fewer positives
For the chemical industry there are fewer indicators available. As a result we rely upon judgment whether production in the industry (defined as chemicals excluding pharmaceuticals) has increased or decreased three consecutive months.
For More Information
ACC members can access additional data, economic analyses, presentations, outlooks, and weekly economic updates through MemberExchange.
In addition to this weekly report, ACC offers numerous other economic data that cover worldwide production, trade, shipments, inventories, price indices, energy, employment, investment, R&D, EH&S, financial performance measures, macroeconomic data, plus much more. To order, visit http://store.americanchemistry.com/.
Every effort has been made in the preparation of this weekly report to provide the best available information and analysis. However, neither the American Chemistry Council, nor any of its employees, agents or other assigns makes any warranty, expressed or implied, or assumes any liability or responsibility for any use, or the results of such use, of any information or data disclosed in this material.
Contact us at ACC_EconomicsDepartment@americanchemistry.com


