Running tab of macro indicators: 18 out of 20
Reflecting ongoing friction in labor markets, growth in nonfarm payrolls slowed as the U.S. economy added 199,000 jobs in December, just under November’s gain. There were gains across nearly all major sectors except retail trade, utilities, and government. The manufacturing sector added 26,000 jobs. The average hourly wage for all workers rose 4.7% Y/Y. In the separate household survey, the unemployment rate fell by 0.3 points to 3.9% in December reflecting gains in employment, inconsistent with the generally more reliable establishment survey (cited above). The participation rate remained unchanged at 61.9% in December. The participation rate remains 1.5 points lower than prior to the pandemic, however, as many who left the labor force have been reluctant to re-enter.
The U.S. trade deficit in goods and services rose by $13.0 billion to a record $80.2 billion in November. Exports rose by $0.4 billion to $224.2 billion, while imports surged by $13.4 billion to $304.4 billion. Exports of capital goods and industrial supplies & materials declined while there were gains in imports of industrial supplies & materials, consumer goods, and vehicles & parts.
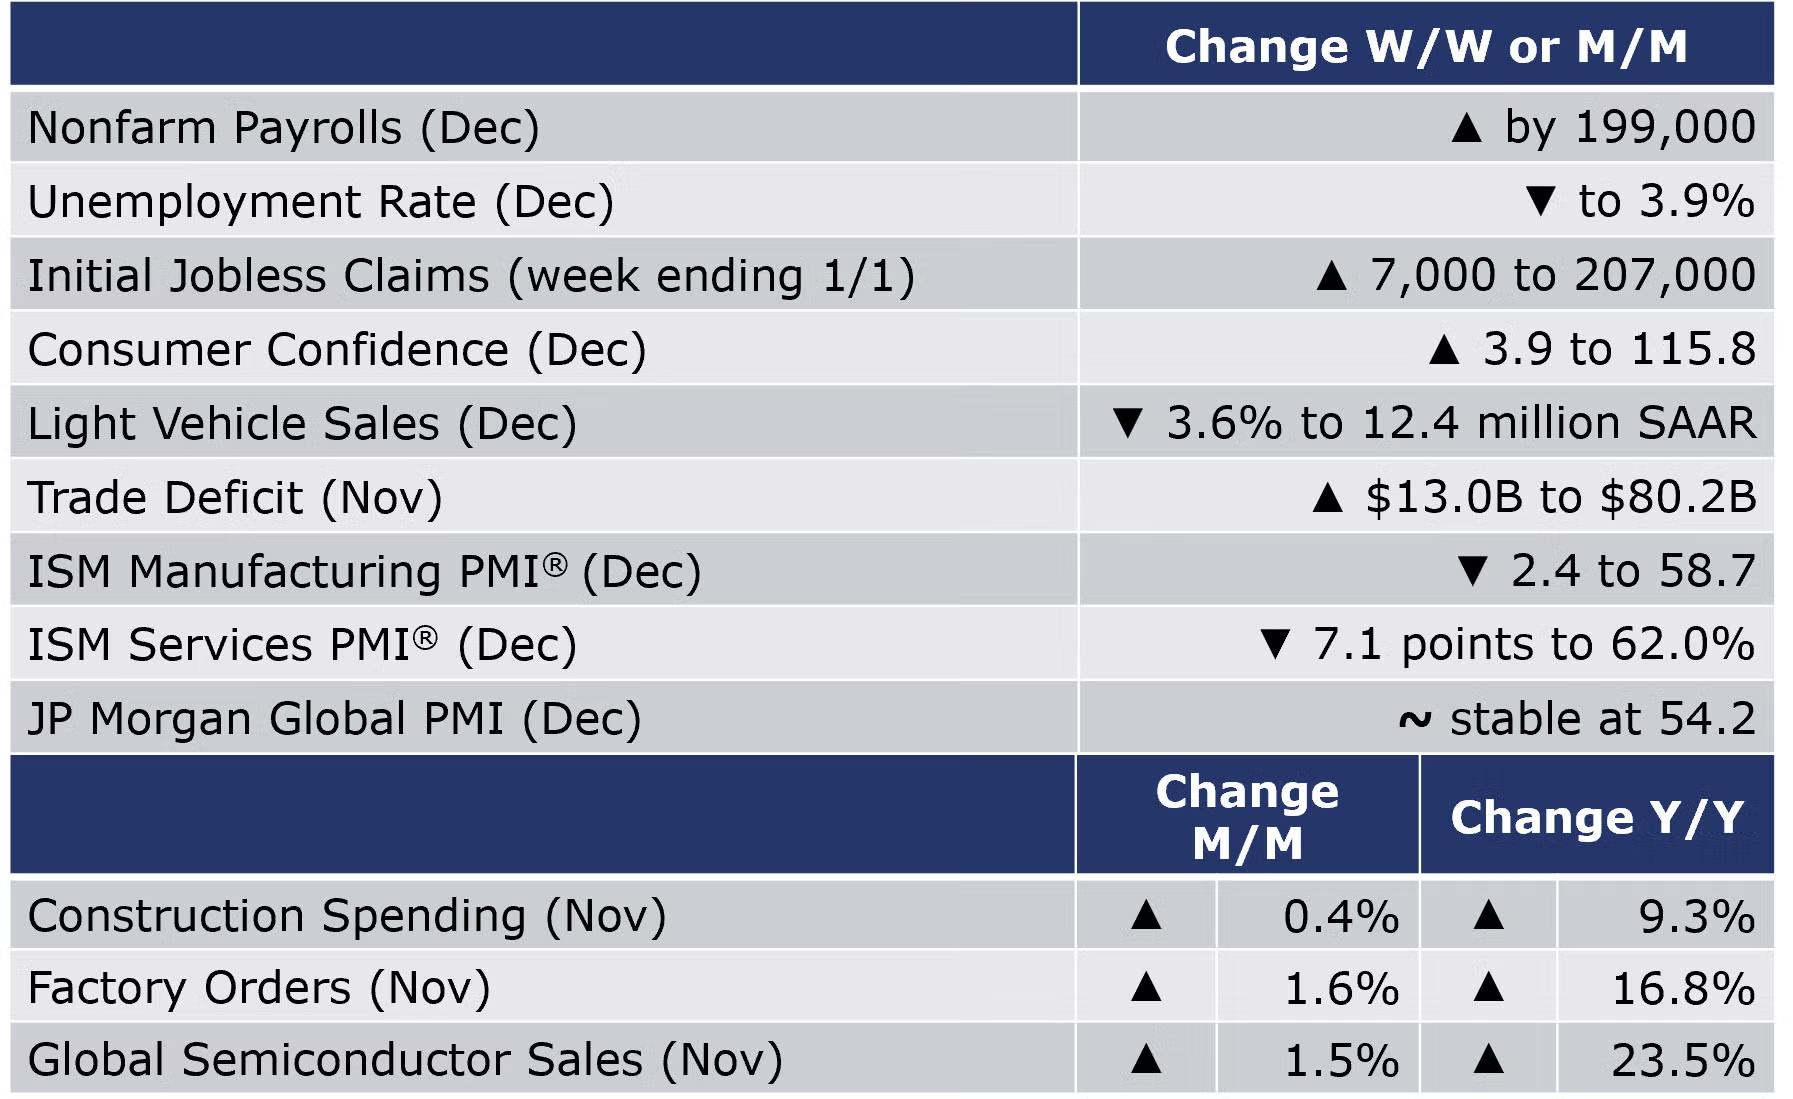
The number of new jobless claims was up by 7,000 to 207,000 during the week ending 1 January. Continuing claims decreased by 8,000 to 1.754 million, and the insured unemployment rate for the week ending 25 December was unchanged at 1.3%.
Despite Omicron, consumer confidence improved in December, up by 3.9 points to 115.8. Expectations about growth prospects going into 2022 improved with an increasing share of consumers planning to purchase homes, automobiles, and appliances over the next six months.
Led by a strong gain in the residential segment, construction spending continued to expand, up by 0.4% in November. Spending on private residential projects rebounded, while spending on privately-funded nonresidential projects edged higher. Publicly-funded construction edged lower for the first time since May. Compared to a year ago, the value of overall construction spending was up 9.3% Y/Y.
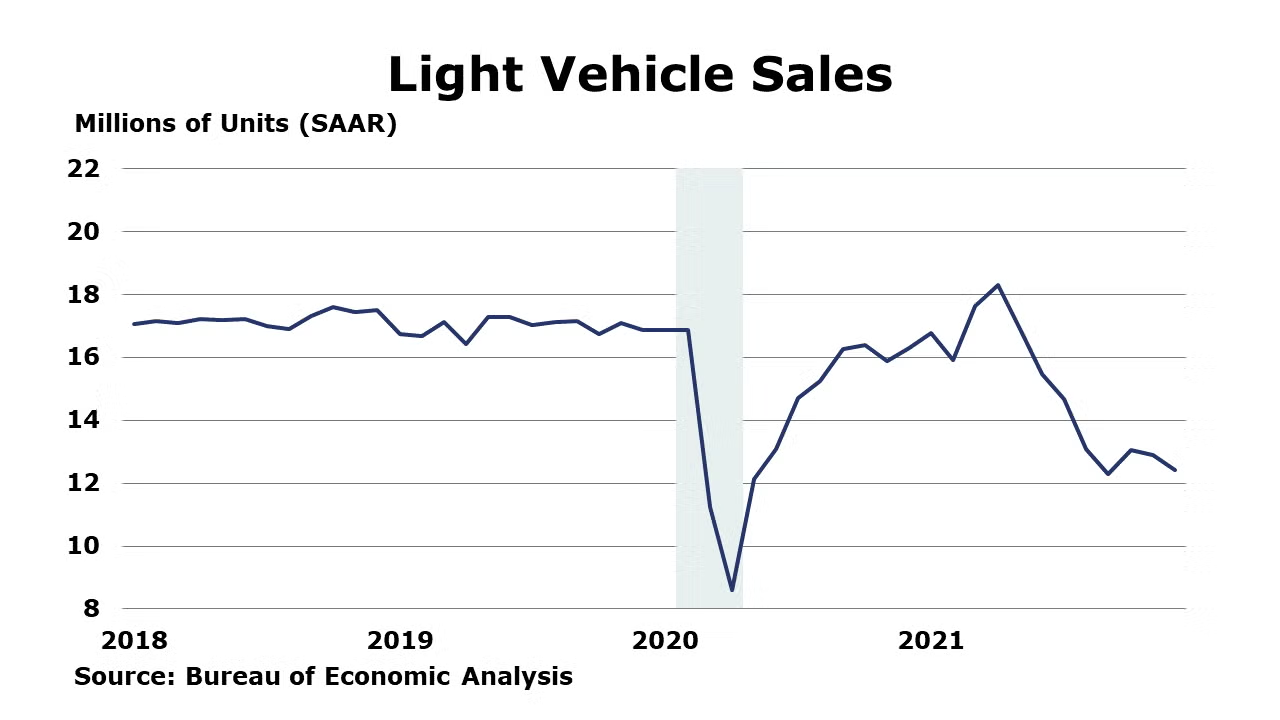
Light vehicle sales ended 2021 on a down note, falling from a 12.9-million-unit seasonally adjusted pace in November to a 12.4-million-unit pace in December. December sales were down 24% compared to the final month of last year. Sales of light trucks ticked lower (by 4.2%) while passenger car sales fell slightly (by 1.2%). For the year as a whole, U.S. light vehicle sales came in just shy of 15.0 million, up from 14.4 million in 2020. Toyota outsold GM in the U.S. market for the first time in 2021, reflecting, in part, the semiconductor chip shortage that has plagued automakers this past year.
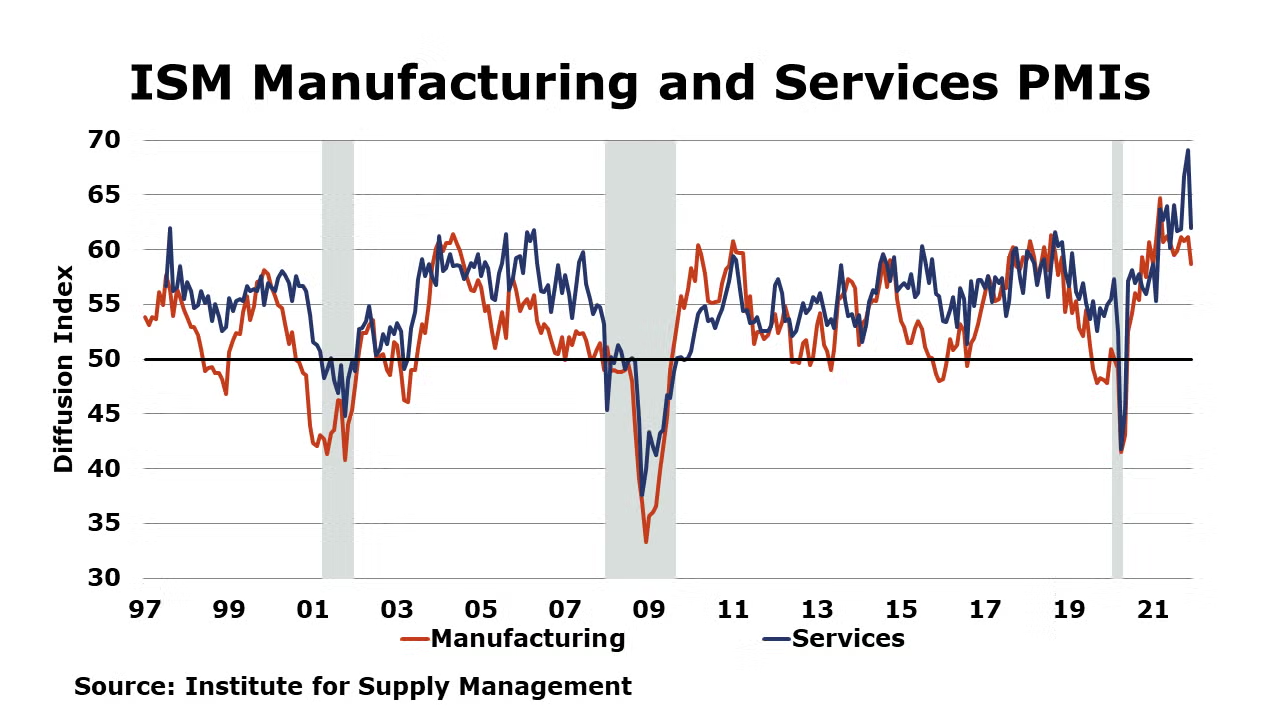
The ISM’s Manufacturing Purchasing Managers Index® (PMI) fell 2.4 points in December to 58.7 with most industries (including chemicals) posting moderate-to-strong growth during the month. Readings above 50 indicate expansion. While December marks the 19th consecutive month of expansion, the pace has moderated. New orders, production, supplier deliveries, inventories and customer inventories growth has slowed. Prices continued to increase in December, but the pace of growth slowed. Employment growth was faster. Supply chain challenges continue and are constraining U.S. manufacturing. COVID pandemic-related global issues also continue to impact manufacturing. The JP Morgan Global Manufacturing PMI held steady for the third month in a row at 54.2 in December. This suggests the global manufacturing sector continued to expand through the end of 2021. Readings from four of the 30 nations--Brazil, Thailand, Mexico, and Myanmar--indicated manufacturing contracted last month; China’s reading returned to growth.
The ISM Services PMI® also fell in December, down 7.1 points from its all-time high to 62.0. Business activity and new orders continued to expand at a slower pace. The supplier deliveries component fell sharply reflecting that supply chain constraints worsened at a slower pace at the end of the year. Several respondents continue to comment that “port congestion continues to delay product deliveries” and “shortage of raw materials is adding weeks to some orders”.
Factory orders continued to expand in November, up 1.6%. The largest gains were in civilian communications & electronics equipment, HVAC, material handling equipment, civilian aircraft, ships & boats, and foundries. Orders for core business goods were essentially flat, following eight months of gains. Manufacturing shipments were up by 0.7% and inventories also rose by 0.7%. Compared to a year ago, shipments were up 14.7% while inventories were up by 9.2% Y/Y. The inventories-to-shipments ratio remained steady at 1.46, compared to last month. A year ago, the ratio was 1.51.
Global semiconductor sales rose by 1.5% in November with gains across all regions except China, which fell slightly (-0.2%). Much of the monthly gain was driven by growth in Europe and the Americas. Compared to a year ago, global sales were up 23.5%.
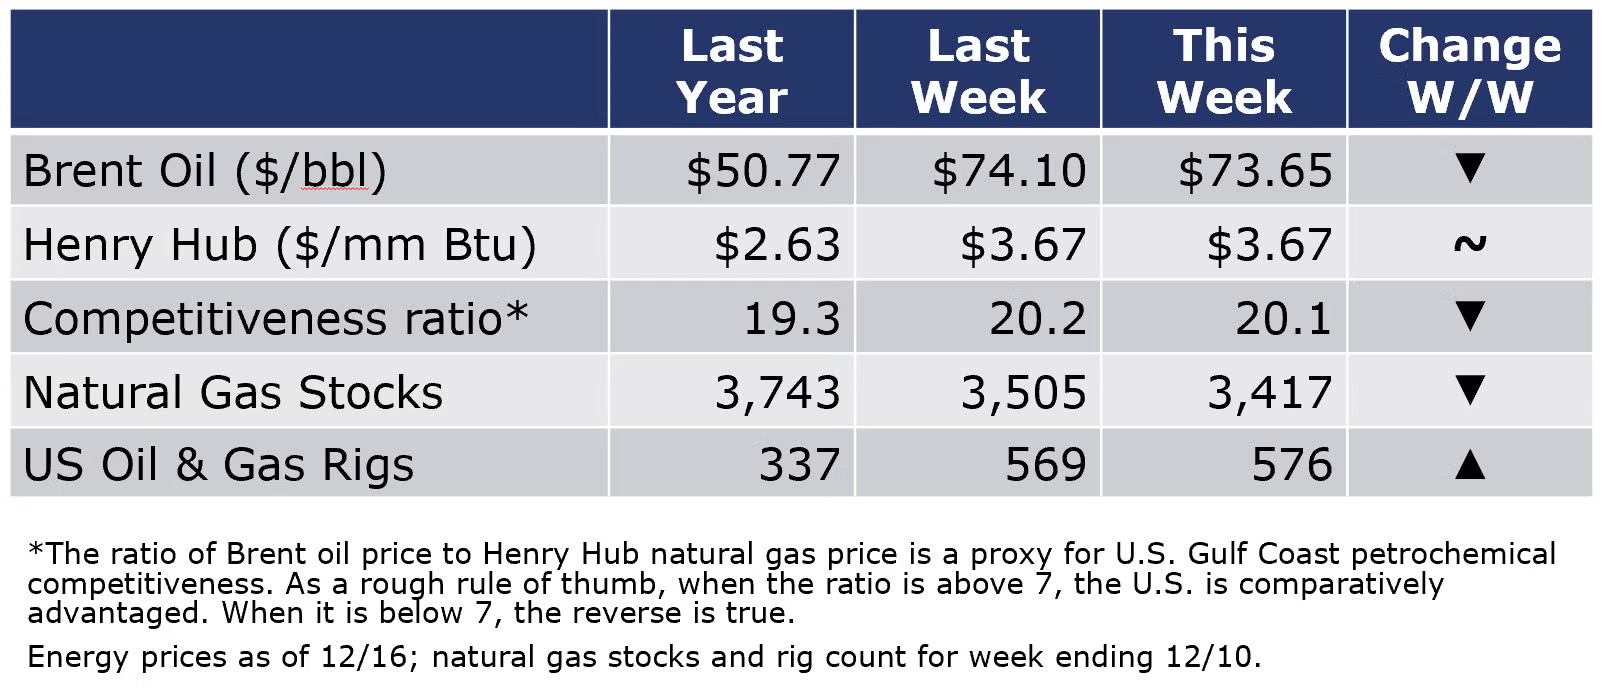
The combined oil and gas rig count was steady at 586 during the week ending 1 January. Oil prices moved higher during the week reflecting the unrest in oil-rich Kazakhstan and outages to Libyan supplies. Natural gas prices moved lower in the U.S. on improved storage projections. Milder weather in this past autumn allowed U.S. inventories to catch up, ending a 34-week streak of below average stocks in mid-December. Meanwhile, in Europe, natural gas prices continue to surge as reduced flows from Russia jeopardize Europe’s energy security.
For the business of chemistry, the indicators still bring to mind a green banner for basic and specialty chemicals.
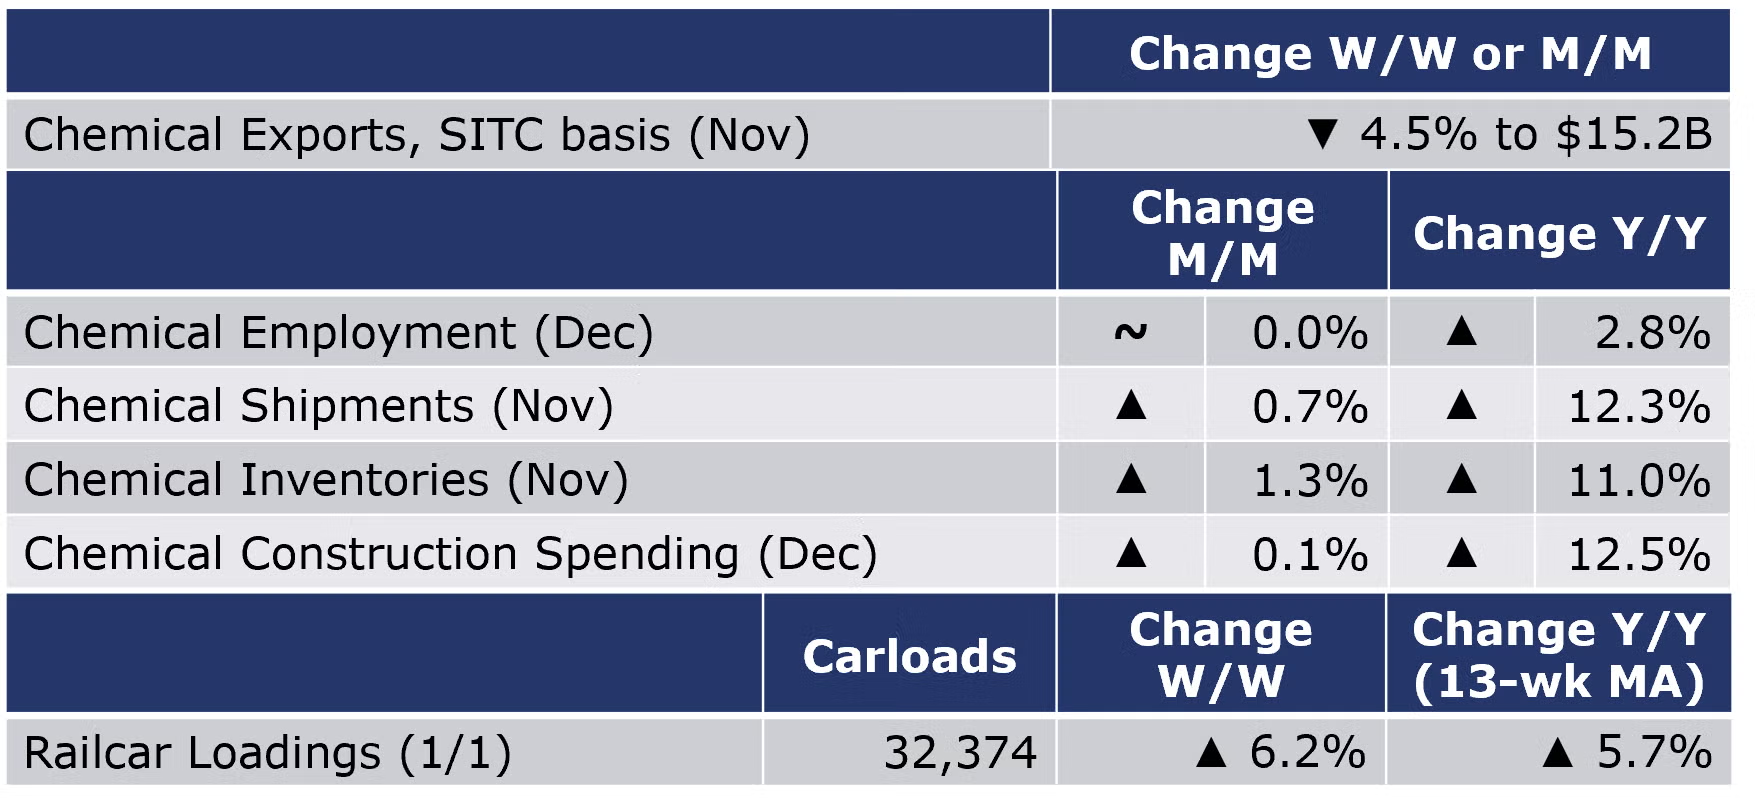
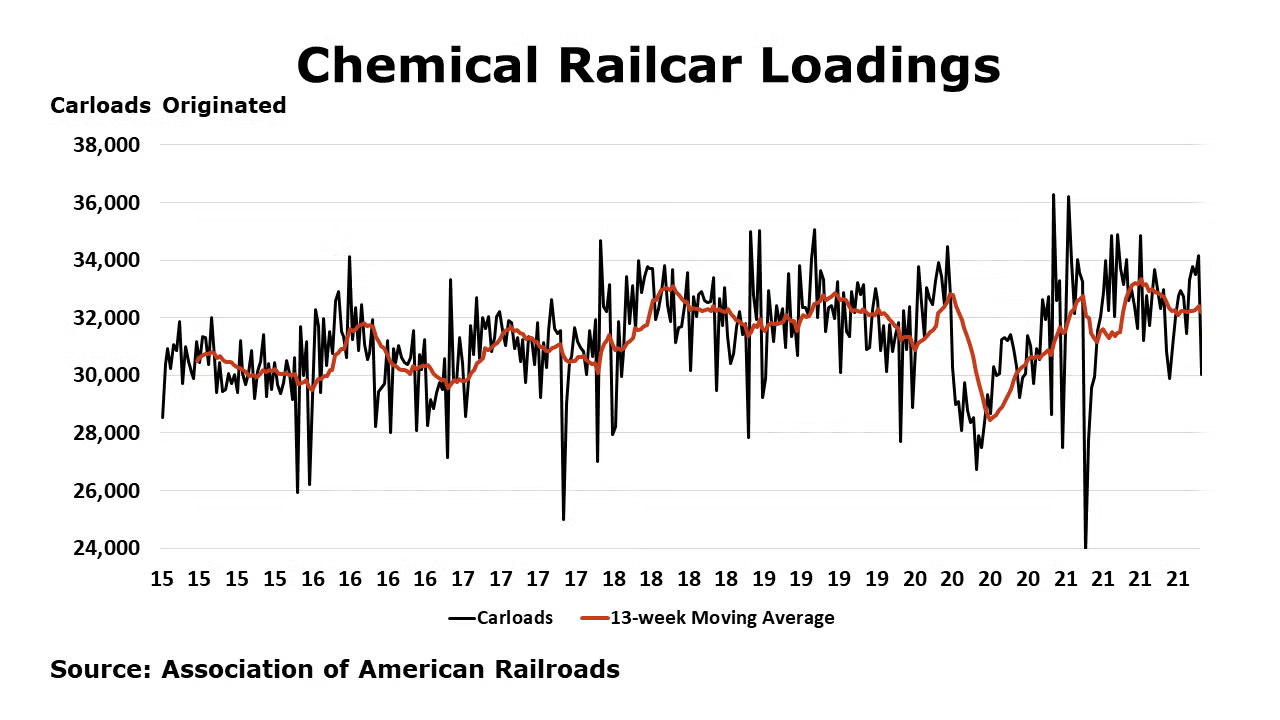
According to data released by the Association of American Railroads, chemical railcar loadings rose by 1,884 carloads to 32,374 for the week ending 1 January. Loadings were up 5.7% Y/Y (13-week MA), up 5.6% YTD/YTD and have been on the rise for 6 of the last 13 weeks.
Chemical employment (including pharmaceuticals) was flat in December. Production workers rose by 2,000, while the number of supervisory and non-production workers was lower the same number. Compared to a year ago, chemical employment was up by 23,200 (2.8%). Average wages for production workers rose 3.5% Y/Y to $26.79. The total labor input was higher for the month, consistent with the ISM report that suggested the chemical industry expanded in November.
Based on SITC data, U.S. chemical exports fell in November, off by 4.5% to $15.2 billion. Exports fell in all categories except fertilizers. Chemical exports were up by 22.8% YTD/YTD. Chemical imports rose by 9.5% to $15.2 billion in November with gains across all sectors except plastics. Net exports of chemicals swung from a $1.8 billion surplus in October to a $0.2 billion deficit in November. Year-to-date through November, the trade surplus was $13.9 billion, ahead of the $12.5 billion surplus through November 2020.
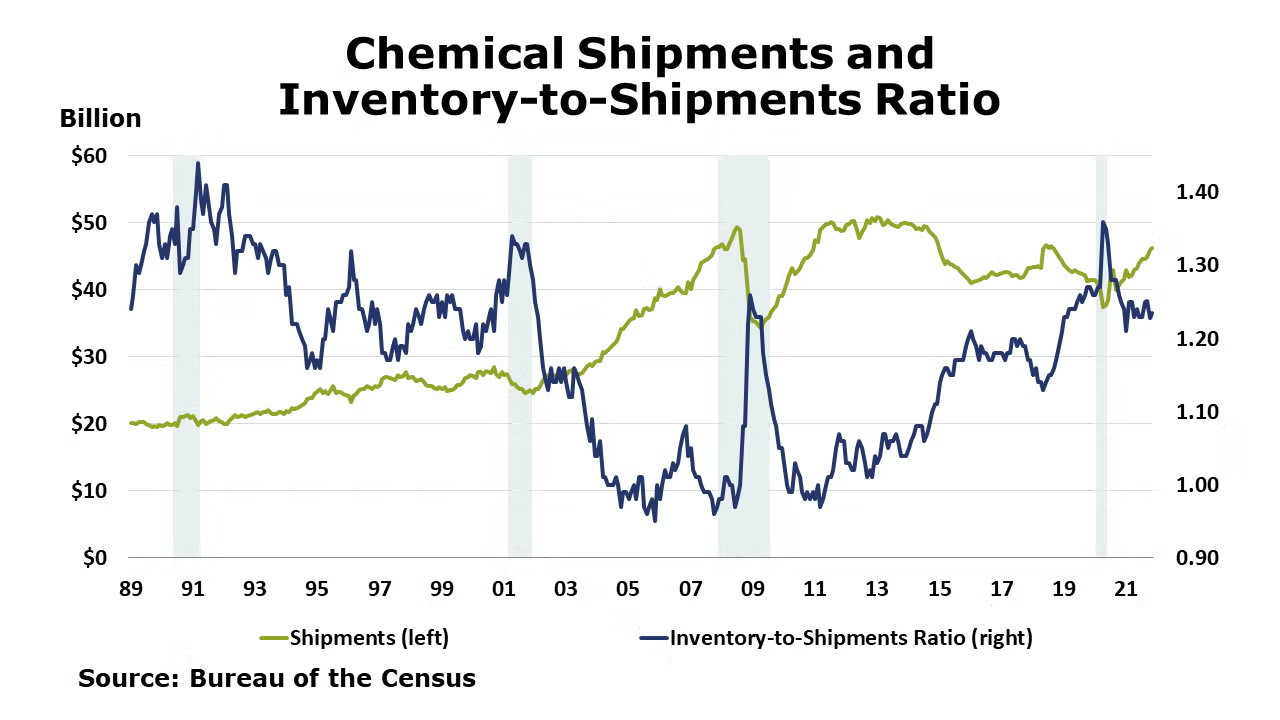
Chemical shipments rose by 0.7% in November (the 9th consecutive gain), with gains in coatings and other chemicals offsetting a decline in agricultural chemical shipments. Chemical inventories also rose, by 1.3% with gains across major segments. Compared to a year ago, shipments were up 12.3% Y/Y while inventories were ahead by 11.0% Y/Y. The inventories-to-sales ratio remained steady compared to October at 1.23. This was slightly lower than a ratio of 1.25 last November.
Chemical industry construction spending ticked higher (up by 0.1%) in November to $30.6 billion. Compared to a year ago, spending was up 12.5% Y/Y
The benchmark S&P 500 Index rose by 4.4% in December. Chemical equity prices, as measured by the S&P, also rose, by 6.9%. Equity prices are often a good indicator of future activity and represent one component of the leading economic indicators. For the year as a whole, chemical equities were up 23.7% while the S&P 500 Index was up 26.9% YTD.
Note On the Color Codes
The banner colors represent observations about the current conditions in the overall economy and the business chemistry. For the overall economy we keep a running tab of 20 indicators. The banner color for the macroeconomic section is determined as follows:
Green – 13 or more positives
Yellow – between 8 and 12 positives
Red – 7 or fewer positives
For the chemical industry there are fewer indicators available. As a result we rely upon judgment whether production in the industry (defined as chemicals excluding pharmaceuticals) has increased or decreased three consecutive months.
For More Information
ACC members can access additional data, economic analyses, presentations, outlooks, and weekly economic updates through MemberExchange.
In addition to this weekly report, ACC offers numerous other economic data that cover worldwide production, trade, shipments, inventories, price indices, energy, employment, investment, R&D, EH&S, financial performance measures, macroeconomic data, plus much more. To order, visit http://store.americanchemistry.com/.
Every effort has been made in the preparation of this weekly report to provide the best available information and analysis. However, neither the American Chemistry Council, nor any of its employees, agents or other assigns makes any warranty, expressed or implied, or assumes any liability or responsibility for any use, or the results of such use, of any information or data disclosed in this material.
Contact us at ACC_EconomicsDepartment@americanchemistry.com