Running tab of macro indicators: 14 out of 20
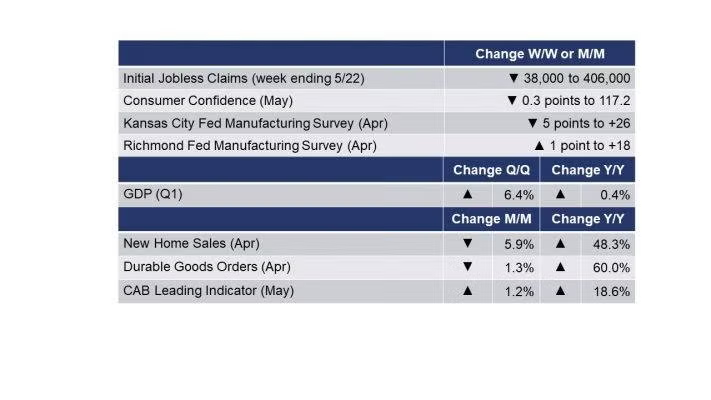
The number of new jobless claims fell by 38,000 to 406,000 during the week ending 22 May, the lowest level since 14 March 2020. Continuing claims fell by 96,000 to 3.642 million and the unemployment rate for the week ending 15 May eased 0.1 points to 2.6%.
U.S. Q1 GDP grew by a seasonally adjusted annual rate of 6.4% according to the second estimate made by the Bureau of Economic Analysis (BEA). This was unchanged from BEA’s first estimate released last month. BEA produces three estimates based on more complete data availability and revisions to previously published data. In Q4, GDP rose by 4.3%. Compared to last year, GDP was up 0.4% Y/Y.
Conference Board’s measure of consumer confidence eased 0.3 points to 117.2 (1985=100). Consumers’ assessment of current business and labor market conditions increased while their short-term outlook for income, business, and labor market conditions eased. Inflation appears to be a concern. Confidence should remain resilient in the short term, as vaccination rates climb, COVID-19 cases decline further, and the economy fully reopens. Plans to purchase a home, or a major appliance, or a car, in the next six months all eased.
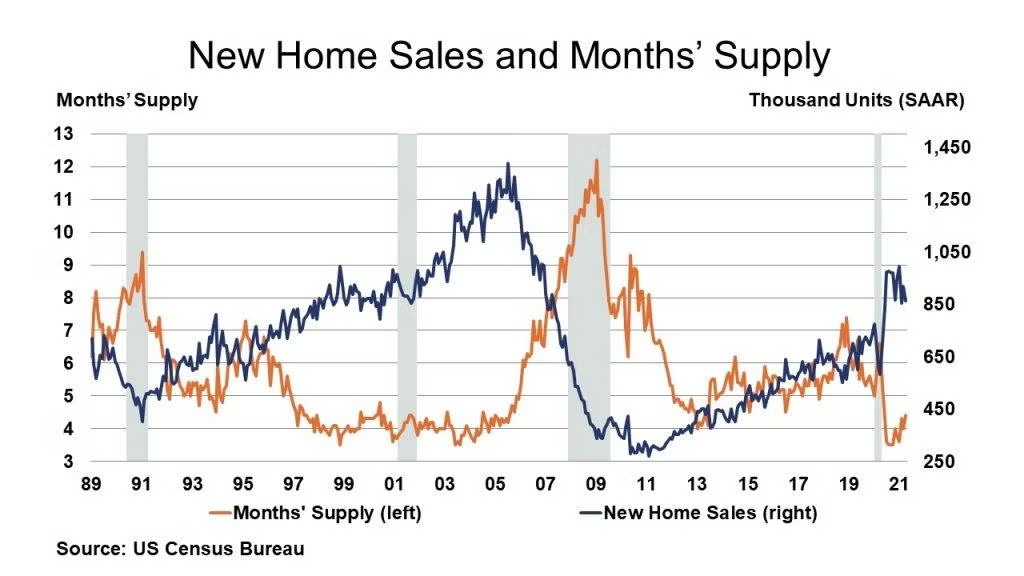
As expected, new home sales fell in April, down 5.9%. Sales fell in all regions except the West. Inventories moved higher, up by 3.9% in April, but off 1.6% from a year ago. At the current sales pace, inventories represent a 4.4-month supply, up from 4.0 in March and the highest level since May 2020. Compared to a year ago, new home sales were off 48.3%. The median sales price was up 8.7% for the month and 20.0% Y/Y, pricing many would-be homebuyers out of the market. Surging materials prices and labor shortages, in addition to strong demand, have contributed to home price gains in recent months.
The Richmond Fed reported that Fifth District manufacturing activity strengthened in May, with the composite index inching up from 17 in April to 18 in May, as all three components — shipments, new orders, and employment — reflected growth. Most firms reported lengthening vendor lead times, which reached a record high, along with the backlog of orders. Meanwhile, the index for raw materials inventories reached a record low. Overall, manufacturers reported improved business conditions. The Kansas City Fed reported that Tenth District manufacturing activity continued to expand at a strong pace, and expectations for future activity remained solid. The index of prices paid for raw materials compared to a month ago posted a new survey record high for the second straight month, and prices received for finished goods also surpassed historical levels. Fully 98% of firms reporting higher materials prices compared to a year ago. Moving forward, district firms expected materials prices and finished goods prices to continue to increase over the next six months.
Following eleven straight months of gains, durable goods orders fell unexpectedly in April, down 1.3%. the decline was led by sharply lower orders for motor vehicles and parts (reflecting the ongoing production disruptions related to shortages of semiconductors, polyurethane foam, and other materials). Excluding transportation, new orders were up 1.0% with gains across most major segments. Core business orders (nondefense capital goods excluding aircraft) were up 2.3%. Headline orders were up 60.0% Y/Y, while core business orders were up 27.1% Y/Y. Both measures include base effects.

Our CAB leading economic indicator rose 1.2% in May on a three-month moving average basis following a 1.0% increase in April. The barometer rose 18.6% Y/Y in May (3MMA). The unadjusted data show a 1.0% increase in May following a 0.9% gain in April. The diffusion index reached 100% in May. The CAB reading for April was revised upward by 0.91 points and the reading for March was revised upward by 0.16 points. The May data are provisional and subject to revision. In May, production-related indicators were positive. Product and input prices were positive, as were inventory and other supply chain indicators. The latest CAB reading is consistent with a marked expansion of commerce, trade, and industry.
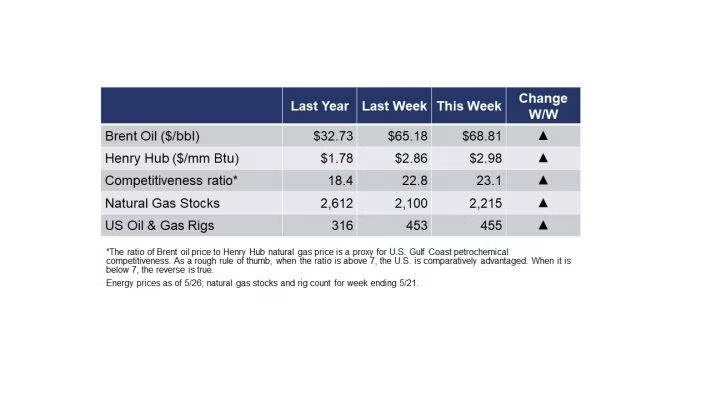
The rig count rose by two to 455 rigs during the week ending 21 May. Oil prices edged higher during the week on solid economic data out of the U.S. Gas inventories saw their highest weekly build of the year.
For the business of chemistry, the indicators still bring to mind a green banner for basic and specialty chemicals.
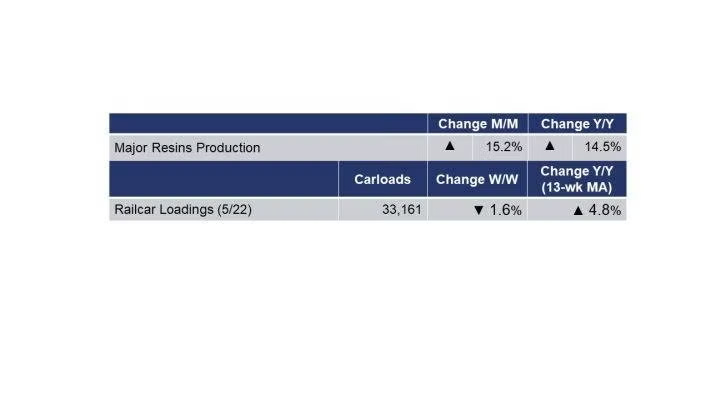
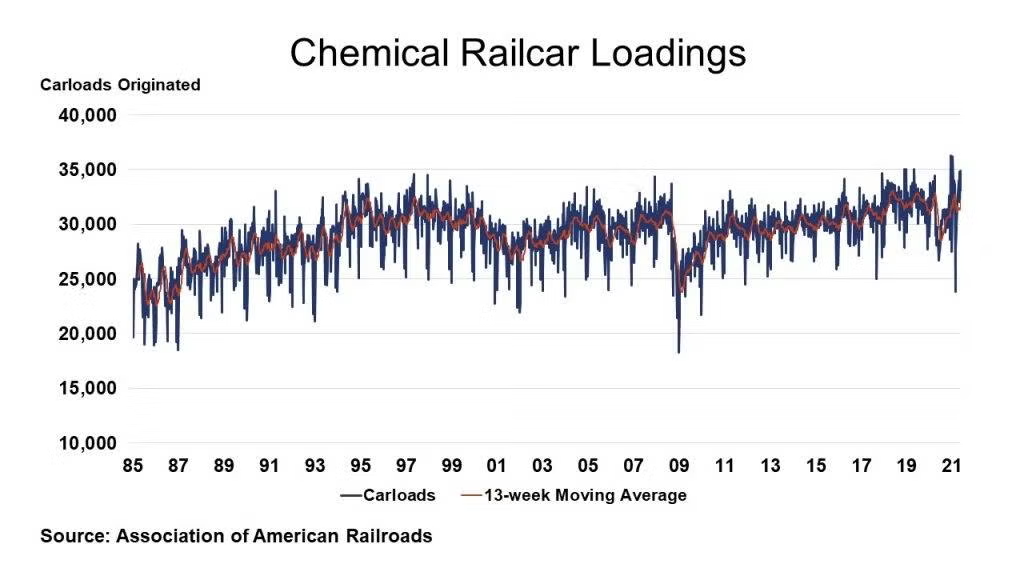
According to data released by the Association of American Railroads, chemical railcar loadings, the best ‘real time’ indicator of chemical industry activity, fell by 1.6% to 33,161 railcars the week ending 22 May (week 20). Loadings were up 16.2% Y/Y, up 2.7% YTD/YTD and the 13-week moving average, which is used to smooth out volatility, was up 4.8%.
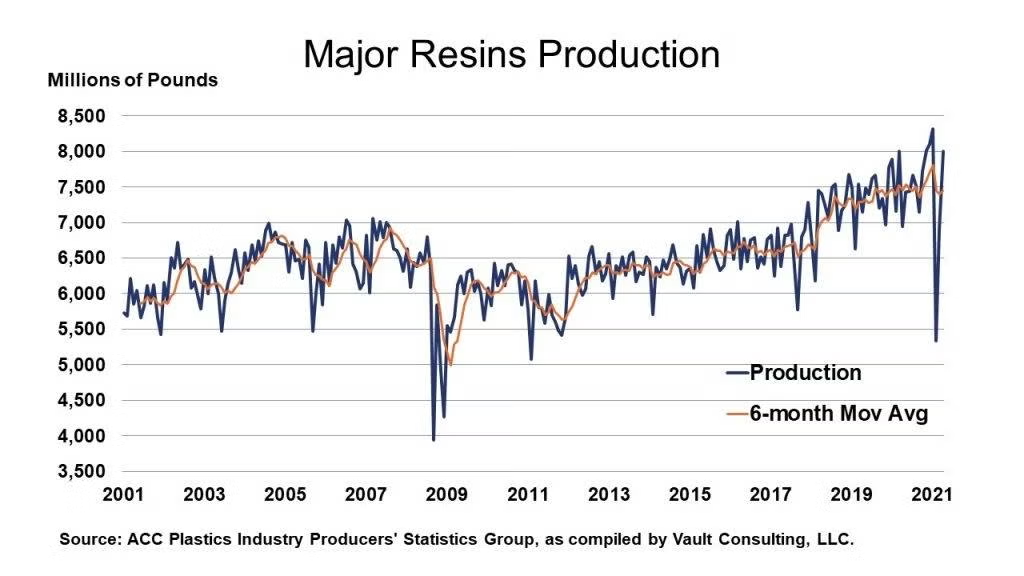
According to data from the ACC Plastics Industry Producers’ Statistics Group, U.S. production of major plastic resins totaled 8.0 billion pounds during April 2021, up 15.2% M/M, and up 14.5% Y/Y. Year-to-date production was 28.4 billion pounds, a 5.2% decrease Y/Y. Sales and captive (internal) use of major plastic resins totaled 7.3 billion pounds, up 3.6% compared to the prior month, and down 0.2% Y/Y. Year-to-date sales and captive use were 29.0 billion pounds, a 4.1% decrease as compared to the same period in 2020.
Note On the Color Codes
The banner colors represent observations about the current conditions in the overall economy and the business chemistry. For the overall economy we keep a running tab of 20 indicators. The banner color for the macroeconomic section is determined as follows:
Green – 13 or more positives
Yellow – between 8 and 12 positives
Red – 7 or fewer positives
For the chemical industry there are fewer indicators available. As a result we rely upon judgment whether production in the industry (defined as chemicals excluding pharmaceuticals) has increased or decreased three consecutive months.
For More Information
ACC members can access additional data, economic analyses, presentations, outlooks, and weekly economic updates through MemberExchange.
In addition to this weekly report, ACC offers numerous other economic data that cover worldwide production, trade, shipments, inventories, price indices, energy, employment, investment, R&D, EH&S, financial performance measures, macroeconomic data, plus much more. To order, visit http://store.americanchemistry.com/.
Every effort has been made in the preparation of this weekly report to provide the best available information and analysis. However, neither the American Chemistry Council, nor any of its employees, agents or other assigns makes any warranty, expressed or implied, or assumes any liability or responsibility for any use, or the results of such use, of any information or data disclosed in this material.
Contact us at ACC_EconomicsDepartment@americanchemistry.com
Upcoming Events of Interest
“Advancing Bio-Degradability in Packaging” Webinar
Brad Crocker – President & CEO, Epsilyte
11:00 am – 12:15 pm | 2 June 2021
Chemical Marketing & Economics
www.cme-stem.org
“The Future and Impact of Electronic Vehicle” Webinar
Patrick Hummel, CFA
Managing Director – Head of European and US Auto & Mobility Research, Global Auto Sector Coordinator, UBS and John Roberts – Executive Vice President, U.S. Equity Research – Chemicals, UBS
1:00 pm – 2:00 pm | 2 June 2021
Société de Chimie Industrielle
www.societe.org

