Running tab of macro indicators: 14 out of 20
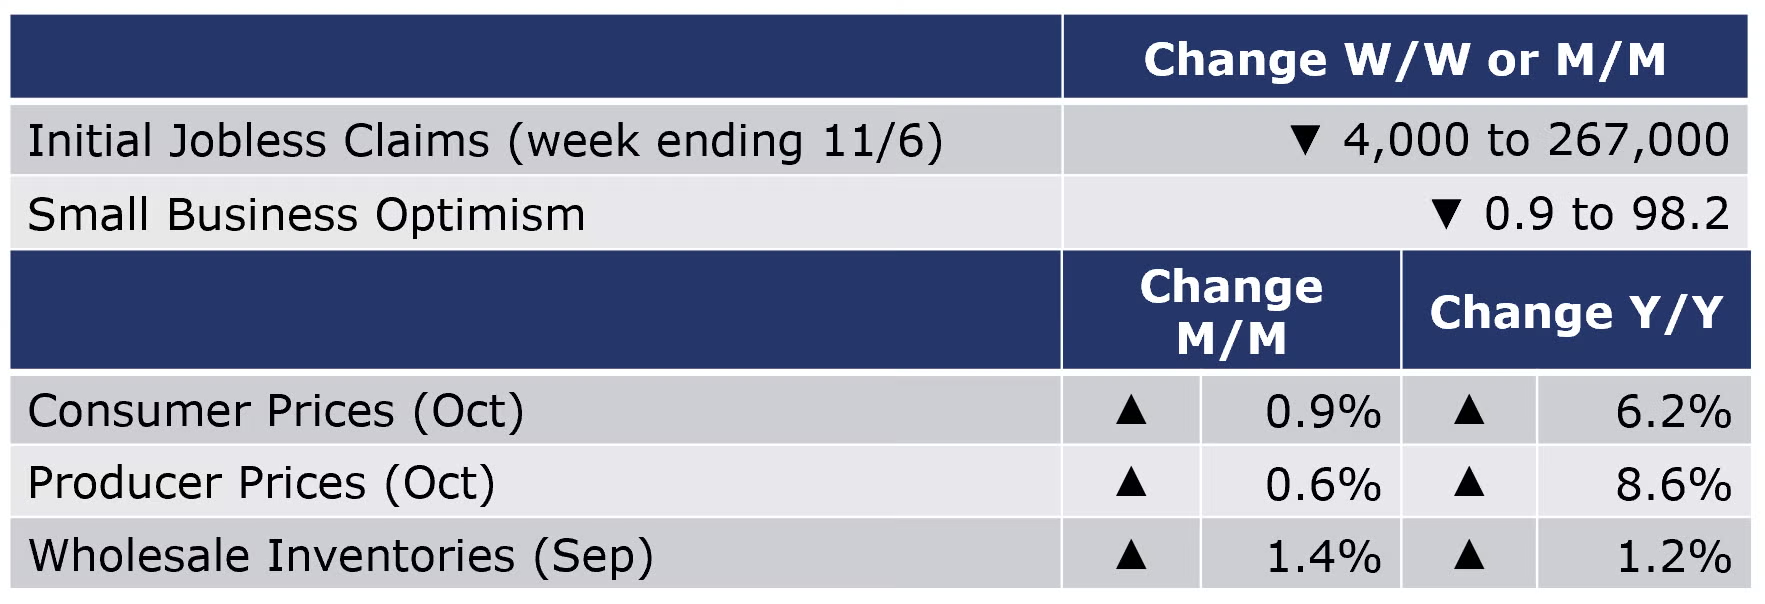
The number of new jobless claims fell by 4,000 to 267,000 during the week ending 6 November, still the lowest since March 14, 2020. Continuing claims increased by 59,000 to 2.16 million, and the insured unemployment rate for the week ending 30 October was steady at 1.6%.
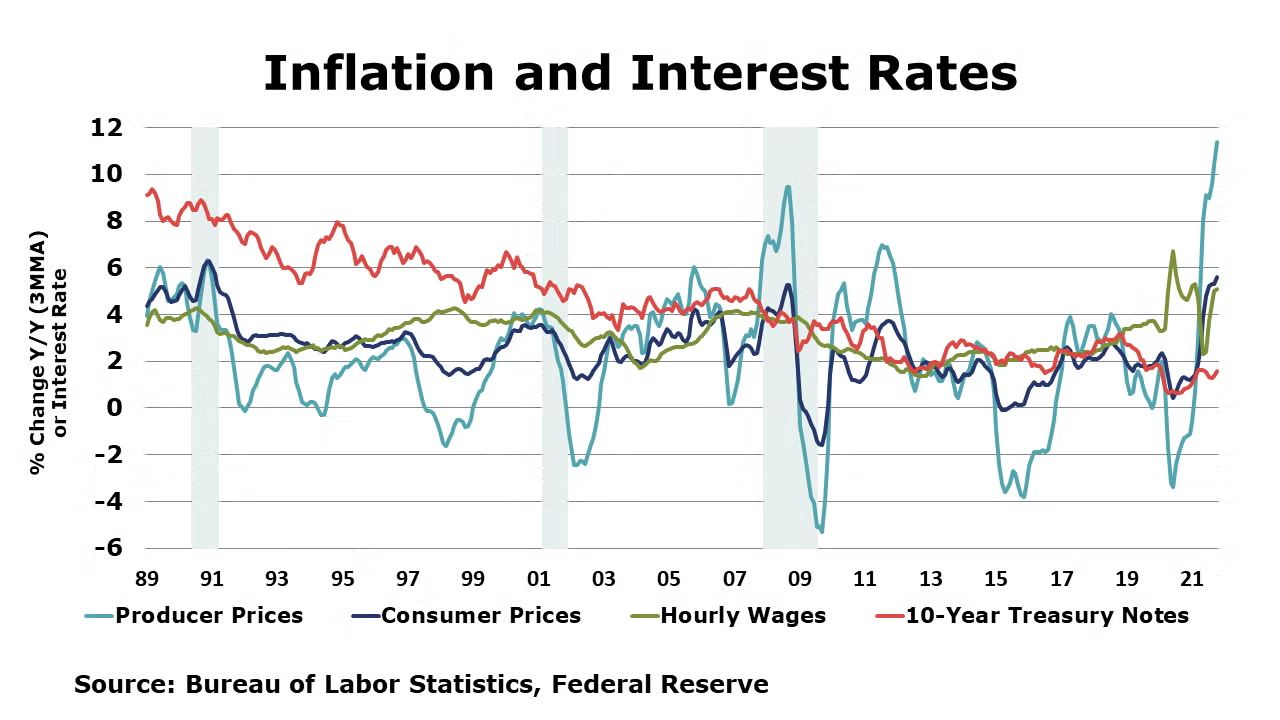
As expected, producer prices continued to climb in October, up by 0.6% and were ahead 8.6% Y/Y. Over 80% of the October increase in prices for final demand services can be traced to retail margins for automobiles and automobile parts. Food prices eased slightly, but energy prices continued to advance. Core producer prices rose by 0.5% and were ahead 6.2% Y/Y.
Inflation pressures are building for consumers. Headline consumer prices rose by 0.9 in October and were up 6.2% Y/Y, a 31-year high. Much of the gain was driven by higher energy prices. Core consumer prices of services and goods (less food and energy) have risen 4.6% over the last 12 months (through October). The index for all items less food and energy (core CPI) rose 0.6% in October. Most component indexes increased over the month. Along with shelter, used cars and trucks, and new vehicles, the indices for medical care, for household furnishing and operations, and for recreation all increased in October.
Wholesale inventories rose 1.4% by the end of September and were 1.2% higher than levels in August 2020. Wholesale sales were up 1.1% in September and were 22.0% higher than a year before. The inventories-to-sales ratio was 1.23 in September—the same as August—and compares to 1.33 a year before (September 2020).
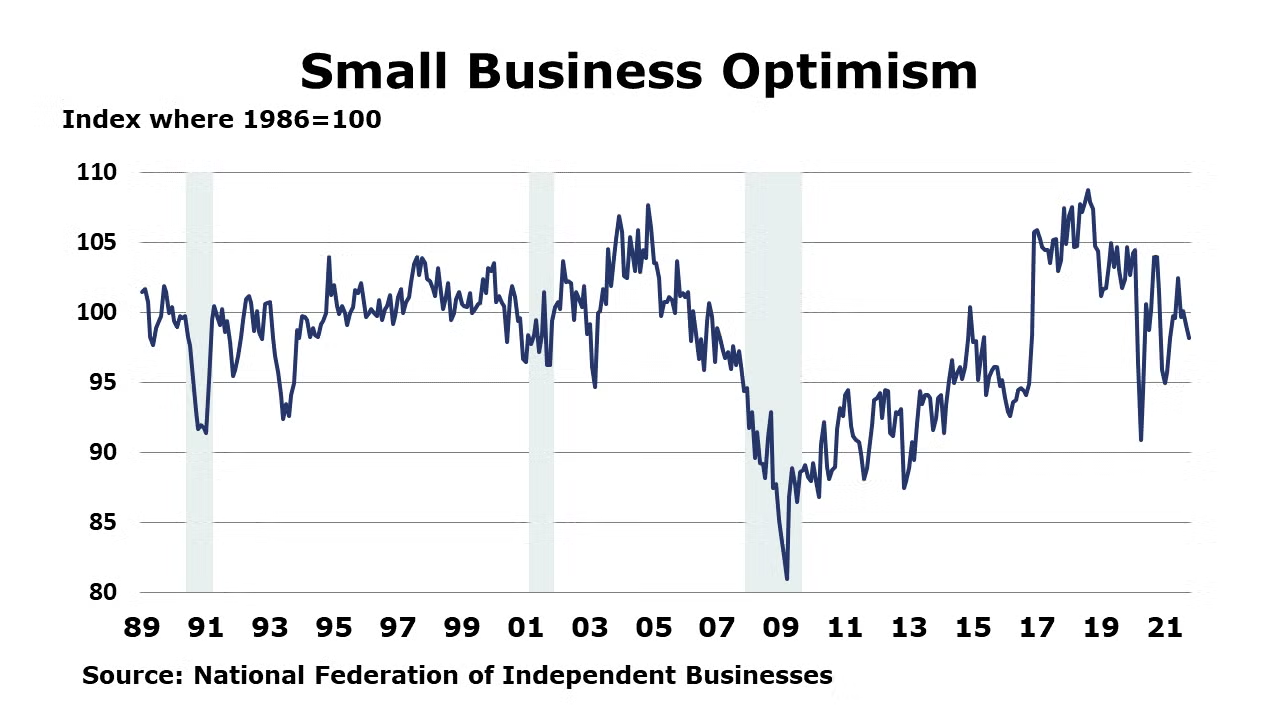
Small business optimism moved lower in October, falling 0.9 points to 98.2. Of the 10 index components, only one improved (capital spending plans), while seven declined and two were unchanged. Small businesses remain pessimistic about future business conditions and the report notes that small businesses are being held back by lack of workers and inventory shortages.
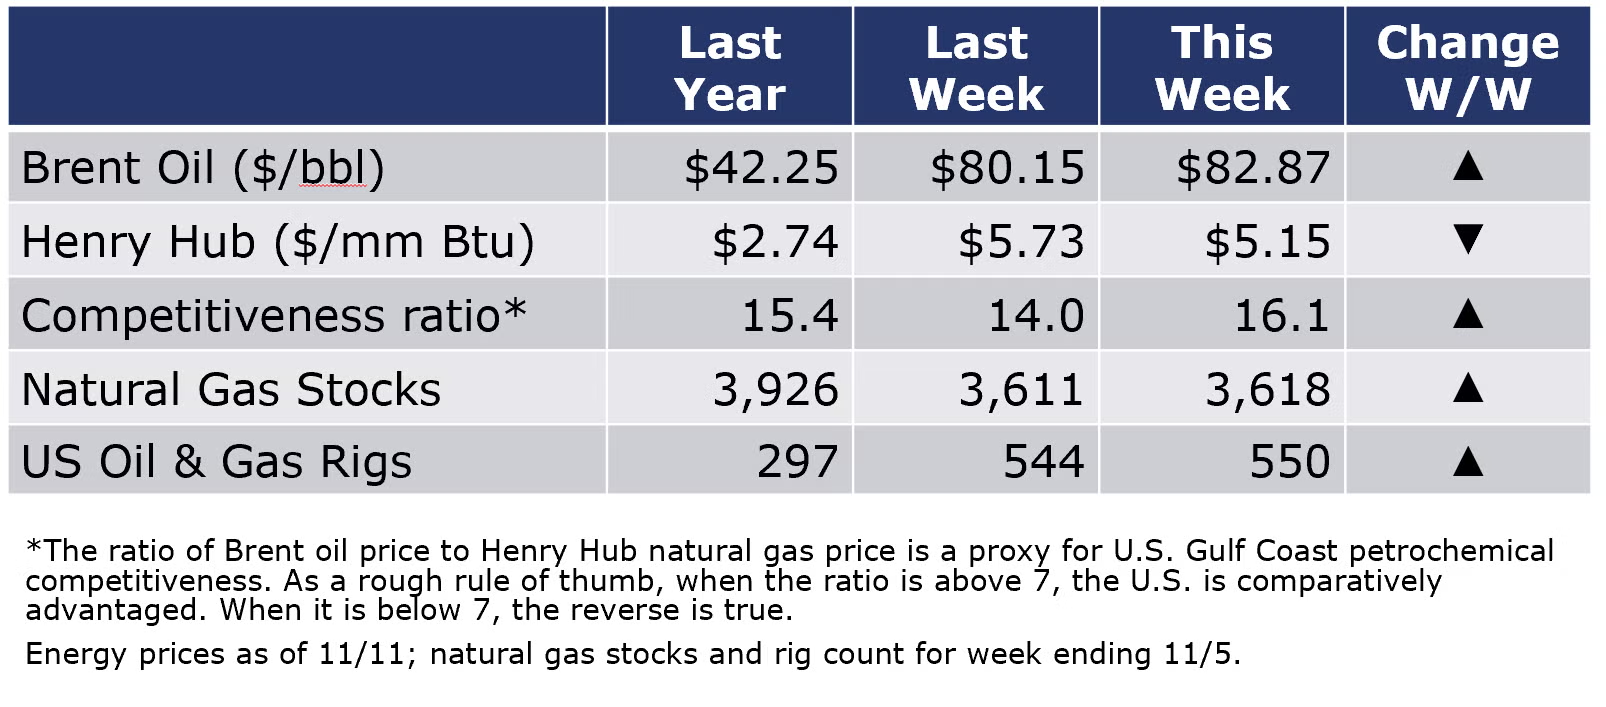
Following a decline the previous week, the combined oil and gas rig count rose by six to 550 rigs during the week ending 5 November. Cooler autumn weather across much of the U.S. resulted in a small 7 BCF build in natural gas inventories last week. Inventories remain 3.2% below the five-year historical average going into the heating season. Oil and natural gas prices remain historically high.
For the business of chemistry, the indicators still bring to mind a yellow banner for basic and specialty chemicals.
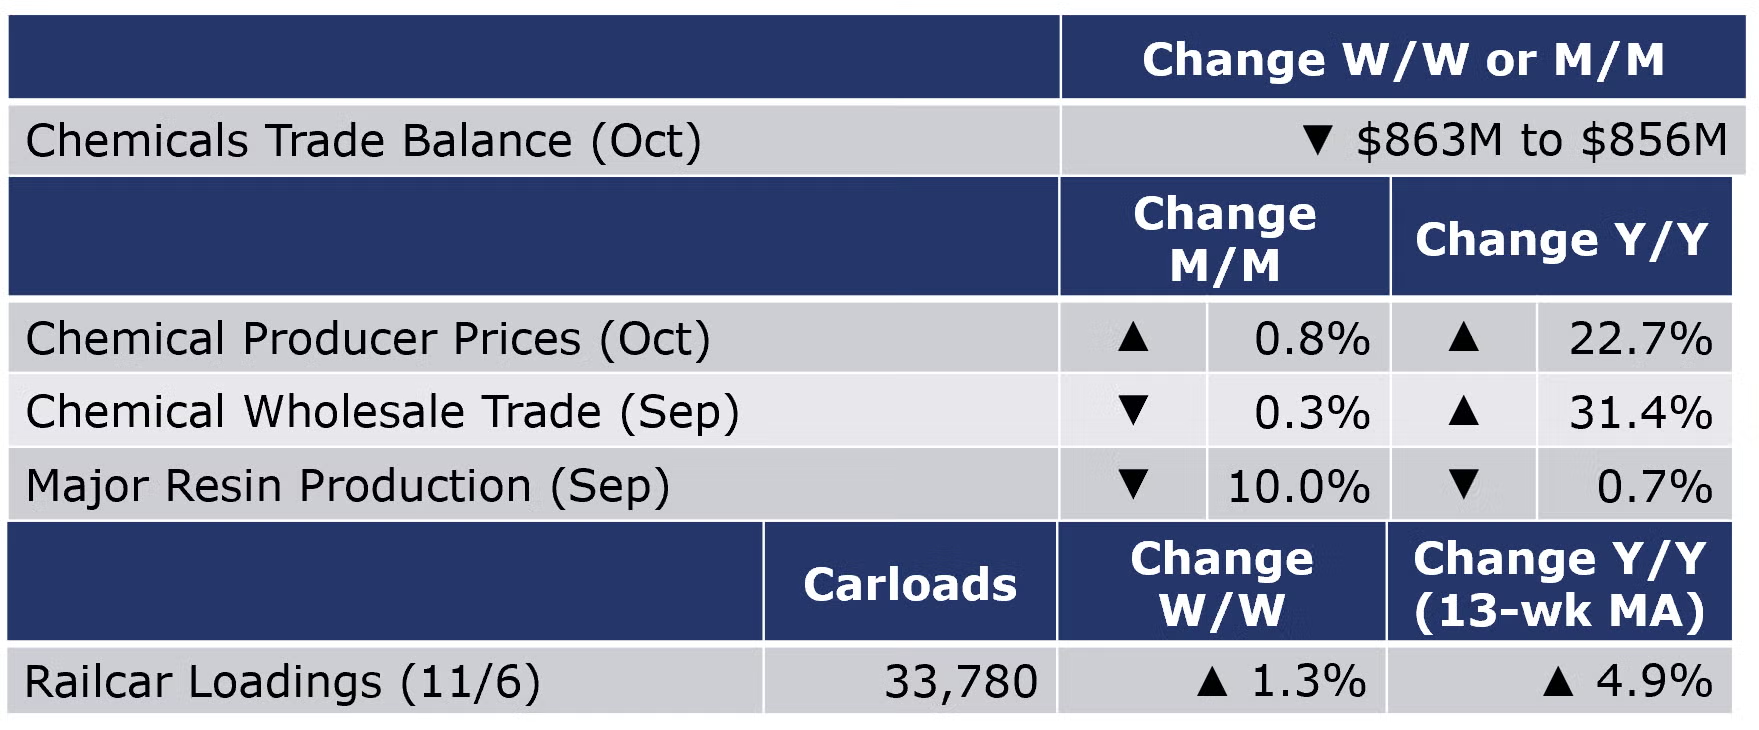
According to data released by the Association of American Railroads, chemical railcar loadings, the best ‘real time’ indicator of chemical industry activity, rose slightly (by 437) to 33,780 railcars during the week ending 6 November (week 44). Loadings were up 3.6% Y/Y, up 4.9% YTD/YTD and have been on the rise for 7 of the last 13 weeks.
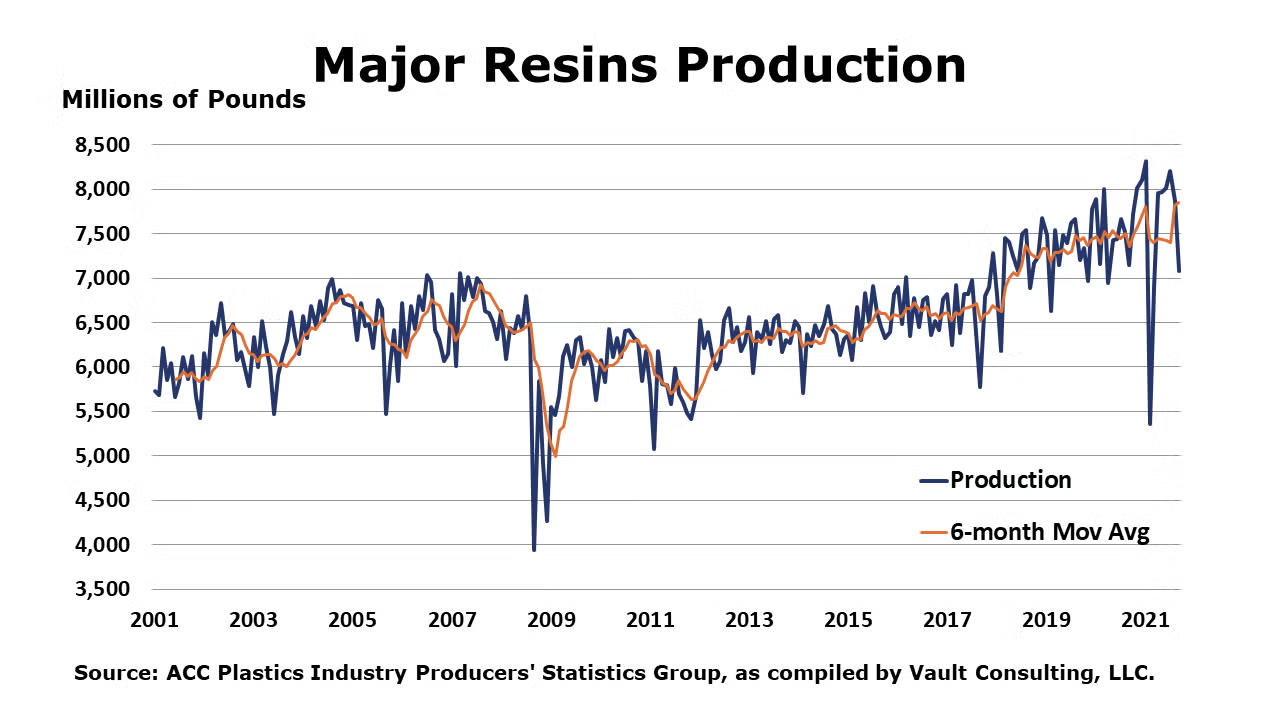
According to data released by ACC’s Plastics Industry Producers Statistics group, U.S. production of major plastic resins totaled 7.1 billion pounds during September 2021, down 10.0% compared to the prior month, and down 0.7% Y/Y. Year-to-date production was 67.8 billion pounds, a 0.7% increase Y/Y. Sales and captive (internal) use of major plastic resins totaled 7.2 billion pounds, down 7.1% compared to the prior month, and down 3.5% Y/Y. Year-to-date sales and captive use were 66.8 billion pounds, down 2.5% Y/Y.
Chemical producer prices continued to move higher in October, up by 0.8%, the slowest sequential gain since November 2020. Prices gained across all major segments, except petrochemicals and organic chemicals, which eased as capacity disrupted by Hurricane Ida came back online. The largest monthly gains were in manufactured fibers, inorganic chemicals, agricultural chemicals and other specialty chemicals. Compared to a year ago, chemical prices were up 22.7% Y/Y.
Following four months of record highs, US chemical exports eased, falling 6% in September to $12.7 billion. Exports fell in most sectors of chemicals. Chemical exports were up by 22% YTD/YTD. Chemical imports rose by 1% to $11.8 billion in September with mixed performance across sectors. Imports of bulk petrochemicals and intermediates, consumer products and other specialties rose in September offsetting declines in other categories. Net exports of chemicals declined in September to $856 million. Net exports are down 4% YTD/YTD.
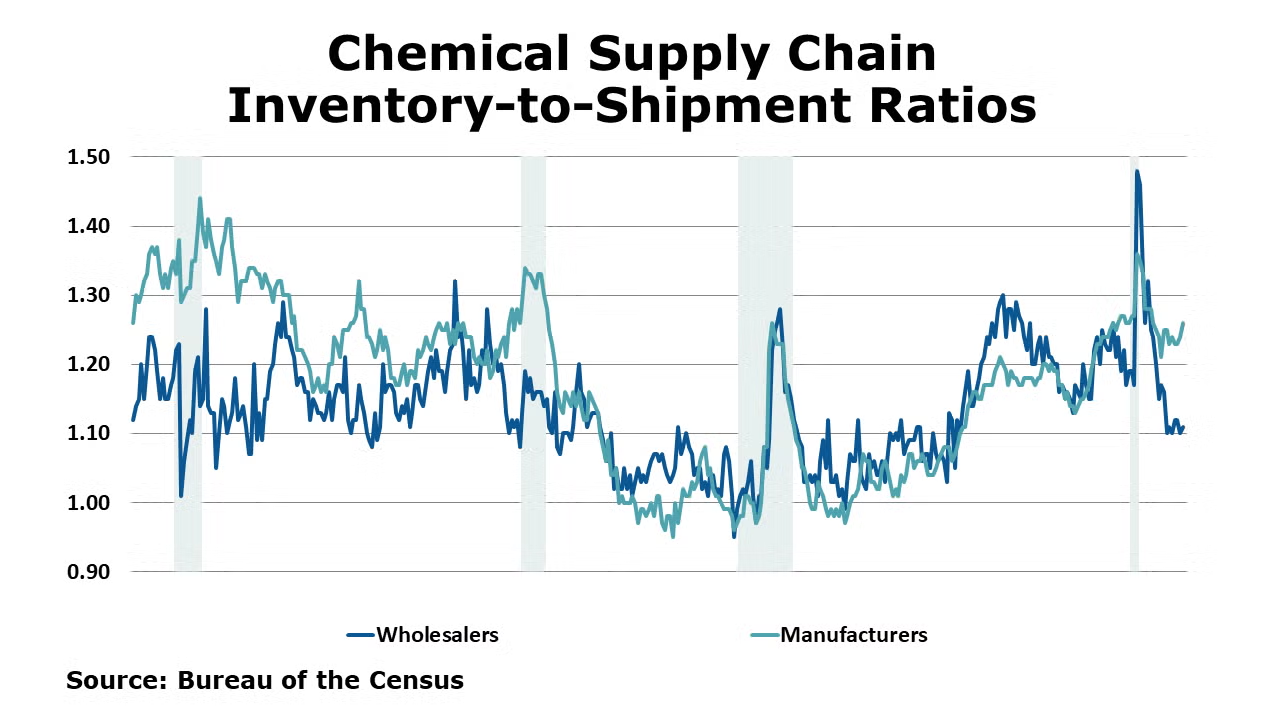
Wholesale chemical inventories rose 0.2% by the end of September to $13.4 billion, a level 15.6% higher than levels in September 2020. Wholesale sales were down 0.3% in September to $12.1 billion, a level 31.4% higher than a year before. The inventories-to-sales ratio increased to 1.11 in September from 1.10 in August and compares to 1.26 a year before (September 2020).
Note On the Color Codes
The banner colors represent observations about the current conditions in the overall economy and the business chemistry. For the overall economy we keep a running tab of 20 indicators. The banner color for the macroeconomic section is determined as follows:
Green – 13 or more positives
Yellow – between 8 and 12 positives
Red – 7 or fewer positives
For the chemical industry there are fewer indicators available. As a result we rely upon judgment whether production in the industry (defined as chemicals excluding pharmaceuticals) has increased or decreased three consecutive months.
For More Information
ACC members can access additional data, economic analyses, presentations, outlooks, and weekly economic updates through MemberExchange.
In addition to this weekly report, ACC offers numerous other economic data that cover worldwide production, trade, shipments, inventories, price indices, energy, employment, investment, R&D, EH&S, financial performance measures, macroeconomic data, plus much more. To order, visit http://store.americanchemistry.com/.
Every effort has been made in the preparation of this weekly report to provide the best available information and analysis. However, neither the American Chemistry Council, nor any of its employees, agents or other assigns makes any warranty, expressed or implied, or assumes any liability or responsibility for any use, or the results of such use, of any information or data disclosed in this material.
Contact us at ACC_EconomicsDepartment@americanchemistry.com

