Running tab of macro indicators: 16 out of 20
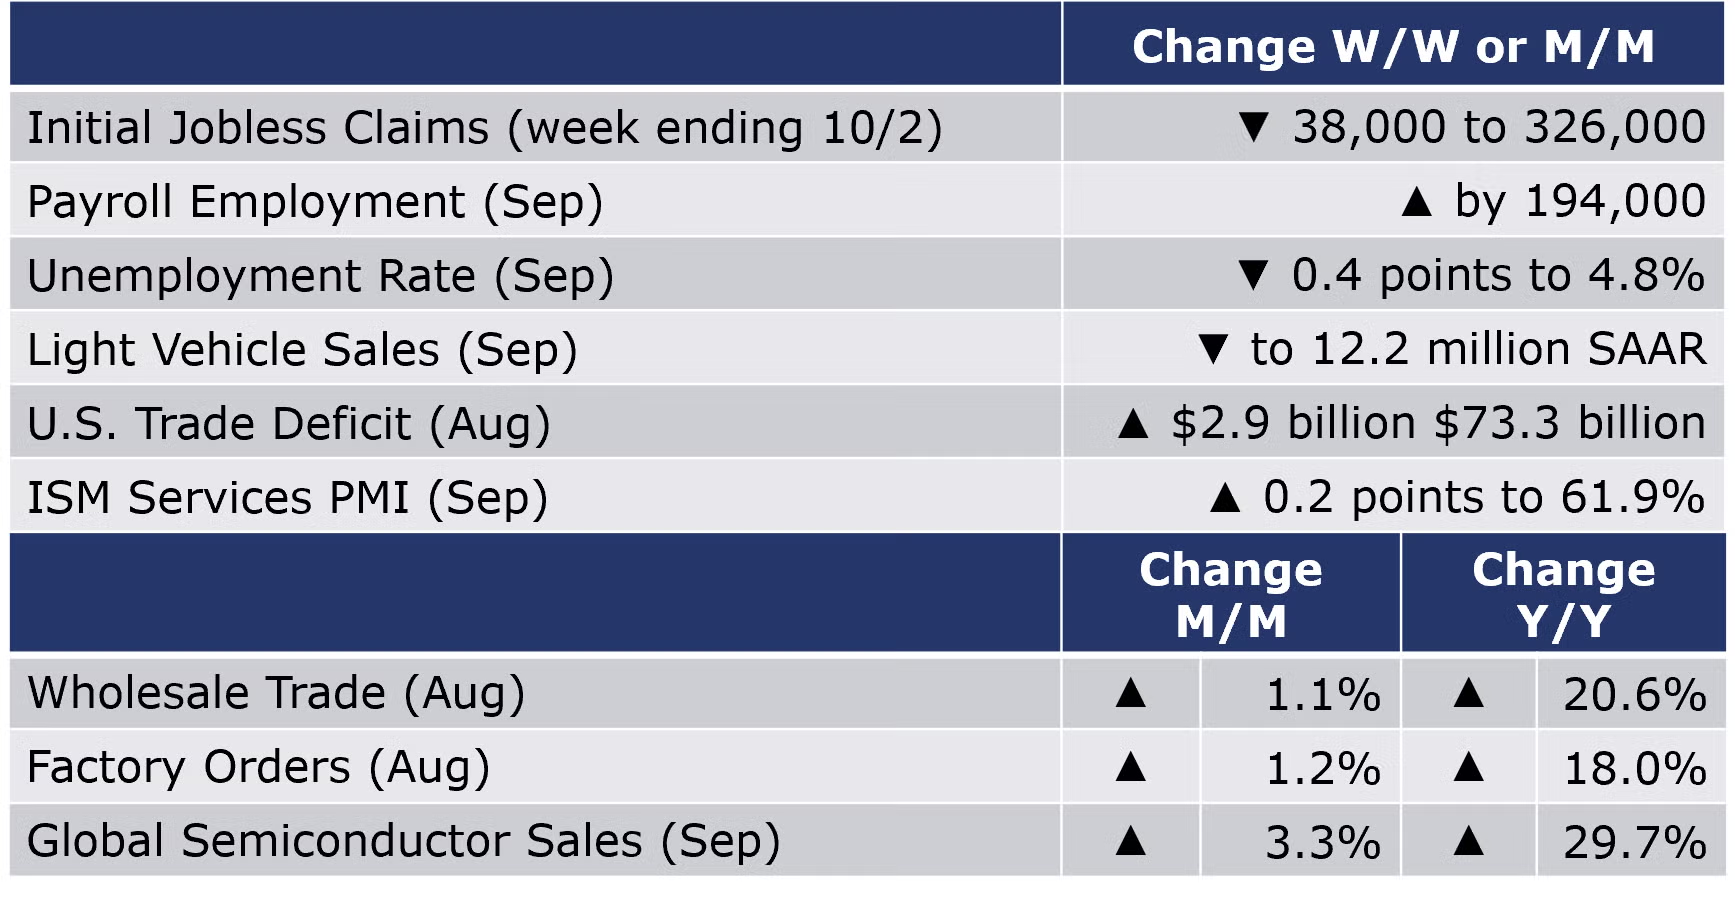
The number of new jobless claims fell by 38,000 to 326,000 during the week ending 2 October. Continuing claims decreased by 97,000 to 2.7 million, the lowest level since March 2020, and the insured unemployment rate for the week ending 25 September declined by 0.1% points to 2.0%.
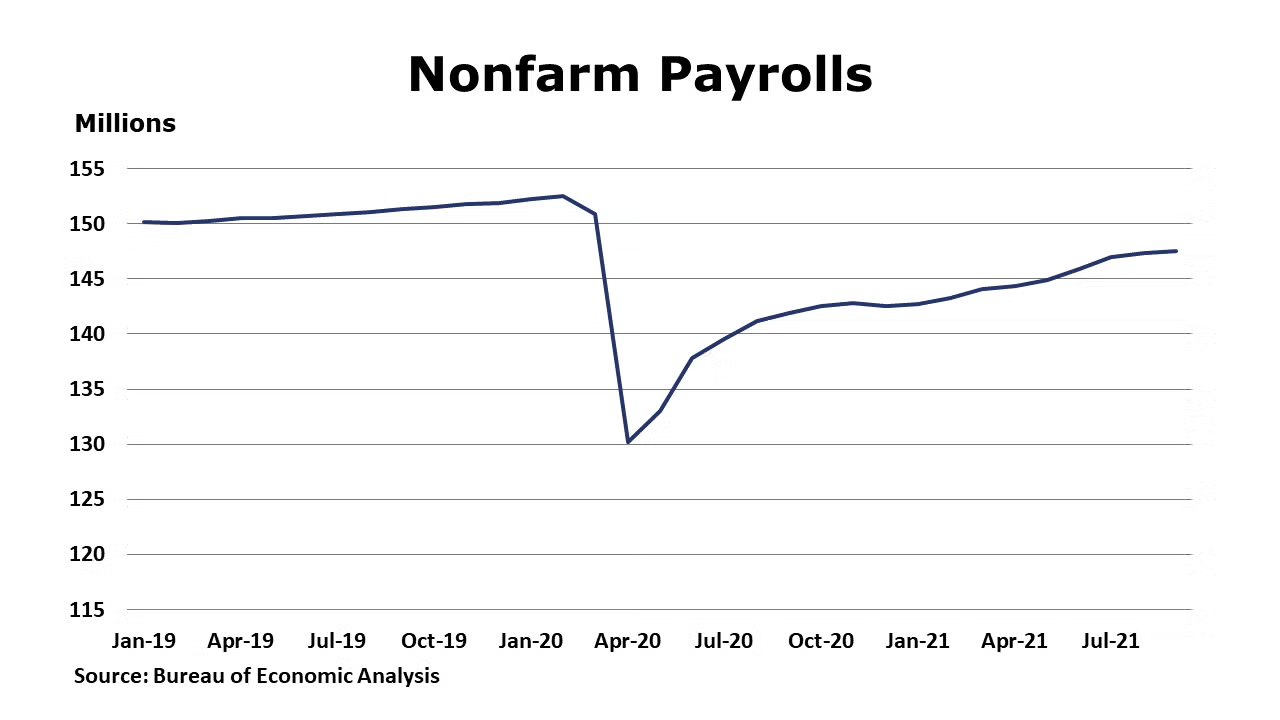
Nonfarm payrolls grew by a disappointing 194,000 in September, the slowest monthly gain this year. There were high hopes that September would see a turnaround in jobs growth as schools reopened and enhanced unemployment benefits programs expired. In addition to the shortage of workers, the Delta variant also appears to have constrained hiring. Gains in private sector employment were broad-based with continued gains in the goods-producing sectors (except for motor vehicle production). Reflecting competition for labor, average hourly wages for non-supervisory workers rose 5.5% Y/Y, the fastest pace since December 2020. The unemploymentrate fell sharply, down 0.4 points to 4.8%, the lowest rate since the beginning of the pandemic and reflects a shrinking labor force.
Wholesale inventories rose 1.2% by the end of August and were 12.3% higher than levels in August 2020. Wholesale sales were down 1.1% in August and were 20.6% higher than a year before. The inventories-to-sales ratio increased to 1.23 in August from 1.20 in July and compares to 1.32 a year before (August 2020).
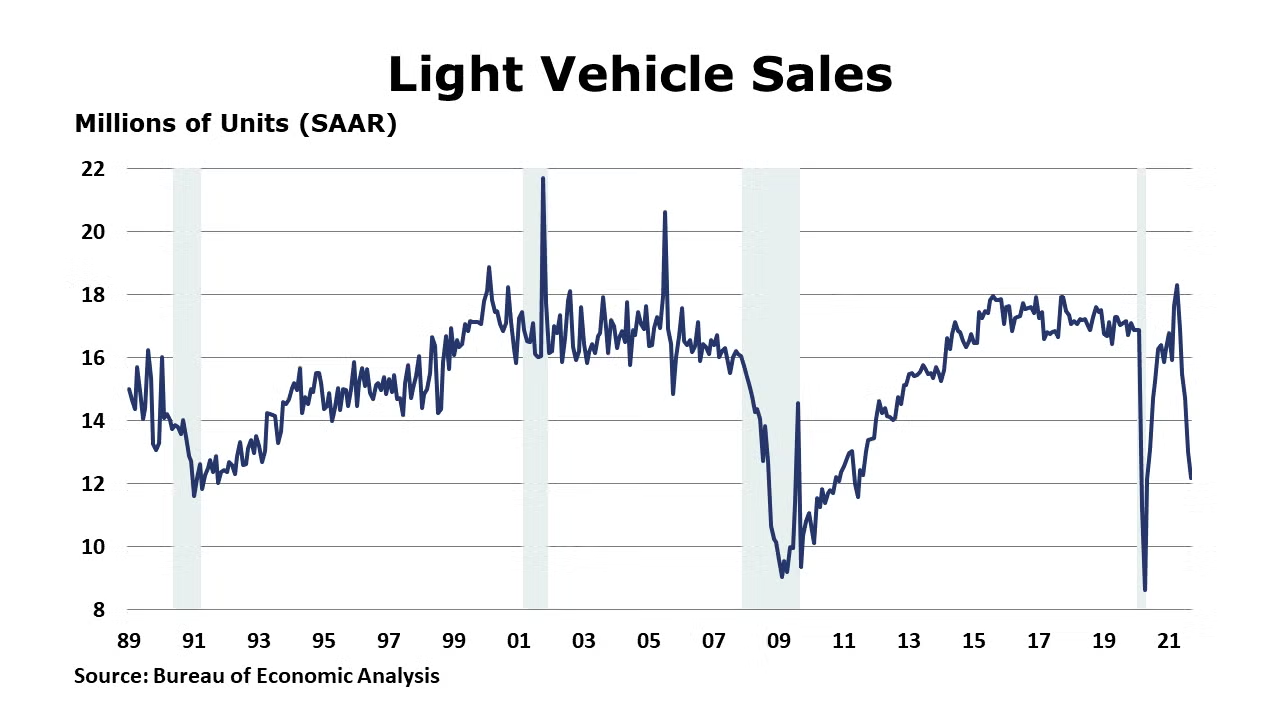
With further production curtailments due to the semiconductor shortage, light vehicle sales continued to fall for a fifth month to a seasonally adjusted annual rate of 12.2 million units. This was the lowest level since June 2020 with declines in both passenger and light trucks.
The US trade deficit in goods and services rose to a record $73.3 billion in August, up 4.2% from July as exports grew by 0.5% and imports grew by 1.4%.
The ISM PMIfor services expanded in September to 61.9%, up 0.2 points from August. Of the 18 service industries reporting, 17 indicated gains.
Despite weakness in motor vehicles, computers, and defense goods, headline factory orders rose 1.2% in August, largely in line with expectations. The gain was driven in large part by orders for civilian aircraft. Orders for core capital goods also continued to expand, up 0.5%. Growth in manufacturing shipments slowed to 0.1% while inventories grew 0.6%. The ratio of inventories-to-shipments remained steady at 1.47. The report suggests continued momentum in manufacturing through the end of summer.
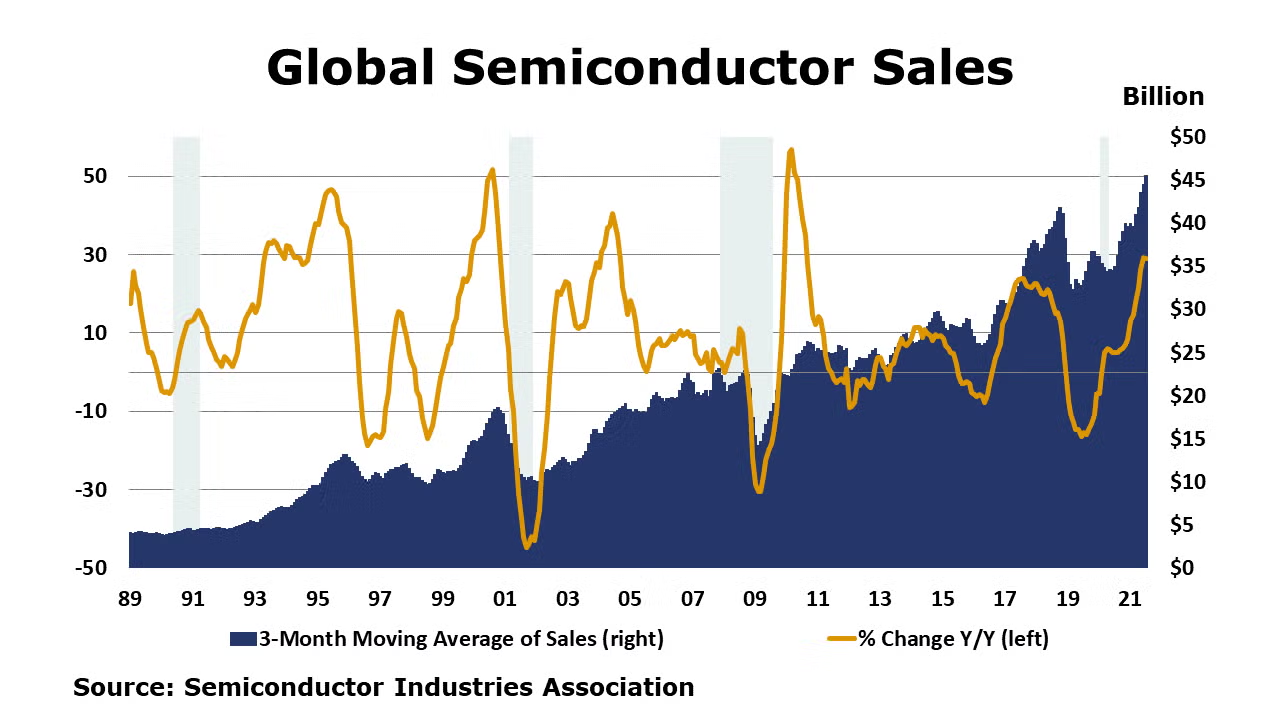
Global semiconductor sales totaled $47.2 billion in August, up 3.3% from July. Year-to-year gains were noted across all regions and major product categories.
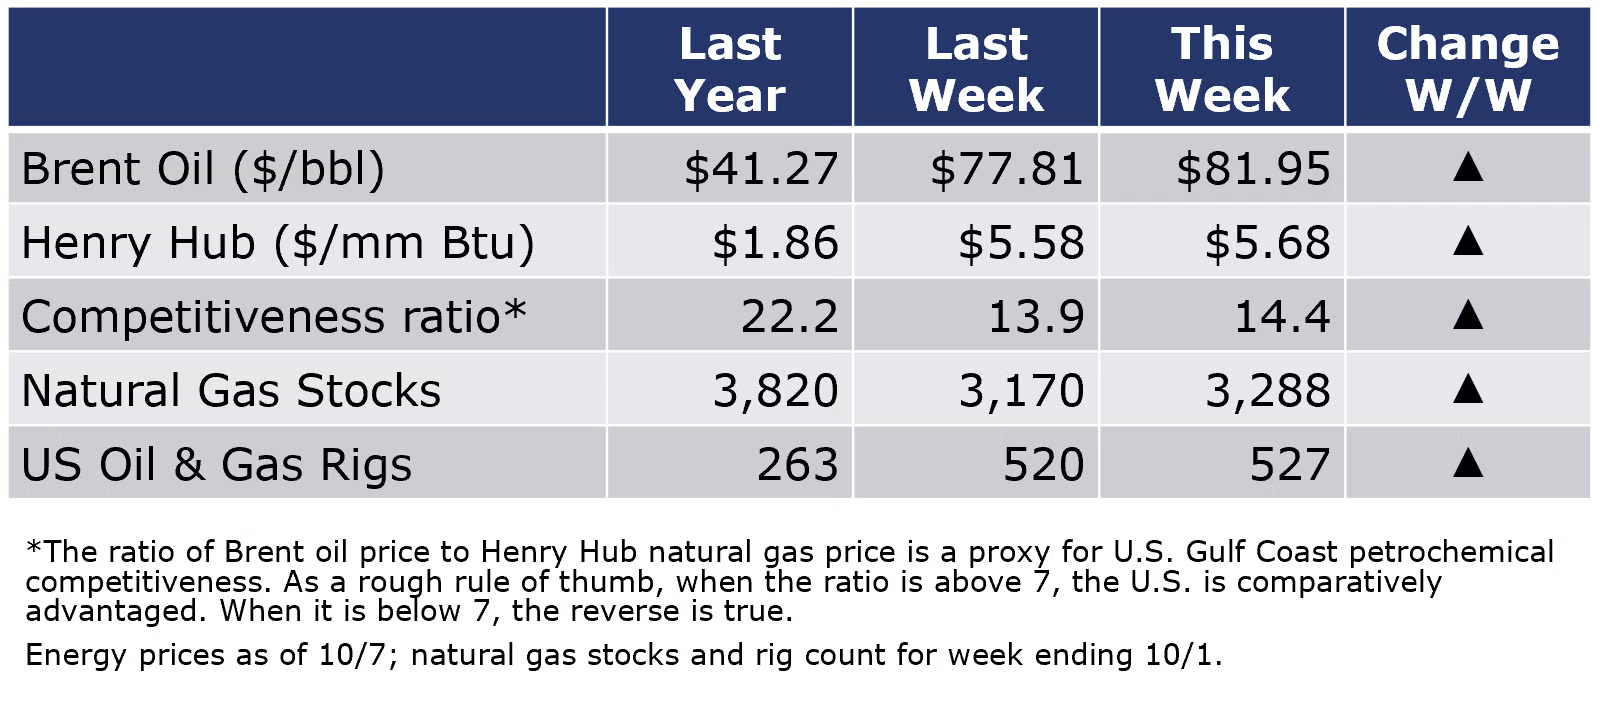
The combined oil and gas rig count rose by seven to 527 rigs during the week ending 1 October. There was a robust 118 BCF build in natural gas inventories during the same week. Natural gas inventories remain 5.1% below the five-year average, however. Gas futures edged slightly higher despite the better-than-expected inventory build reflecting higher prices in Europe and Asia. Oil prices also moved higher during the week following an announcement by OPEC+ that it would stick to already announced production gains of 400,000 BPD. Many oil consumers had been looking for a larger production gain in light of growing oil demand.
For the business of chemistry, the indicators still bring to mind a green banner for basic and specialty chemicals.
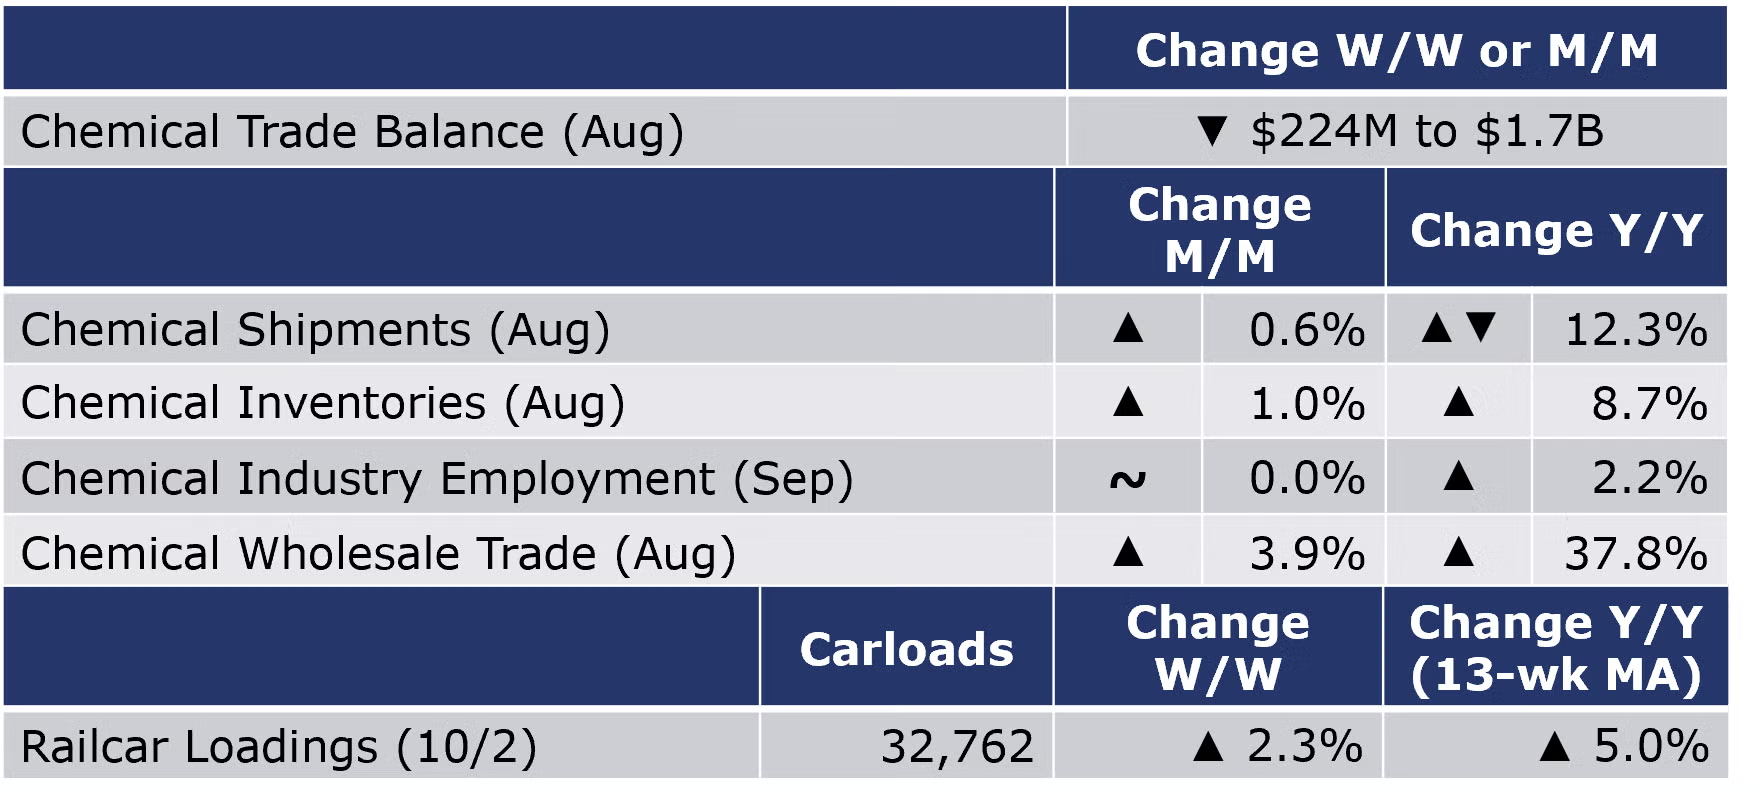
According to data released by the Association of American Railroads, chemical railcar loadings, the best ‘real time’ indicator of chemical industry activity, rose by 729 carloads to 32,762 railcars during the week ending 2 October (week 39). Loadings were up 4.5% Y/Y, up 5.6% YTD/YTD and have been on the rise for 7 of the last 13 weeks.
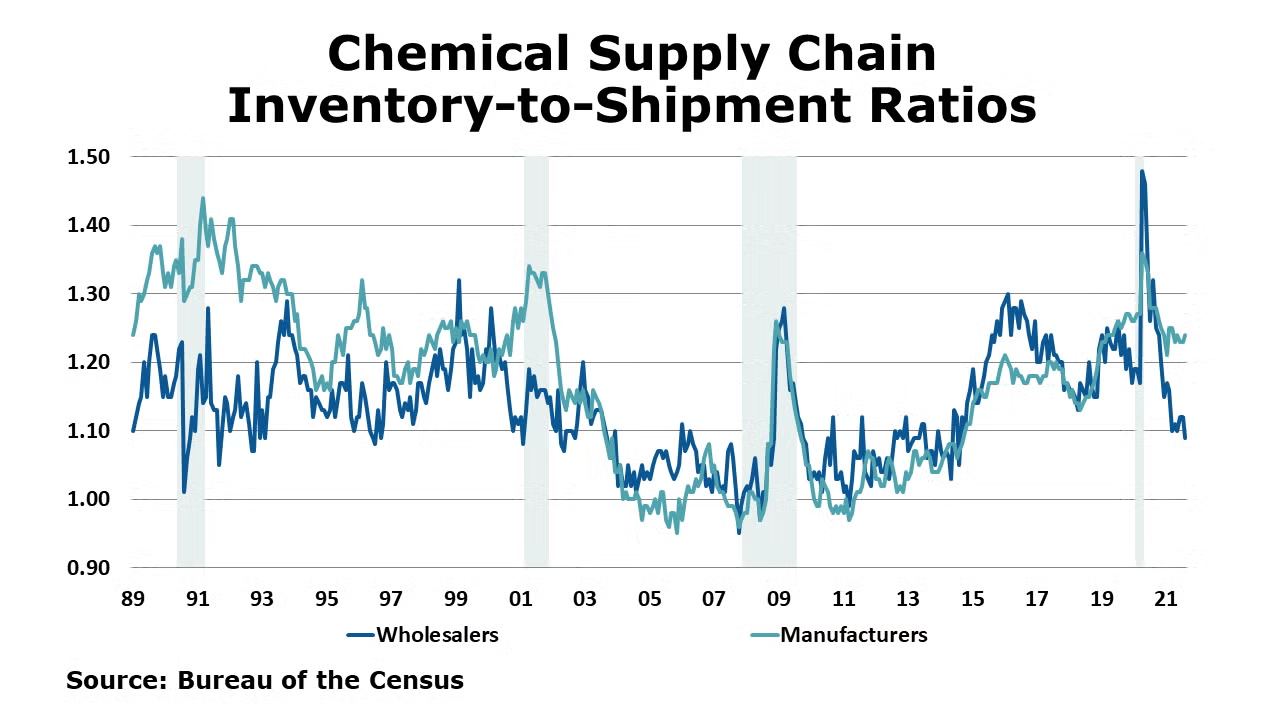
Chemical shipments rose for a sixth consecutive month, by 0.6% in August with gains across all major segments. Chemical inventories also expanded, by 1.0%, the 13th consecutive gain. Inventories expanded among all major segments. Inventories were up 8.7% Y/Y while sales were ahead by 12.3% Y/Y. The inventories-to-shipments ratio ticked higher to 1.24 compared to July. A year ago, the ratio stood at 1.28.
Likely reflecting disruptions due to Hurricane Ida, chemical employment (including pharmaceuticals) was essentially flat in September, down by 300 (0.03%). Production workers fell by 3,600, while the number of supervisory and non-production workers was higher by 3,300. Compared to a year ago, chemical employment was up by 18,100 (2.2%). Average wages for production workers rose 4.6% Y/Y to $27.33. The total labor input edged slightly lower for the month, in contrast to last week’s ISM report that suggested the chemical industry expanded in September.
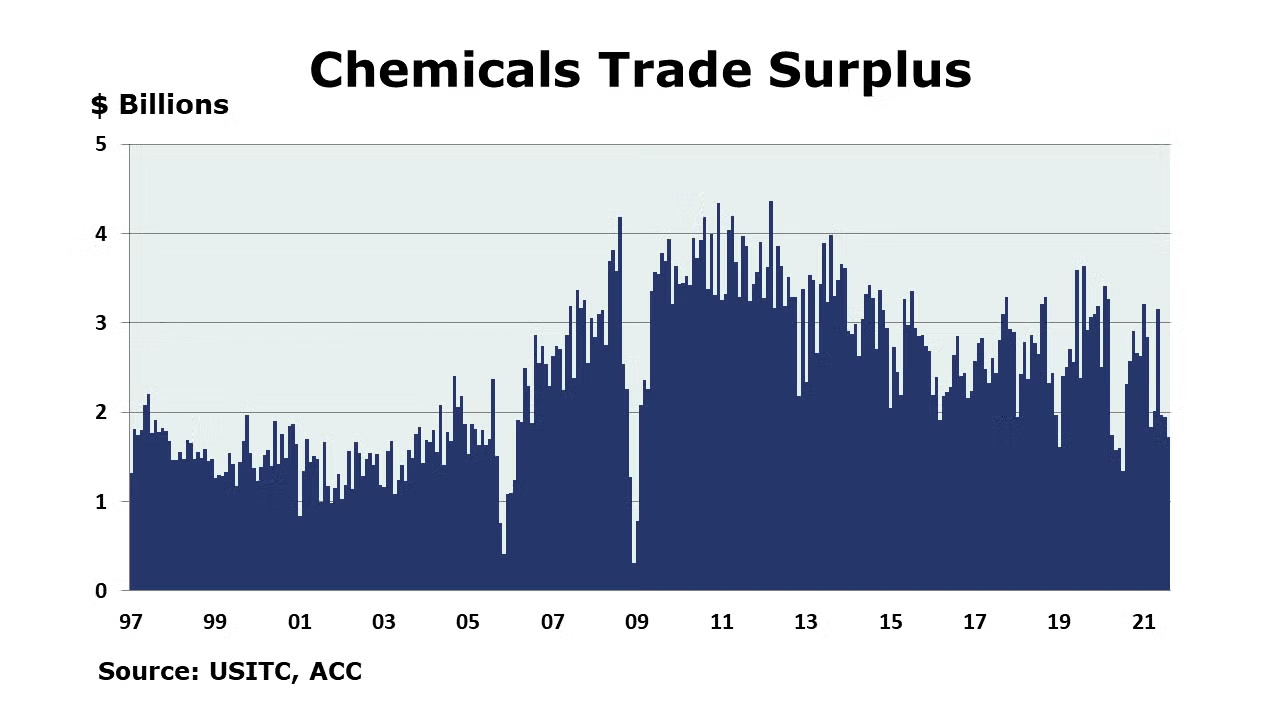
US chemicals exports rose by 3% in August to $13.4 billion. Exports were up 34% Y/Y. The gain was driven by a 7% rise in bulk petrochemicals and intermediates. Compared to the same YTD period in 2020 (Jan-Aug), US exports were 22% higher. Imports also rose in August and were up 5% to $11.7 billion. Imports were up 52% Y/Y and up 27% YTD/YTD. The gain was driven by an 11% rise in bulk petrochemicals and intermediates and an 11% rise in other specialties. Net exports (trade balance) were down $224 million in August to $1.7 billion. YTD, net exports of chemicals were $18.7 billion are upheld by a steady surplus in plastic resins.
Wholesale chemical inventories rose 2.9% by the end of August to $13.3 billion, a level 12.5% higher than levels in August 2020. Wholesale sales were up 3.9% in August to $12.1 billion, a level 37.8% higher than a year before. The inventories-to-sales ratio decreased to 1.09 in August from 1.11 in July and compares to 1.34 a year before (August 2020).
Note On the Color Codes
The banner colors represent observations about the current conditions in the overall economy and the business chemistry. For the overall economy we keep a running tab of 20 indicators. The banner color for the macroeconomic section is determined as follows:
Green – 13 or more positives
Yellow – between 8 and 12 positives
Red – 7 or fewer positives
For the chemical industry there are fewer indicators available. As a result we rely upon judgment whether production in the industry (defined as chemicals excluding pharmaceuticals) has increased or decreased three consecutive months.
For More Information
ACC members can access additional data, economic analyses, presentations, outlooks, and weekly economic updates through MemberExchange.
In addition to this weekly report, ACC offers numerous other economic data that cover worldwide production, trade, shipments, inventories, price indices, energy, employment, investment, R&D, EH&S, financial performance measures, macroeconomic data, plus much more. To order, visit http://store.americanchemistry.com/.
Every effort has been made in the preparation of this weekly report to provide the best available information and analysis. However, neither the American Chemistry Council, nor any of its employees, agents or other assigns makes any warranty, expressed or implied, or assumes any liability or responsibility for any use, or the results of such use, of any information or data disclosed in this material.
Contact us at ACC_EconomicsDepartment@americanchemistry.com