Running tab of macro indicators: 15 out of 20

The number of new jobless claims fell by 35,000 to 310,000 during the week ending 4 September, the lowest level since March 14, 2020. Continuing claims declined by 22,000 to 2.783 million and the insured unemployment rate for the week ending 28 August remained steady at to 2.0%.
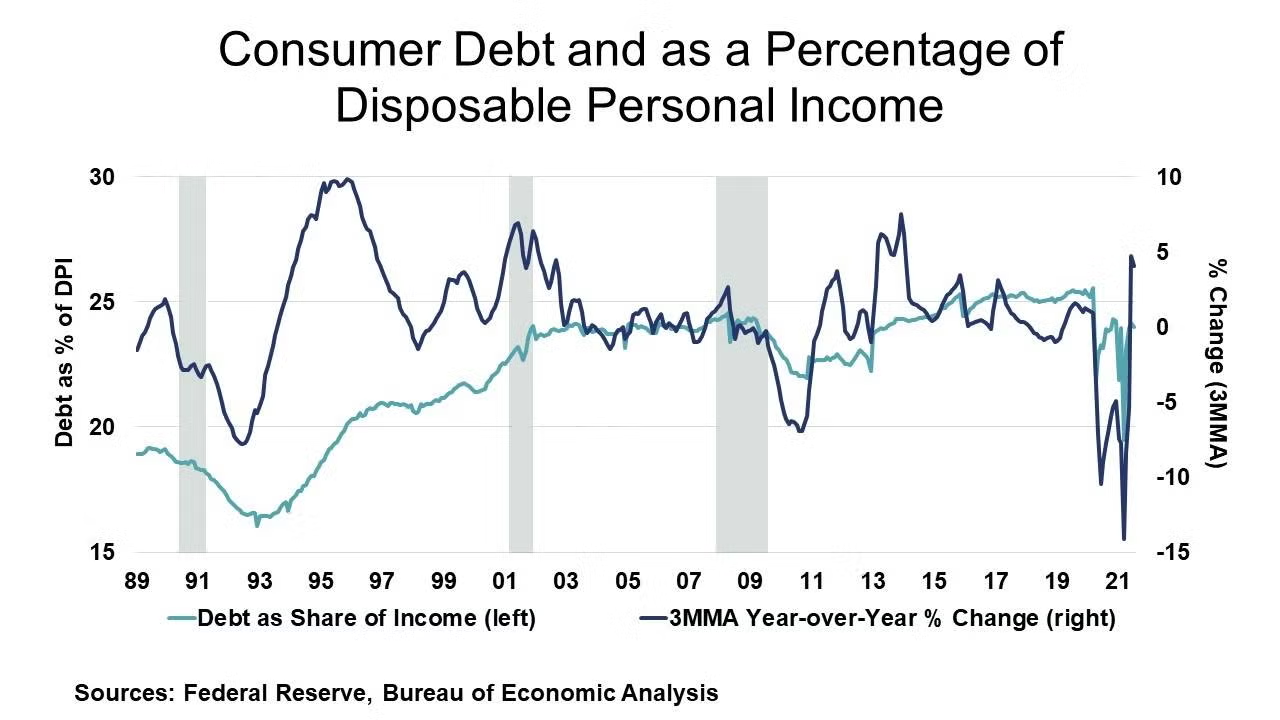
Following strong gains in May-June, the latest data on consumer credit indicate some easing in July. Consumer credit rose 0.4% ($17.0 billion) to $4.331 billion in July. Both revolving and non-revolving credit rose.
Amid continued supply chain bottlenecks and growing demand, headline producer prices continued to accelerate in August, up 0.7%, slightly ahead of expectations for continued strong gains. Food prices (especially meat and chicken) surged, and energy prices also continued to rise. Excluding the volatile food and energy components, core producer prices were up 0.6%. Compared to a year ago, headline prices were up 8.3% Y/Y while core prices were up by 6.3% Y/Y.
Sales at the wholesale level continued to rise, up 2.0% in July. Gains were generally broad-based with the largest gains in metals, machinery, furniture, automotive, drugs, and petroleum. Wholesale inventories also rose, by a smaller 0.6%. Compared to a year ago, sales were up 23.7% Y/Y while inventories were up 11.5% Y/Y. The inventories-to-sales ratio edged lower from 1.22 in June to 1.20 in July, the lowest ratio since 2014.
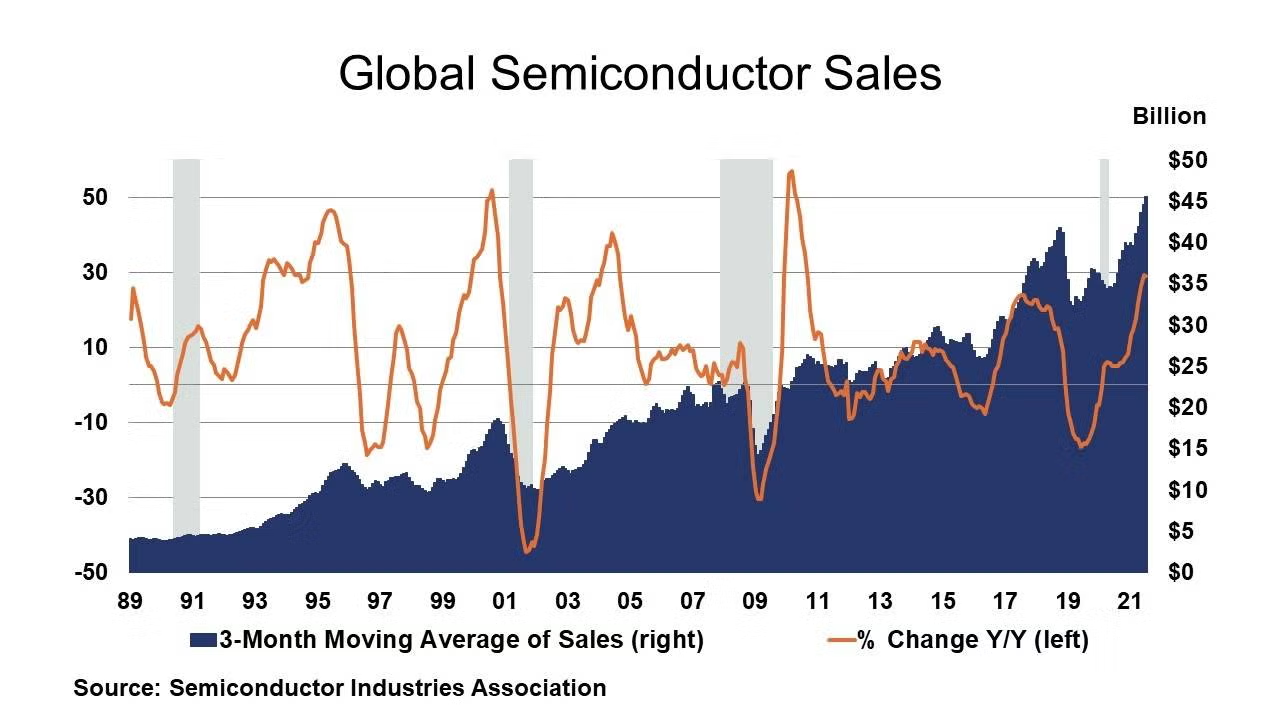
Global semiconductor sales increased 2.1% to $45.4 billion in July, with robust demand across nearly all major regional markets (sans Europe) and semiconductor product categories. Headline global sales were up 29.0% Y/Y.

GLOBAL SURVEY OF ECONOMIC FORECASTERS
- Global economic output contracted by 3.6% in 2020 but is expected to rebound by 6.1% in 2021 as vaccines are distributed and the global economic recovery strengthens.
- Global trade, which fell by 7.3% in 2020 will expand by 8.9% in 2021. The outlook for global industrial output is for a 7.3% gain in 2021.
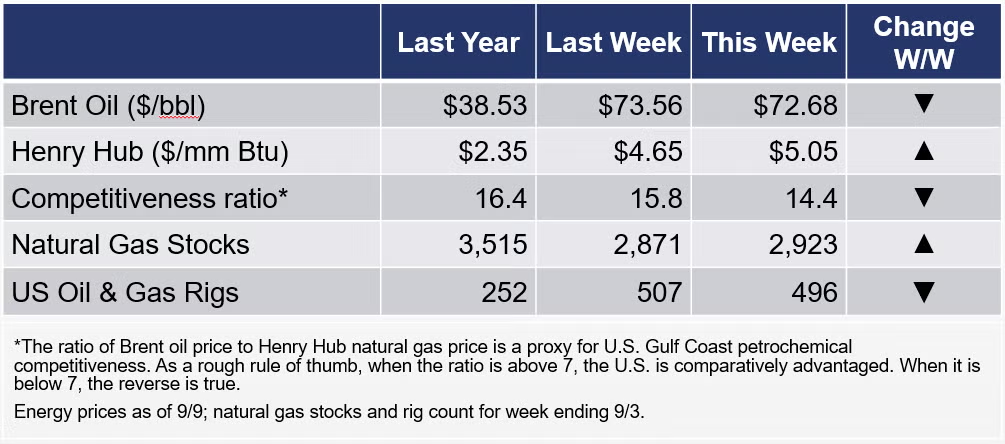
The rig count fell by 11 to 496 rigs during the week ending 3 September. Natural gas prices continued to rise during the week on concerns over tightening supplies, closing above $5 per mmbtu. Gas inventories were 16.8% below last year’s levels for the week ending 3 September.
For the business of chemistry, the indicators still bring to mind a green banner for basic and specialty chemicals.
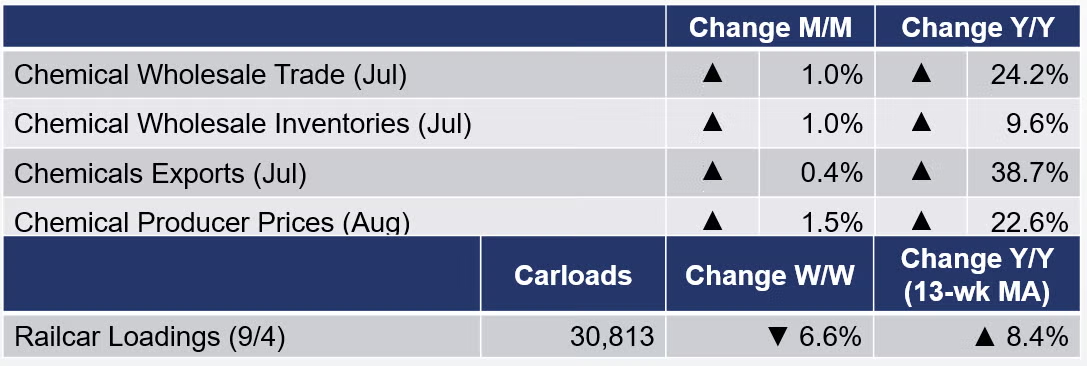
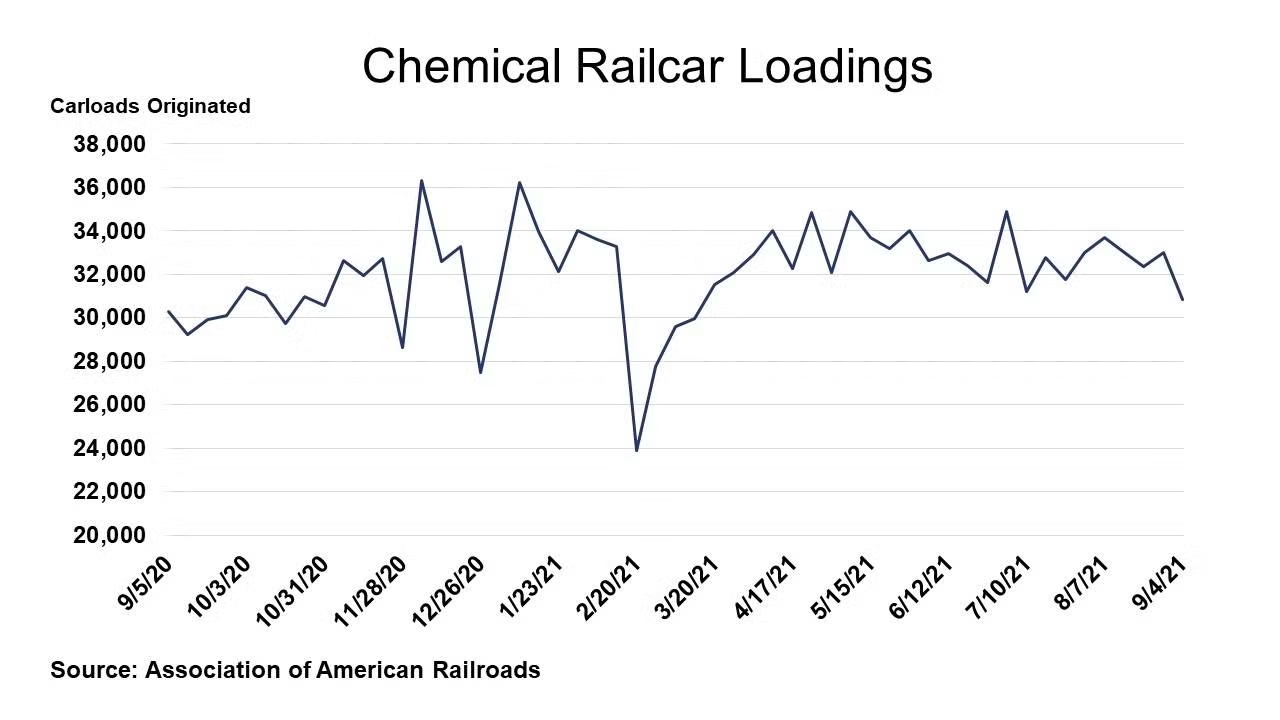
According to data released by the Association of American Railroads, chemical railcar loadings, the best ‘real time’ indicator of chemical industry activity, fell by 6.6% to 30,813 railcars during the week ending 4 September (week 35). Loadings were up 1.7% Y/Y and up 5.8% YTD/YTD. The 13-week moving average, which is used to smooth out volatility, was up 8.4%.
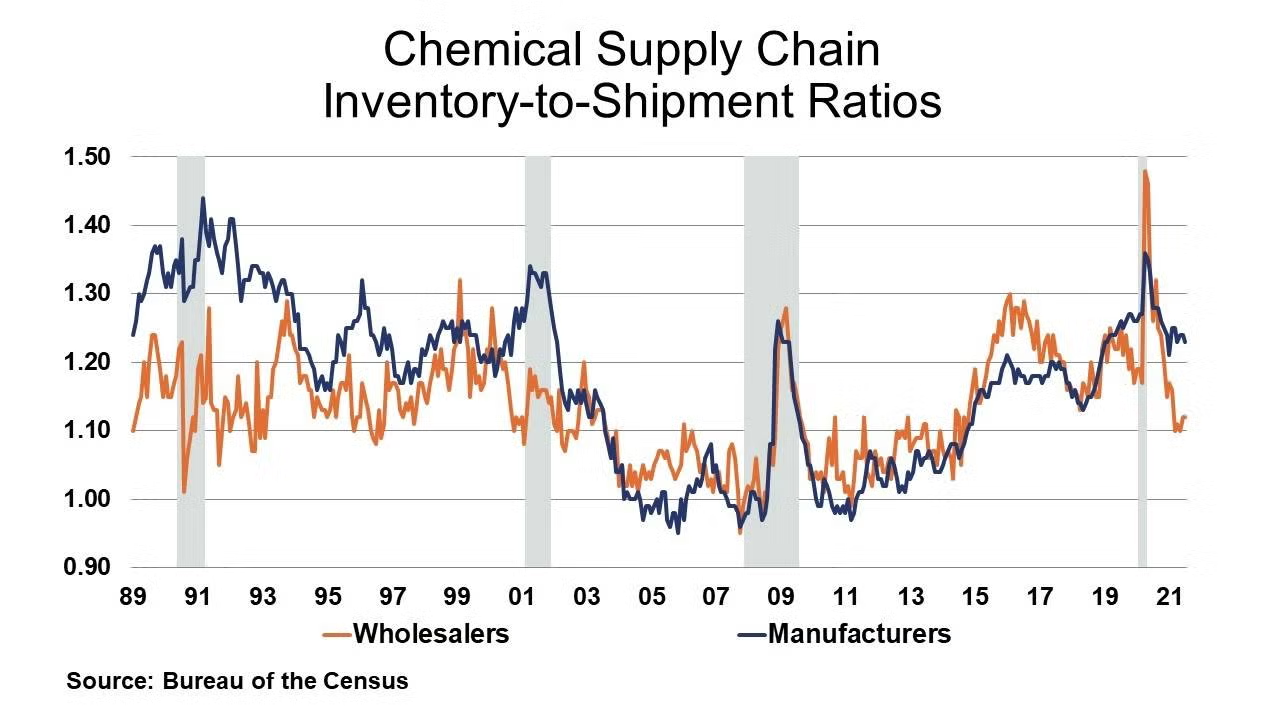
Chemical wholesale trade expanded by 1.0% in July, the 9th consecutive gain. Inventories of chemical products also rose by 1.0%. Compared to a year ago, sales were up 24.2% Y/Y while inventories were up 9.6% Y/Y. The inventories-to-sales ratio for chemicals remained steady at 1.12. A year ago, the ratio stood at 1.27. Inventories remain historically lean.
Chemical producer prices rose by 1.5% in August, the 15th consecutive monthly increase. Prices rose across all categories, with the exception of manufactured fibers. Compared to a year ago, chemical prices were up 22.6% Y/Y.
US chemicals exports were essentially flat in July but remain at levels 39% higher than July 2020 and were up 20% YTD/YTD. Gains in some categories of chemical exports were offset by declines in inorganics and synthetic fibers. Imports rose slightly, by 1%, in July and were up 38% Y/Y and 23% YTD/YTD. Imports of specialties and bulk petrochemicals and intermediates were down in July while imports in most other categories of chemicals rose. The chemicals trade surplus declined slightly to $1.9 billion in July and has reached $17 billion YTD.
Note On the Color Codes
The banner colors represent observations about the current conditions in the overall economy and the business chemistry. For the overall economy we keep a running tab of 20 indicators. The banner color for the macroeconomic section is determined as follows:
Green – 13 or more positives
Yellow – between 8 and 12 positives
Red – 7 or fewer positives
For the chemical industry there are fewer indicators available. As a result we rely upon judgment whether production in the industry (defined as chemicals excluding pharmaceuticals) has increased or decreased three consecutive months.
For More Information
ACC members can access additional data, economic analyses, presentations, outlooks, and weekly economic updates through MemberExchange.
In addition to this weekly report, ACC offers numerous other economic data that cover worldwide production, trade, shipments, inventories, price indices, energy, employment, investment, R&D, EH&S, financial performance measures, macroeconomic data, plus much more. To order, visit https://store.americanchemistry.com/.
Every effort has been made in the preparation of this weekly report to provide the best available information and analysis. However, neither the American Chemistry Council, nor any of its employees, agents or other assigns makes any warranty, expressed or implied, or assumes any liability or responsibility for any use, or the results of such use, of any information or data disclosed in this material.
Contact us at ACC_EconomicsDepartment@americanchemistry.com
Upcoming Events of Interest
“Americas Chemicals and Polymers Conference” Virtual Event
14-15 September 2021
Wood Mackenzie
www.woodmac.com/events/americas-chemicals-and-polymers-conference
Hydrocarbon Processing IRPC Operations Virtual Event
Hydrocarbon Processing/Gulf Energy Information
21-22 September 2021
https://web.cvent.com/event/ec87ac54-5d81-48f7-a4db-c7f82f1c4e73/summary
“Economic, Energy and Chemical Industry Trends and Outlook” Webinar
Dr. Kevin Swift, Chief Economist | American Chemistry Council
12:00 – 2:00 pm | 22 September 2021
Société de Chimie Industrielle
www.societe.org
“Hexion: Sharpening Innovation for Growth” Webinar
Craig Rogerson - Chairman, President & CEO | Hexion
11:00 am | 23 September 2021
CME - Chemical Marketing & Economics
www.cme-stem.org
“Shocks, Shifts, and Emerging Economic Landscape”
63rd NABE Annual Meeting
26-28 September 2021
Marriott Crystal Gateway | Arlington, VA
National Association for Business Economics (NABE)
www.nabe.com
“The Evolving Impact of ESG on the Chemical Industry” Webinar
Joseph Chang - Global Editor | ICIS Chemical Business; Robert Westervelt - Editor-in-Chief | IHS Chemical Week; and Peter Young - CEO & Managing Director | Young & Partners
1:00 – 2:15 pm | 29 September 2021
Société de Chimie Industrielle
www.societe.org

