Running tab of macro indicators: 9 out of 20
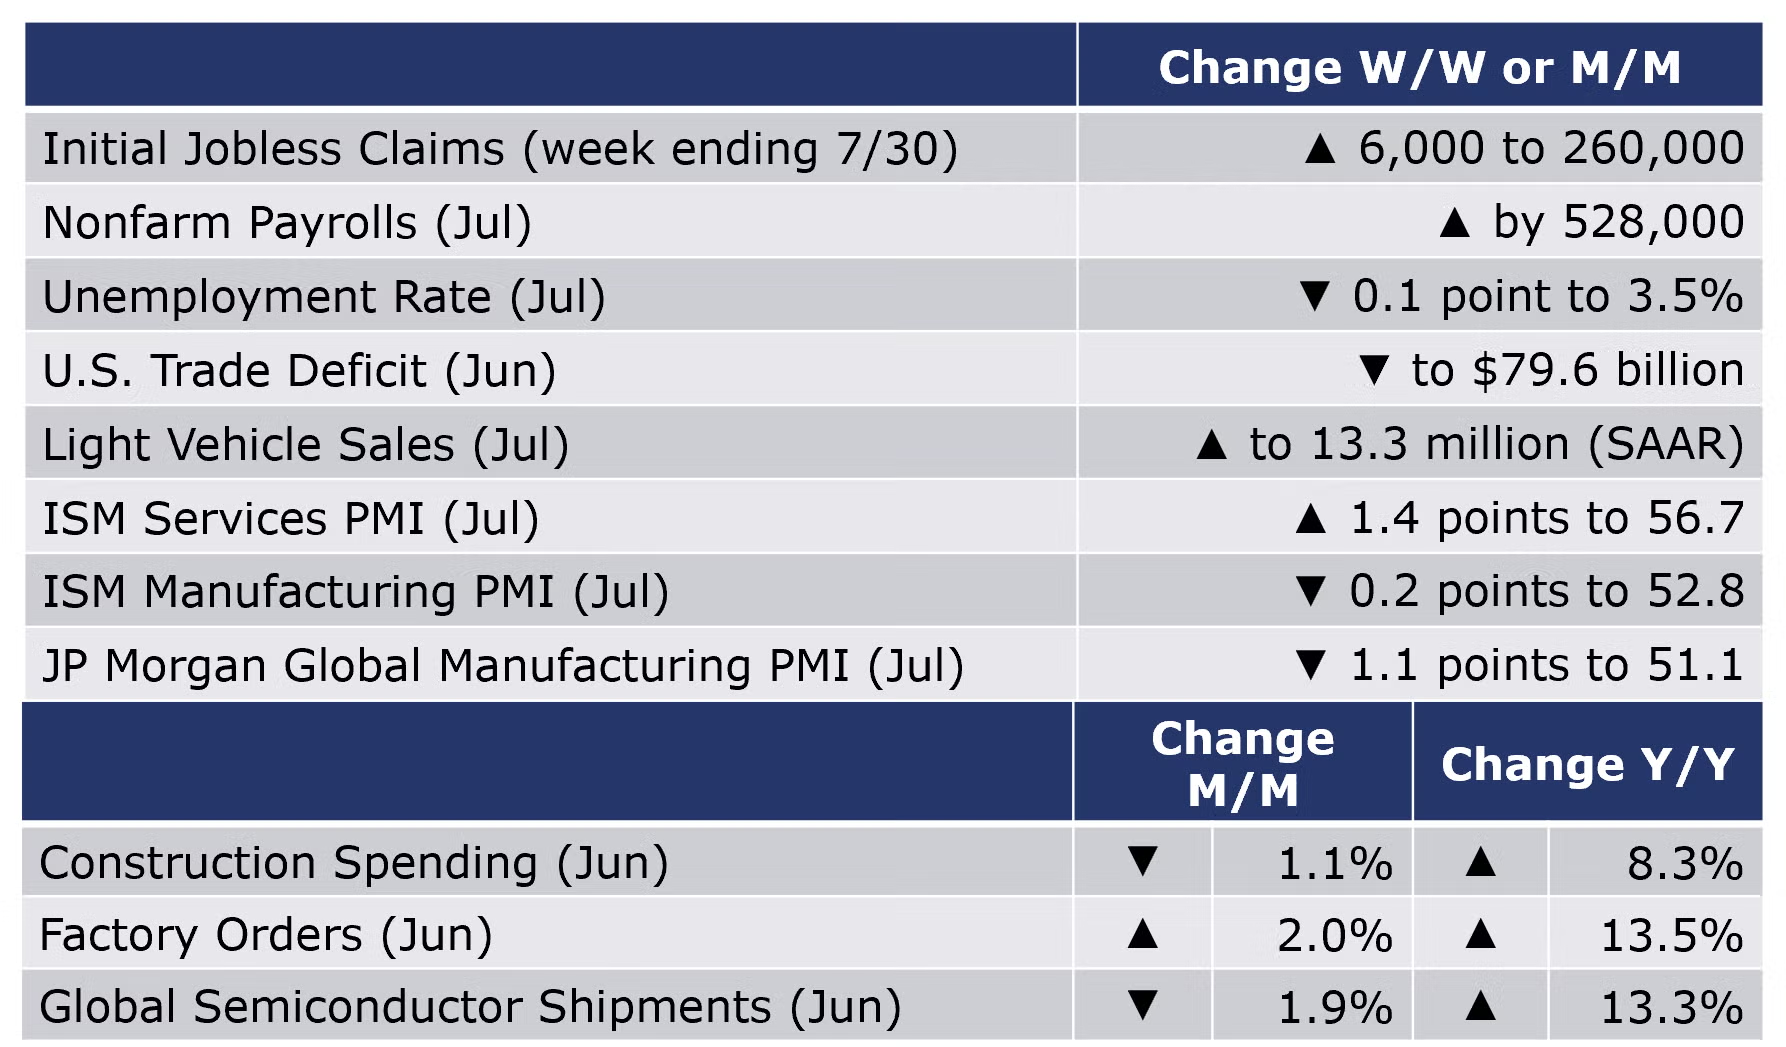
The number of new jobless claims was up 6,000 to 260,000 during the week ending 30 July. Continuing claims increased by 48,000 to 1.42 million, and the insured unemployment rate for the week ending 23 July was unchanged at 1.0%. Hourly wages rose 5.2% Y/Y, the same as in June.
Nonfarm payrolls jumped in July, up by 528,000, double the expected gain. With the July gain, both total nonfarm employment and the unemployment rate have returned to their February 2020 pre-pandemic levels. Job growth was widespread, led by gains in leisure and hospitality, professional and business services, and health care. Manufacturing employment continued to expand. Average hourly wages for all workers continued to grow at 5.2% Y/Y, the same pace as in June. This will continue to add pressure to prices, making another aggressive rate hike in September more likely. The unemployment rate edged lower to its pre-pandemic low of 3.5% as the number of unemployed people fell. The labor force contracted slightly, and the labor force participation rate slipped to 62.1%, still more than a percentage point below February 2020.
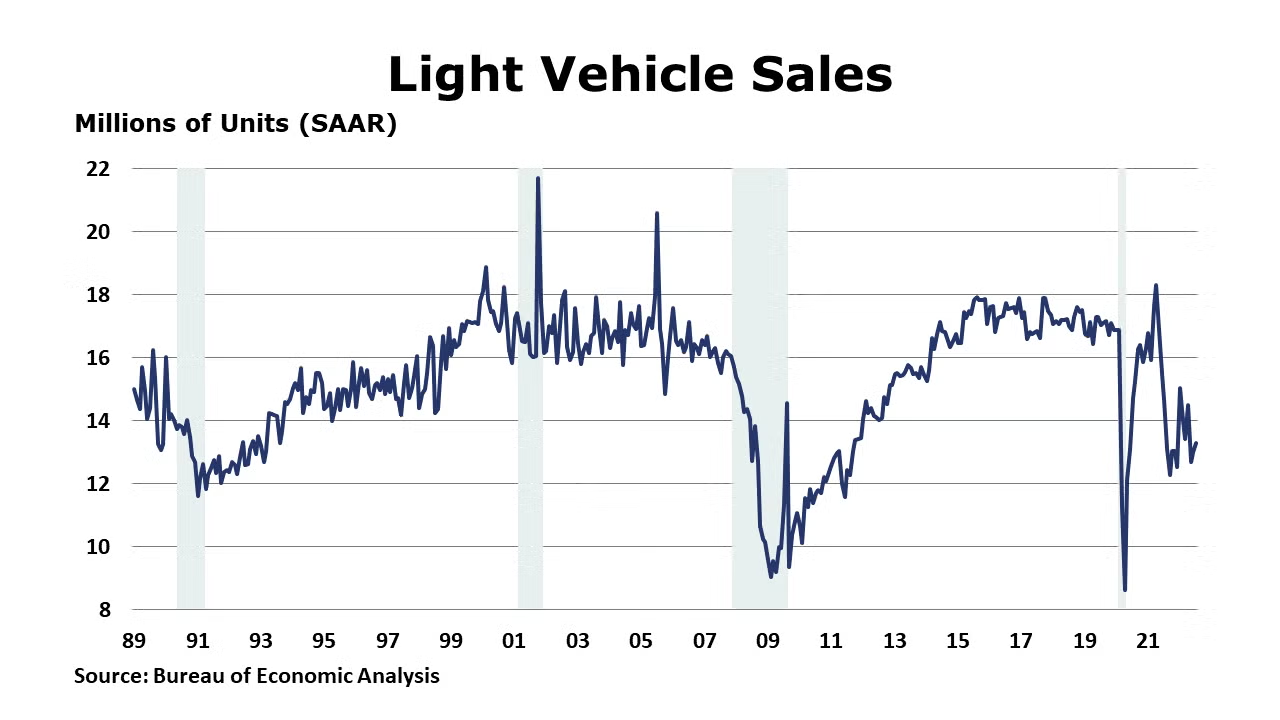
As supply chain pressures eased, light vehicle sales rose for a second month to a 13.3 million seasonally adjusted annual rate in July. This remains well below the pre-pandemic level of ~17 million, however.
The U.S. trade deficit narrowed to $79.6 billion in June as the monthly rise in exports combined with a decline in imports. Exports were up 1.7% to $260.8 billion while imports were down 0.3% to $340.4 billion. Exports of goods increased driven by higher exports of industrial supplies and materials (including gold and natural gas), soybeans, wheat, and civilian aircraft. The decline in imported goods reflects lower imports of automotive vehicles, parts, and engines, and foods, feeds, and beverages. Imports from China, the largest source of U.S. imported goods, increased in June.
Construction spending fell 1.1% in June, the first monthly decline since last September. Spending fell across all major categories and was significantly lower in single-family residential reflecting declining activity in that segment due to higher mortgage rates and high home prices that are pricing many potential homebuyers out of the market. Compared to a year ago, overall construction spending was up 8.3%.
The ISM Services PMI rose by 1.4 percentage points to 56.7 in July, picking up some momentum from June. A reading above 50 indicates expansion. Business activity continued to expand and at a faster pace. New orders and export orders grew, also at accelerated paces. Employment, inventories and imports contracted. The majority of services industries covered reported growth in July. The three industries reporting a decrease were Agriculture, Forestry, Fishing & Hunting; Retail Trade; and Finance & Insurance. The report noted, “Availability issues with overland trucking, a restricted labor pool, various material shortages and inflation continue to be impediments for the services sector.” A respondent from construction noted, “Interest rates have significantly impacted the homebuilding market. Cancellation rates have increased, as homebuyers can no longer afford the monthly payment. Traffic to our communities is down. Inflation has sidelined many would-be buyers.”
The ISM Manufacturing PMI eased by 0.2 percent points to 52.8 in July. Eleven of 18 industries reported growth. New orders fell at a faster rate and production grew at a slower pace. The closely watched supplier deliveries component continued to slow, suggesting supply chain problems that have plagued the manufacturing sector for more than a year are easing. Concerningly, inventories rose at a faster rate to 57.3, the highest reading since 1984.
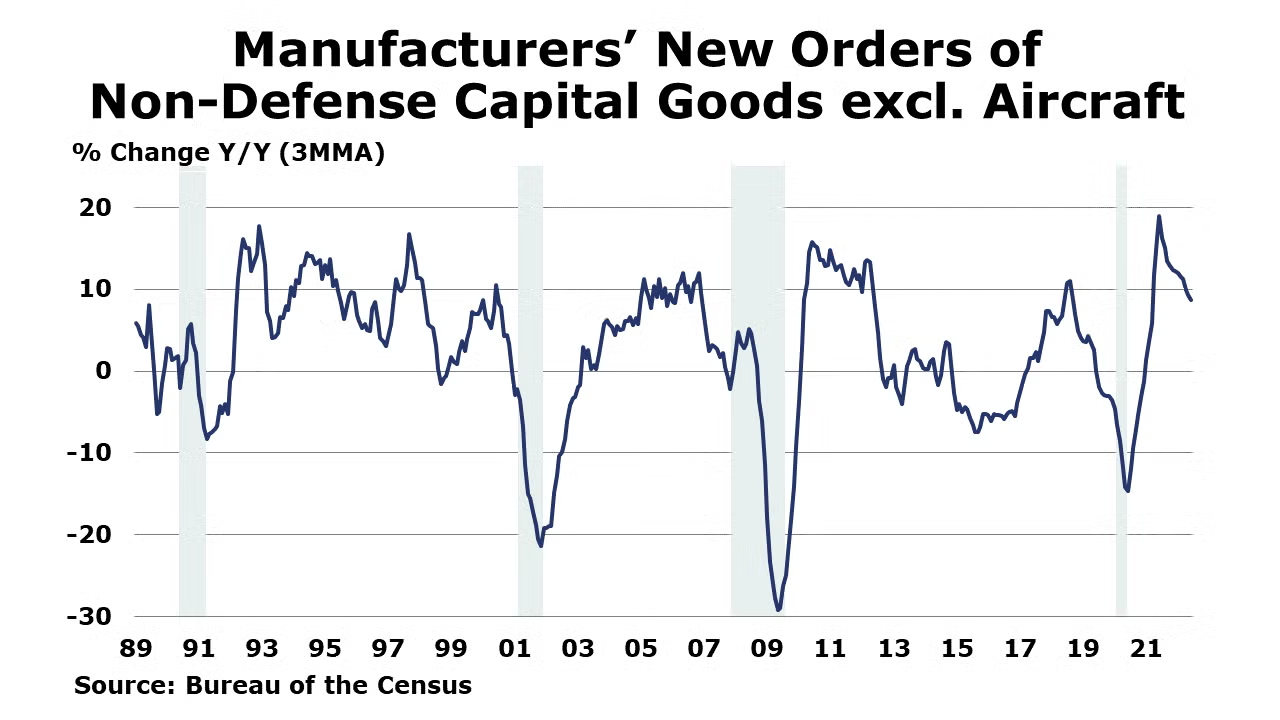
Factory orders continued to expand in June, up 2.0%, with notable gains in defense aircraft and parts, household appliances, and computers and electronic products. New orders for core business goods were up 0.7%. Headline orders were up 13.5% Y/Y while core business orders were up 10.1% Y/Y. Unfilled orders, a measure of the manufacturing pipeline, expanded by 0.7%, an acceleration from than previous months’ gains. Manufacturing shipments were up 0.3% and inventories were up 0.4%. This represents a sharp deceleration in growth compared to earlier in the year, especially considering that all these measures reflect nominal values (i.e., not adjusted for inflation). The ratio of inventories-to-shipments was lower at 1.45. A year ago, the ratio was 1.51.
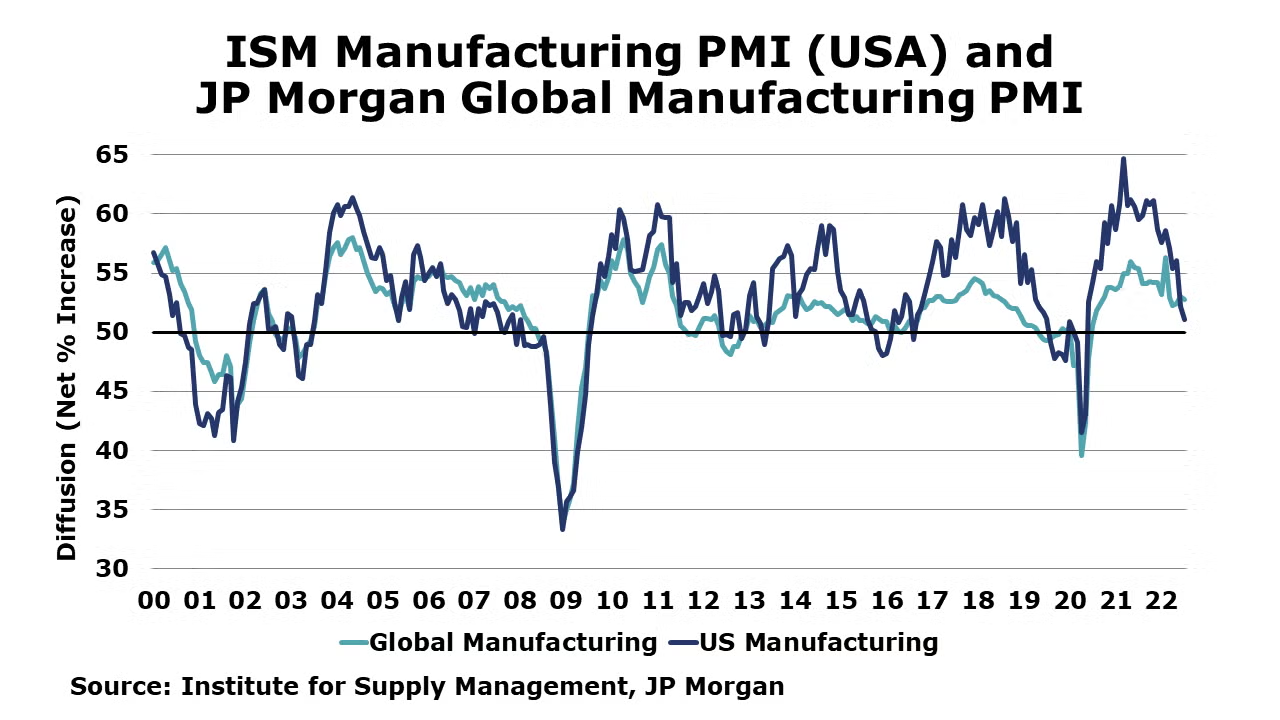
The JP Morgan Global Manufacturing PMI fell in July to a two-year low as the headline index eased by 1.1 points to 51.1. Output stagnated and new orders declined. New export orders fell at a faster rate. Price inflation and supply chain pressures eased. While output growth in emerging markets rose for a second month, the pace slowed reflecting the boost in June from the easing of lockdowns in China.
Global semiconductor sales fell 1.9% in June with declines across all regions. Compared to a year ago, sales remained ahead by 13.3% with the largest Y/Y gain in the Americas region.
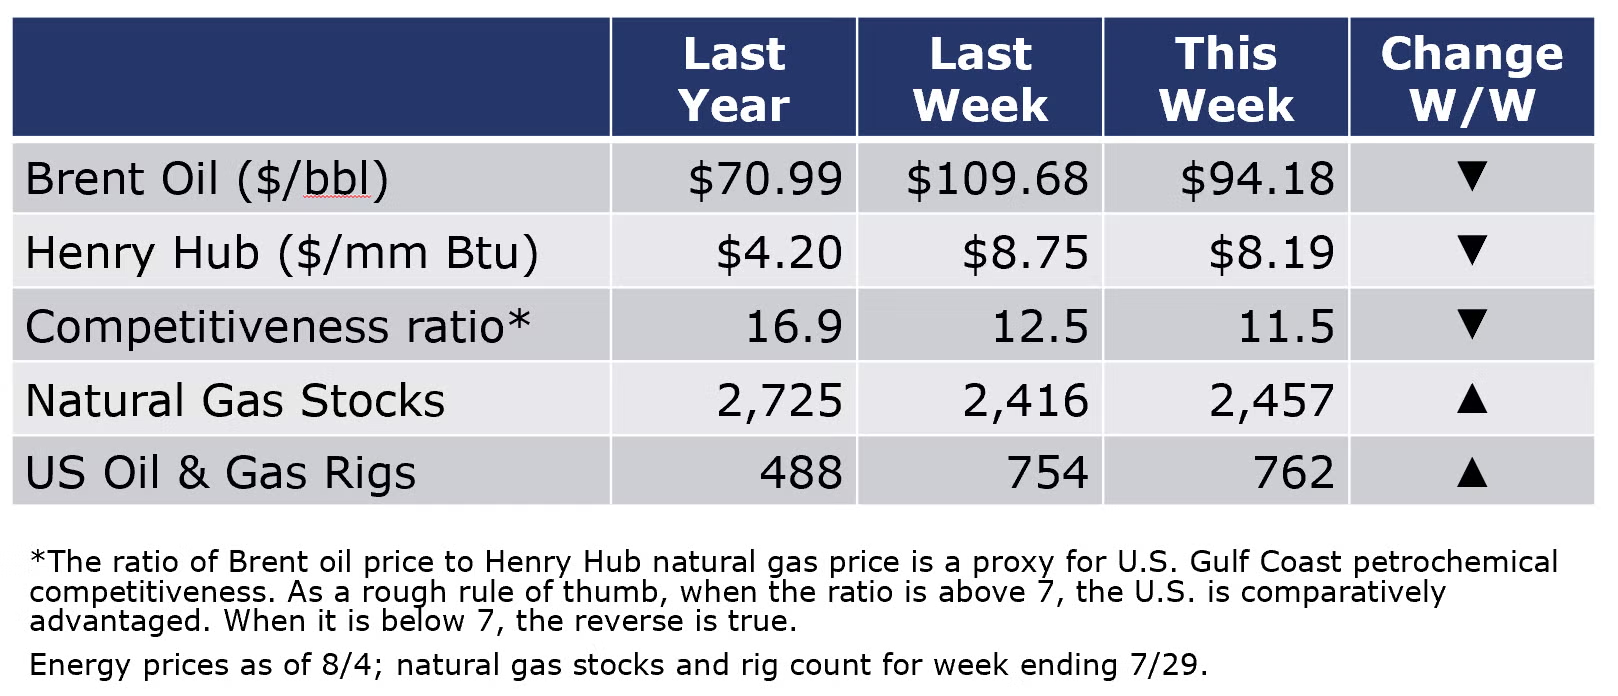
Oil and gas prices were lower compared to last week but remain elevated. Oil prices edged down on weaker economic expectations and gas futures eased as soaring temperatures take a break over the next few weeks. The combined oil and gas rig count rose by eight to 762 during the week ending 7/30.
For the business of chemistry, the indicators still bring to mind a green banner for basic and specialty chemicals.
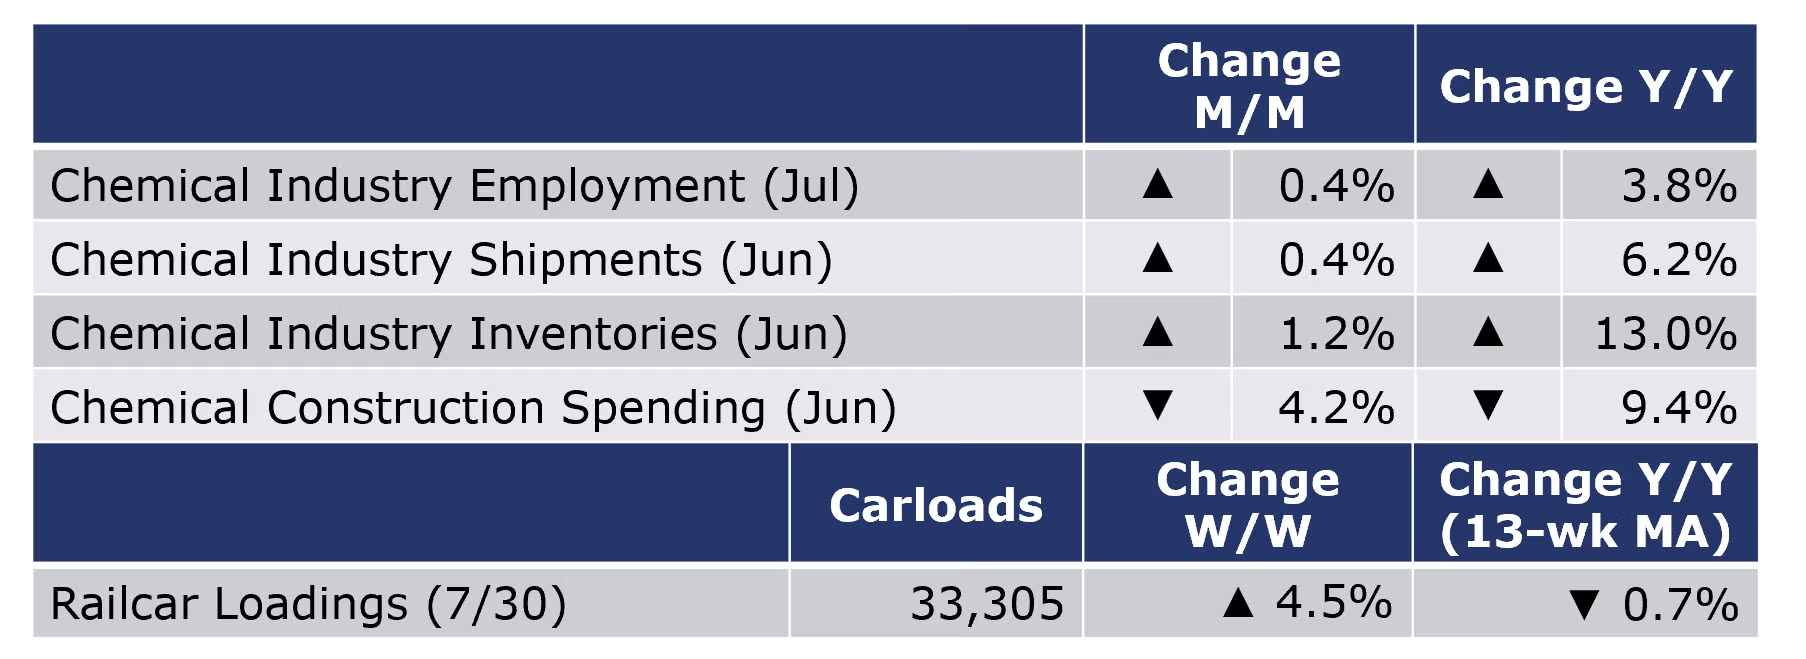
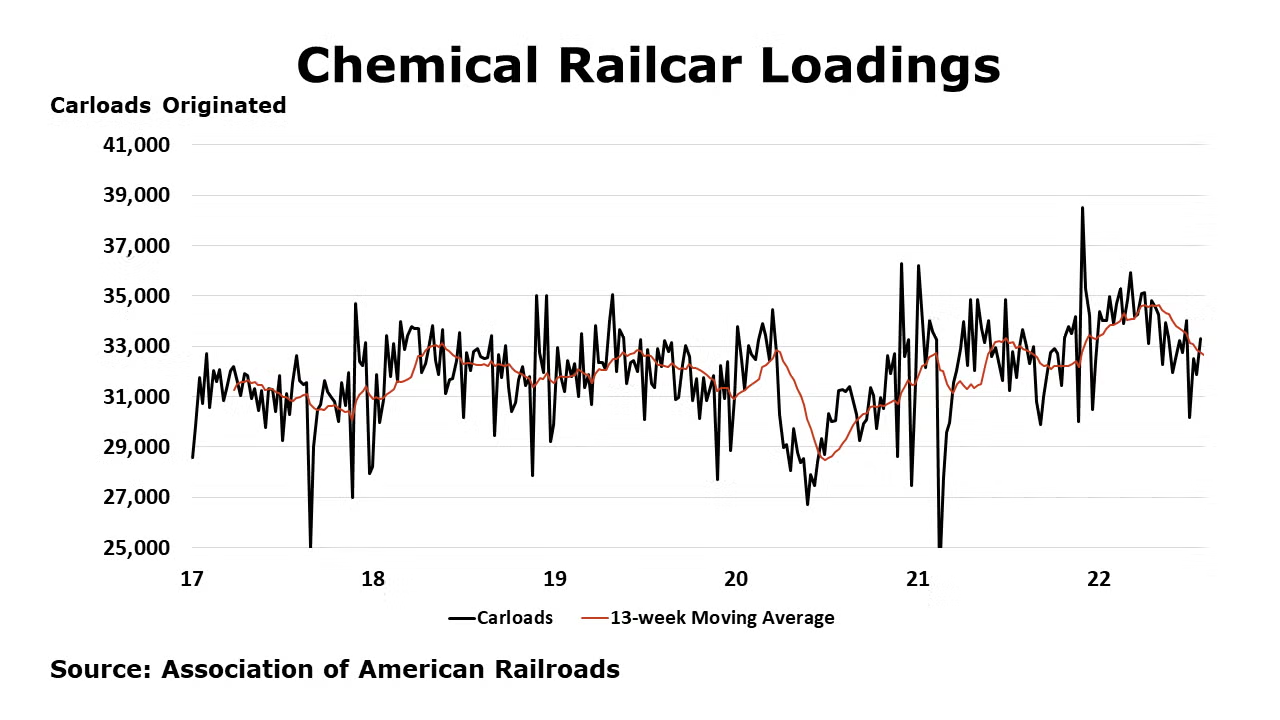
According to data released by the Association of American Railroads, chemical railcar loadings were up 4.5% W/W for the week ending 7/30. Loadings were down 0.7% Y/Y on a 13-week MA. Loadings were up 4.1% YTD/YTD and have only been on the rise for 6 of the last 13 weeks.
Within the details of the ISM report, the chemical industry was reported to have contracted in July. There were contractions in new orders, employment, new export orders and imports. The chemical industry was one of three industries that reported that customer inventories were “too high”. One chemical industry respondent noted: “Inflation is slowing down business. Overstock of raw materials due to prior supply chain issues and slowing orders.”
Chemical industry employment (including pharmaceuticals) rose by 3,700 (0.4%) in July. The gain reflected higher employment in both production and supervisory/non-production workers. Employment was up by 33,300 (3.8%) from a year ago. Wages for production workers rose 1.8% Y/Y to $27.37. The average workweek remained steady at 40.9 hours. The total labor input into chemical manufacturing rose 0.8% in July, in contrast with the ISM report which suggested a contraction in chemical manufacturing.
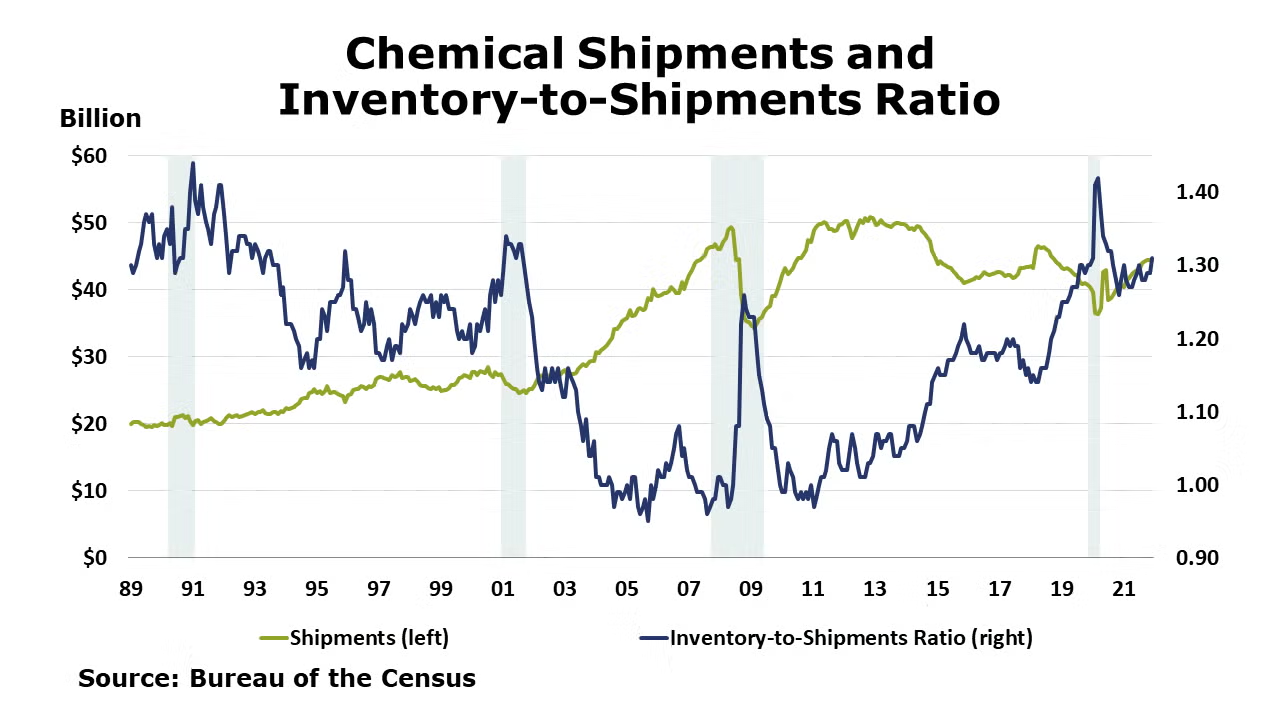
Chemical shipments continued to expand in June, up by another 0.4% with a large gain in shipments of agricultural chemicals and smaller gains in shipments of coatings and other chemicals. Chemical inventories also rose, by 1.2%, with gains across all segments. Compared to a year ago, shipments were up 6.2% Y/Y while inventories were ahead 13.0% Y/Y. The inventories-to-sales ratio rose to 1.35, the highest since pandemic lockdowns ended. As supply chain constraints have eased and growth in shipments is slowing, inventories have accumulated which may weigh on future production growth.
Chemical industry construction spending continued to decline, falling 4.2% to $25.5 billion seasonally adjusted annual rate in June and was off 9.4% Y/Y.
Note On the Color Codes
The banner colors represent observations about the current conditions in the overall economy and the business chemistry. For the overall economy we keep a running tab of 20 indicators. The banner color for the macroeconomic section is determined as follows:
Green – 13 or more positives
Yellow – between 8 and 12 positives
Red – 7 or fewer positives
For the chemical industry there are fewer indicators available. As a result we rely upon judgment whether production in the industry (defined as chemicals excluding pharmaceuticals) has increased or decreased three consecutive months.
For More Information
ACC members can access additional data, economic analyses, presentations, outlooks, and weekly economic updates through MemberExchange.
In addition to this weekly report, ACC offers numerous other economic data that cover worldwide production, trade, shipments, inventories, price indices, energy, employment, investment, R&D, EH&S, financial performance measures, macroeconomic data, plus much more. To order, visit https://store.americanchemistry.com/.
Every effort has been made in the preparation of this weekly report to provide the best available information and analysis. However, neither the American Chemistry Council, nor any of its employees, agents or other assigns makes any warranty, expressed or implied, or assumes any liability or responsibility for any use, or the results of such use, of any information or data disclosed in this material.
Contact us at ACC_EconomicsDepartment@americanchemistry.com