Running tab of macro indicators: 10 out of 20
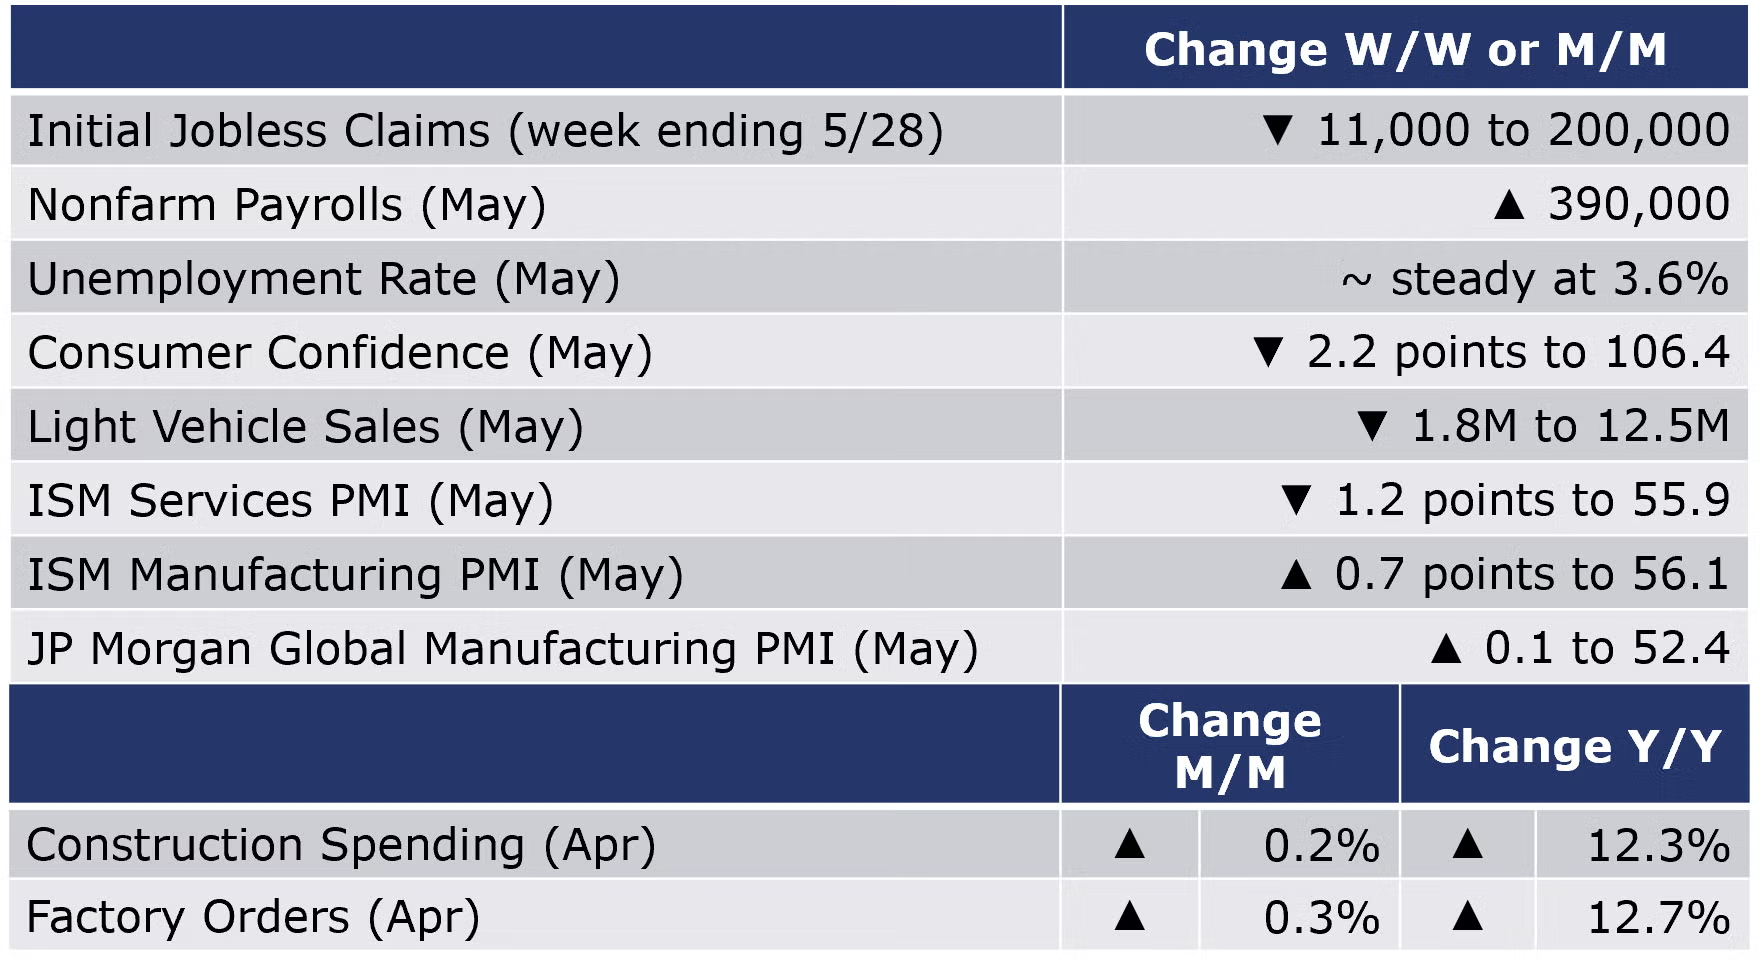
Nonfarm payrolls grew by 390,000 in May, the smallest monthly gain since April 2021. Notable job gains were in leisure and hospitality, professional and business services and transportation and warehousing. Employment in retail trade declined. Employment remains below pre-Covid levels by 822,000. Manufacturing payrolls grew by 18,000, the 13th month of consecutive monthly gains. Average hourly wages for non-supervisory and production workers grew by 6.5% Y/Y to $27.33, the slowest annual pace since December. The labor force grew and most new entrants moved into the ranks of the employed. The participation rate ticked up to 60.1%, tying March for the highest rate since the pandemic began. The unemployment rate remained steady for a third month at 3.6%.
The number of new jobless claims fell by 11,000 to 200,000 during the week ending 28 May. For the week ending 14 May, continued claims fell by 34,000 to 1.309 million, the lowest level since December 27, 1969! The insured unemployment rate for the week ending May 21 was 0.9%, down slightly (0.1 percentage point) compared to the prior week.
Heightened uncertainty and inflation weighed on consumers in May. The Conference Board’s consumer confidence index fell 2.2 points to 106.4 as consumers’ short-term outlook for income, business, and labor market conditions deteriorated. Purchasing intentions for cars, homes, and major appliances all cooled, likely in response to higher interest rates.
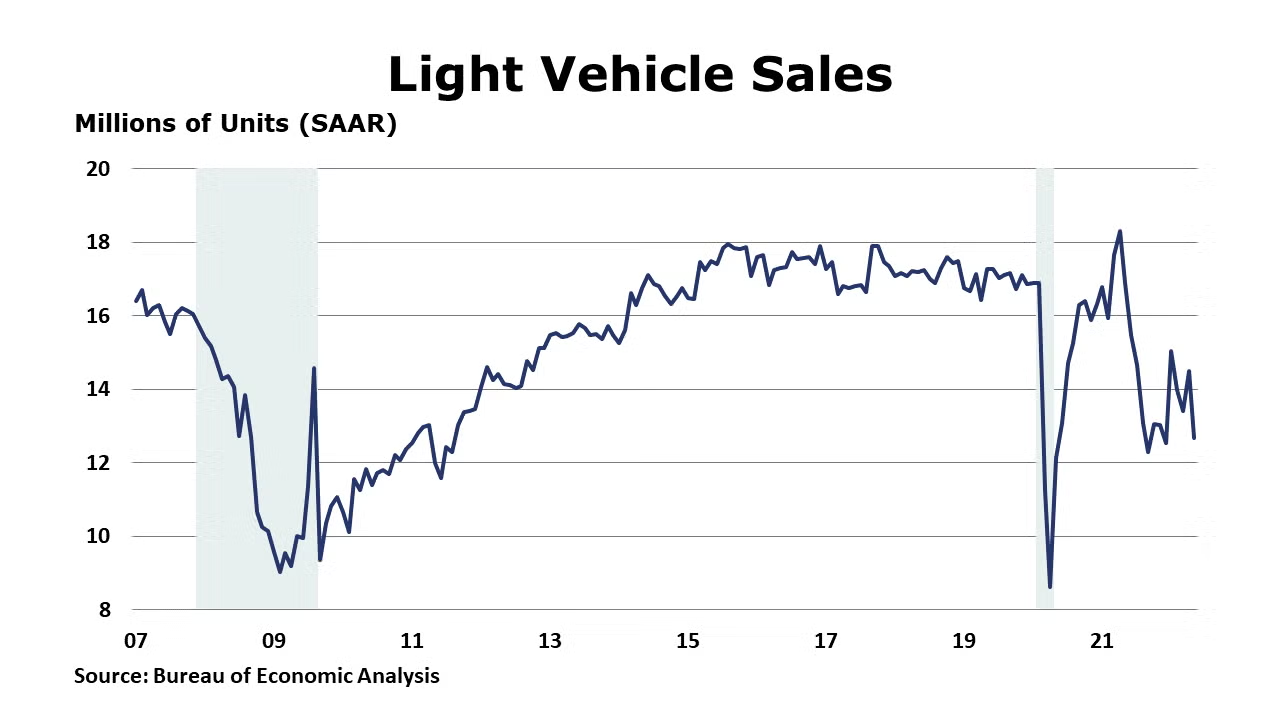
Light vehicles fell from a 14.5 million seasonally adjusted annual pace to a 12.7 million pace in May. That pace was off 25% from a year ago as the vehicle sector has been plagued by persistent shortages of semiconductors and other critical materials.
Construction spending increased 0.2% in April. Spending on private residential projects rose 0.9%, reflecting gains in new single-family and new multifamily home projects. Public construction spending fell by 0.7% in April with declines in every category except amusement and recreation. Compared to a year ago, the value of overall construction spending was up 12.3%.
The ISM Services PMI slipped by 1.2 points to 55.9 in May. A reading above 50 indicates expansion. Business activity continued to expand, but at a slower pace. New orders, export orders, and employment grew at a faster pace. Growth in inventories slowed and inventory sentiment suggests that inventories are “too low” and insufficient for business requirements. The prices index eased from an all-time high. Of the 17 industries covered, 14 reported growth. The three that reported a decrease included agriculture, retail trade, and information.
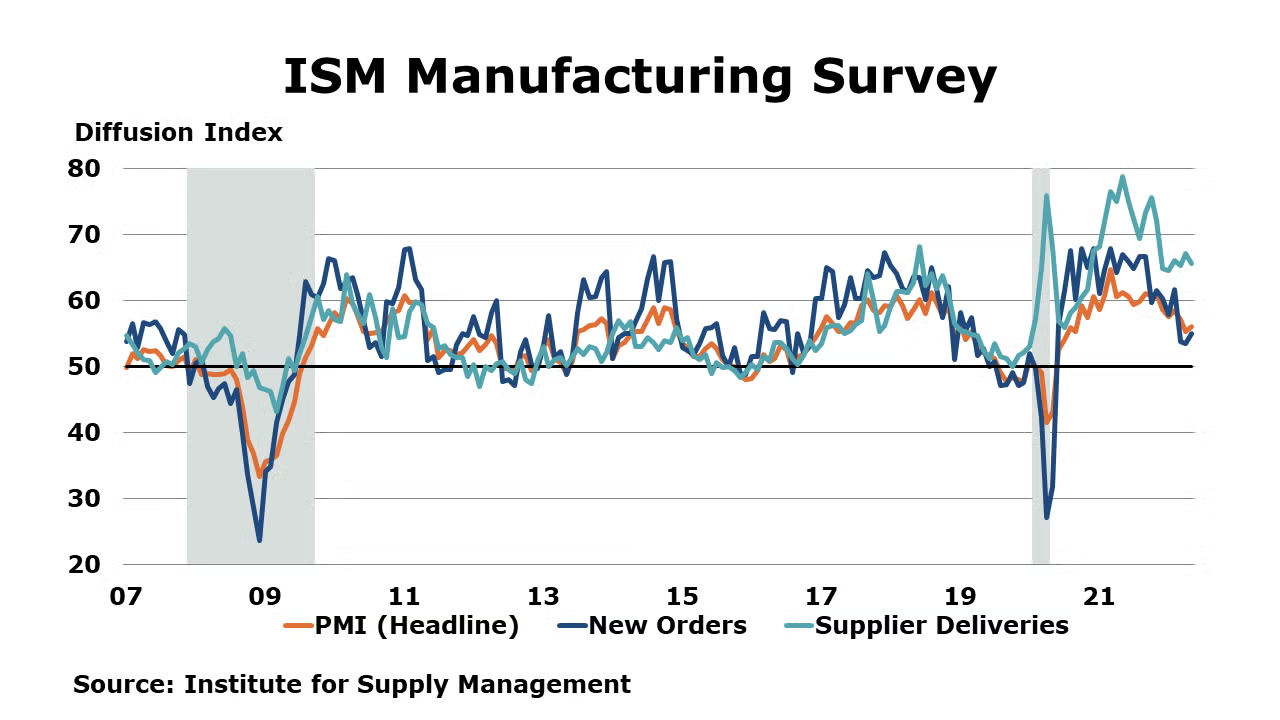
The ISM Manufacturing PMI increased by 0.7 points to 56.1%, suggesting that manufacturing expanded at a faster pace in May. Fifteen industries, including chemical products, reported growth. The only industry reporting a decrease in May compared to April is furniture and related products. New orders, production, inventories, and order backlogs rose at a faster pace. The closely watched supplier deliveries component which measures how much slack exists in the supply chain suggested that delivery times were increasingly delayed. Prices continued to rise, but at a slower pace than in April. Globally, manufacturing slightly increased in May suggesting expansion at a steady pace, according to the JP Morgan Global Manufacturing PMI which rose 0.1 points to 52.4. Output declined, the downturn reflecting a continued downturn in China where tighter COVID restrictions have limited production. Input prices remain a considerable challenge and reflect inflation at a record high. The report noted that numerous national manufacturing sectors outside of China continued to expand, demonstrating resilience in May.
Following a 1.8% gain in March, factory orders rose 0.3% in April with the largest gains in defense capital goods. New orders for consumer nondurables and construction materials also rose, while orders for ICT, motor vehicles and consumer durables declined. Core business orders rose by 0.4% following a 1.1% gain the previous month. Unfilled orders, a measure of the manufacturing pipeline, rose 0.5%, the same as in March. Manufacturing shipments were higher by 0.2% (following a 2.2% gain in March) and inventories rose by 0.6% (following a 1.4% gain in March). The inventories-to-shipments ratio ticked higher to 1.48. A year ago, it was 1.52.
Federal Reserve Beige Book
All twelve Federal Reserve Districts have reported continued economic growth since the prior Beige Book period, with a majority indicating slight or modest growth; four Districts indicated moderate growth. Four Districts explicitly noted that the pace of growth had slowed since the prior period. Contacts in most Districts reported ongoing growth in manufacturing. Retail contacts noted some softening as consumers faced higher prices, and residential real estate contacts observed weakness as buyers faced high prices and rising interest rates. Contacts tended to cite labor market difficulties as their greatest challenge, followed by supply chain disruptions. Rising interest rates, general inflation, the Russian invasion of Ukraine, and disruptions from COVID-19 cases (especially in the Northeast) round out the key concerns impacting household and business plans. Eight Districts reported that expectations of future growth among their contacts had diminished; contacts in three Districts specifically expressed concerns about a recession.
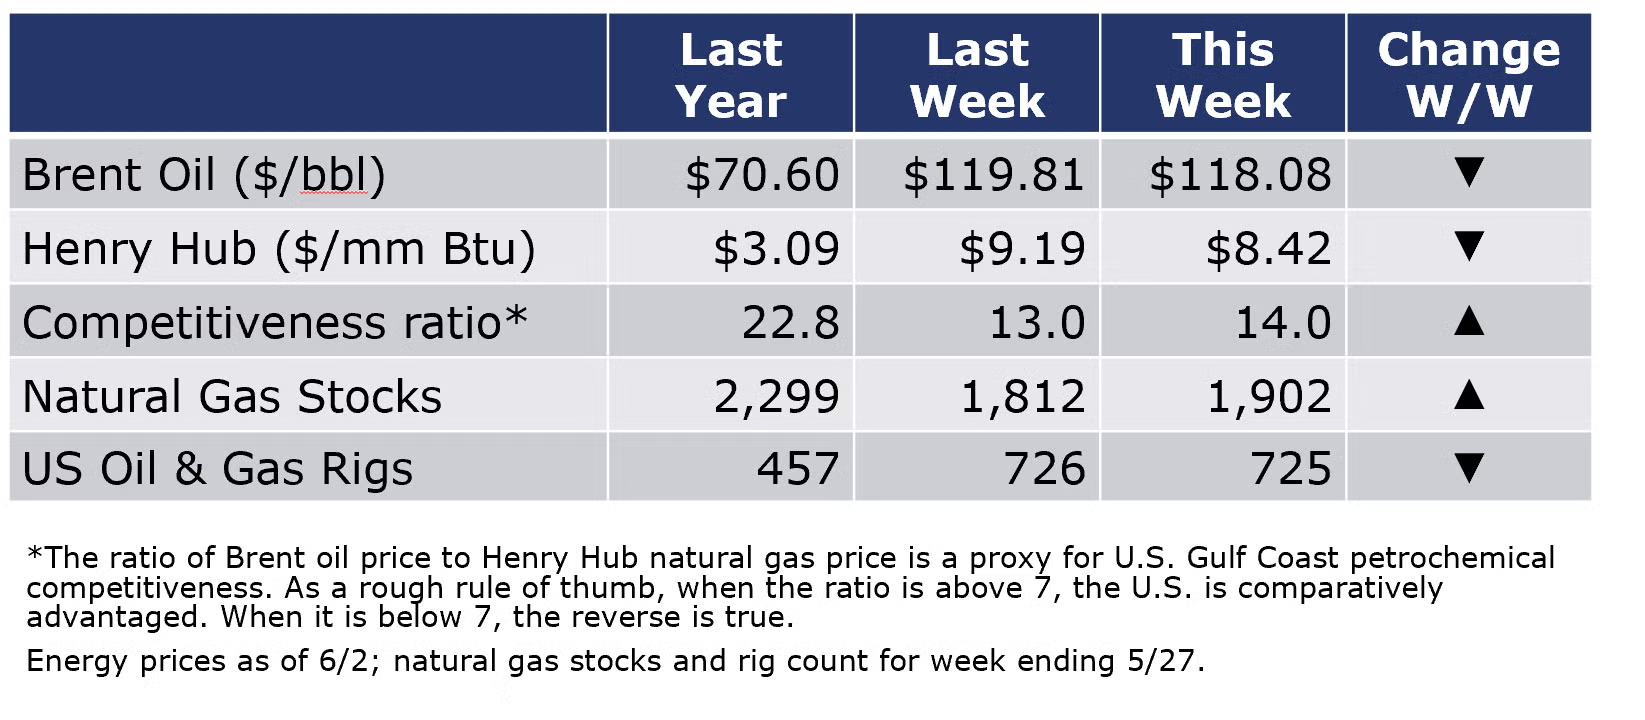
Oil prices surged above $120/barrel earlier in the week as China began relaxing lockdowns in Shanghai but have eased slightly with an agreement by OPEC to raise production faster than expected. Natural gas prices were a little lower than last Thursday but remained above $8.50/mmbtu as summer weather has rolled in (boosting gas-powered electric demand) while gas inventories remain well-below normal. The combined oil and gas rig count fell by one to 725 in the most recent week, the first decline in 10 weeks and the second decline since October.
For the business of chemistry, the indicators still bring to mind a green banner for basic and specialty chemicals.
Within the details of the ISM Manufacturing PMI report, chemical products was listed as one of the industries reporting moderate-to-strong growth in May. Chemical industry respondents reported growth in new orders, higher inventories, increased employment growth, new export orders, and imports and paying higher prices for raw materials in May. They reported no change in order backlogs, that customer inventories were “too low” and slower supplier deliveries reflecting continued obstacles across the supply chain, with labor and through the transportation and distribution network. One plastics and rubber products respondent provided a comment: “Price increases haven’t let up. I thought 2022 was going to be better, but it hasn’t been. Shortages (among other issues) are disrupting the supply chain.”
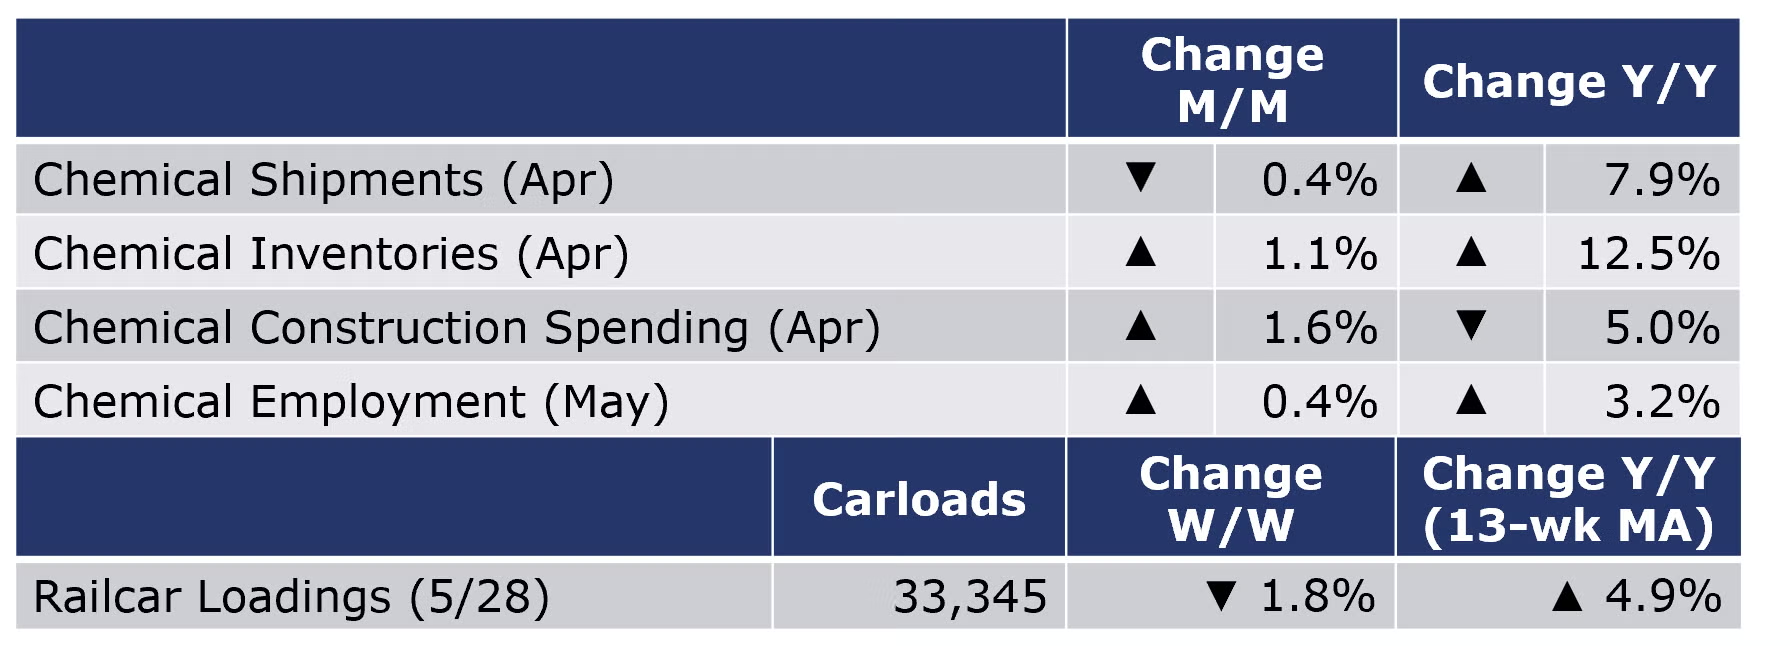
According to data released by the Association of American Railroads, chemical railcar loadings fell slightly (by 1.8% to 33,345 for the week ending 28 May. Loadings were up 4.9% Y/Y (13-week MA), up 6.1% YTD/YTD and have been on the rise for 7 of the last 13 weeks.
The Federal Reserve Beige Book noted that in Texas, “output growth was led by nondurable goods such as food and chemical manufacturing. Gulf Coast refinery utilization rates eased in April, while chemical production increased, buoyed by strong domestic and export demand.”
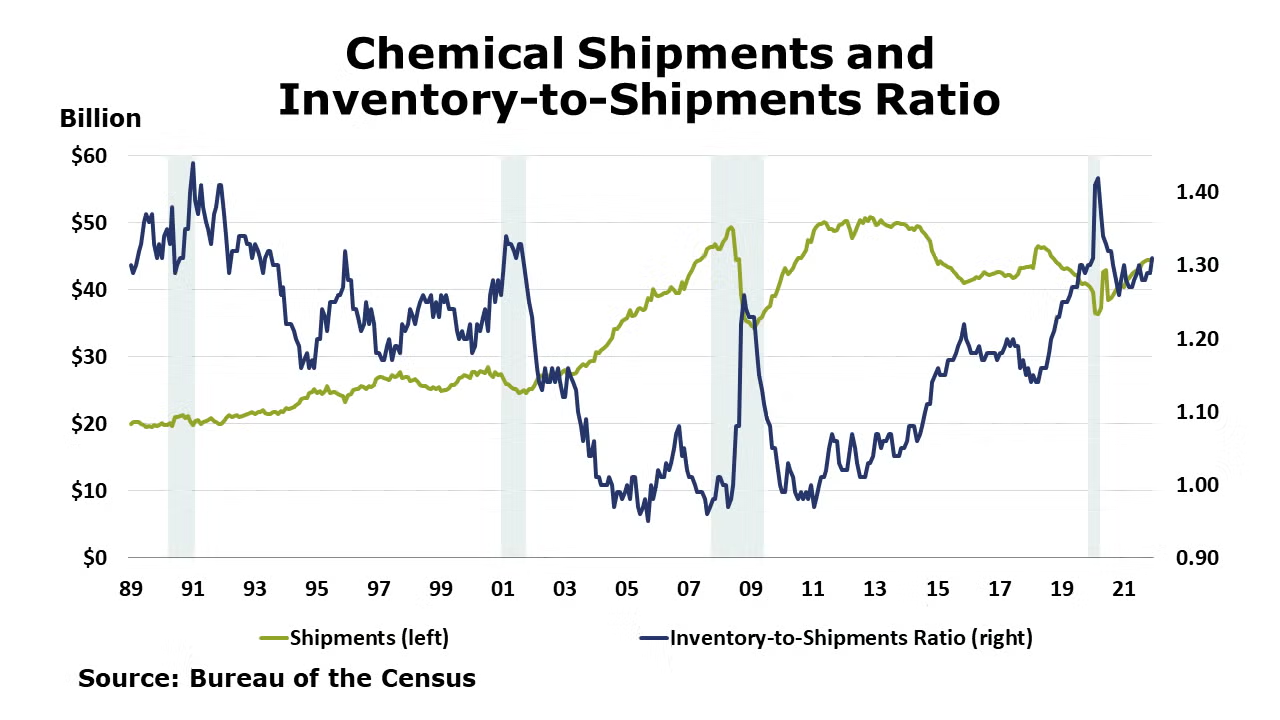
Chemical shipments eased by 0.4% in April, reversing a similar gain in March. Shipments were slightly lower across all three categories. Chemical inventories rose 1.1%, following a 0.9% gain in April, with gains across all segments. As a result, the inventories-to-sales ratio edged higher to 1.33 from 1.32 in March. A year ago the ratio was 1.28. Compared to a year ago, shipments were up by 7.9% Y/Y while inventories were 12.5% higher Y/Y.
Chemical industry employment (including pharmaceuticals) rose by 3,700 (0.4%) in May as gains in production workers offset a decline in supervisory and non-production workers. Compared to a year ago, chemical industry employment was up by 27,400 (3.2% Y/Y). Average hourly wages in chemical manufacturing rose 1.4% Y/Y to $27.12. The average workweek expanded by ½ hour to 41.2 hours. Combined with employment gains, the labor input into the chemical industry was up 2.2% which was consistent with the ISM Manufacturing PMI report that suggested the chemical industry experienced moderate-to-strong growth in May.
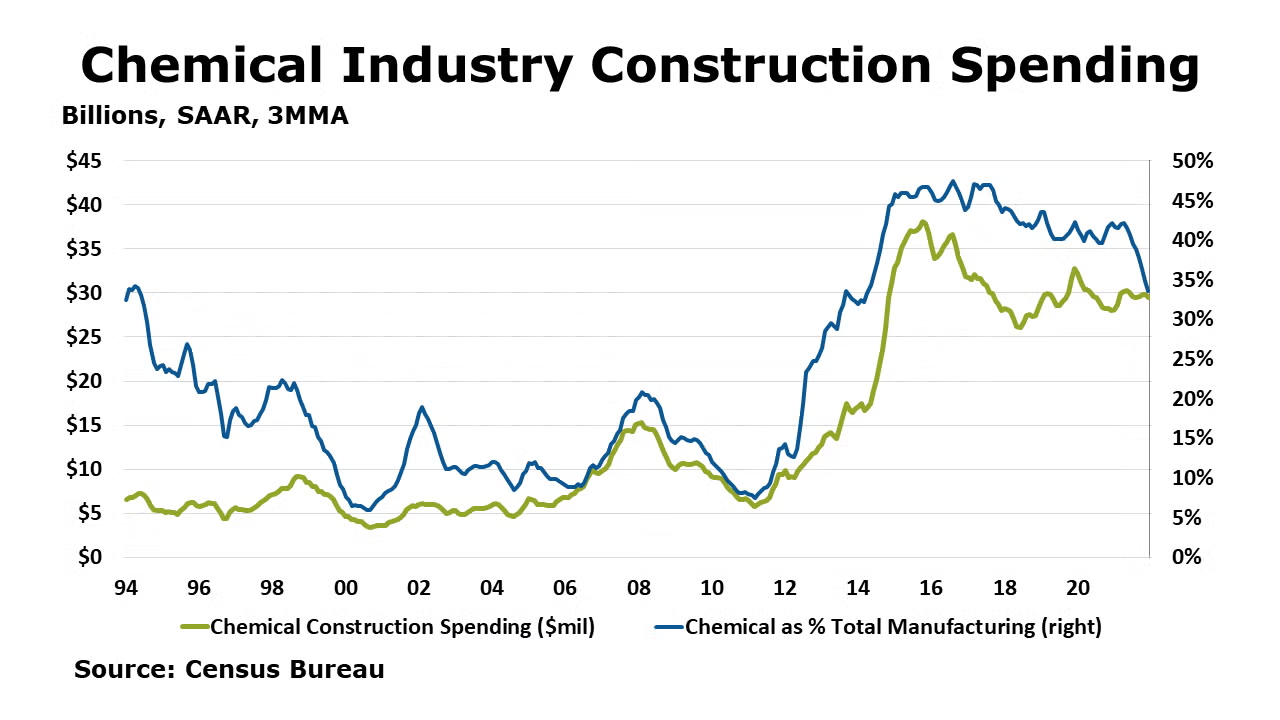
Chemical industry construction spending rose 1.6% in April to $28.9 billion. Chemical industry construction spending was 30% of total manufacturing construction spending in April. Compared to a year ago, spending was down 5.0% Y/Y.
Note On the Color Codes
The banner colors represent observations about the current conditions in the overall economy and the business chemistry. For the overall economy we keep a running tab of 20 indicators. The banner color for the macroeconomic section is determined as follows:
Green – 13 or more positives
Yellow – between 8 and 12 positives
Red – 7 or fewer positives
For the chemical industry there are fewer indicators available. As a result we rely upon judgment whether production in the industry (defined as chemicals excluding pharmaceuticals) has increased or decreased three consecutive months.
For More Information
ACC members can access additional data, economic analyses, presentations, outlooks, and weekly economic updates through MemberExchange.
In addition to this weekly report, ACC offers numerous other economic data that cover worldwide production, trade, shipments, inventories, price indices, energy, employment, investment, R&D, EH&S, financial performance measures, macroeconomic data, plus much more. To order, visit https://store.americanchemistry.com/.
Every effort has been made in the preparation of this weekly report to provide the best available information and analysis. However, neither the American Chemistry Council, nor any of its employees, agents or other assigns makes any warranty, expressed or implied, or assumes any liability or responsibility for any use, or the results of such use, of any information or data disclosed in this material.
Contact us at ACC_EconomicsDepartment@americanchemistry.com


