Running tab of macro indicators: 14 out of 20
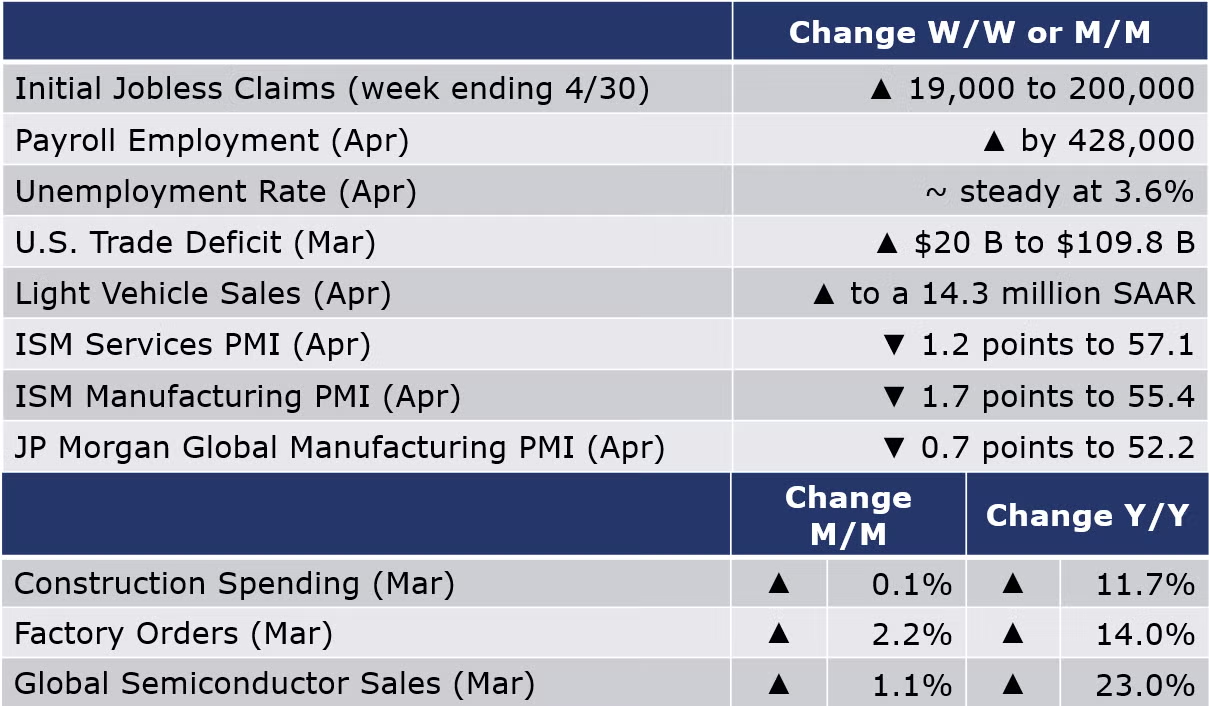
The number of new jobless claims rose by 19,000 to 200,000 during the week ending 30 April. Continued claims fell by 19,000 to 1.38 million, and the insured unemployment rate for the week ending 23 April was unchanged at 1.0%.
Nonfarm payrolls grew by 428,000 in April, largely in line with expectations. Job gains for February and March were revised downwards, however. There were gains across all major segments and manufacturing employment expanded by 55,000. Average hourly wages rose 5.5% Y/Y. A sign of the tight labor market, the civilian labor force fell by 363,000. The labor force participation rate fell by 0.2% to 62.2%, higher than a year ago, but still nearly a percentage point lower than its pre-pandemic high. The unemployment rate remained steady at 3.6%. Separately, the number of job openings reached a record high 11.5 million in March. The number of people quitting jobs also reached an all-time high of 4.5 million. When compared against March unemployment, there were nearly twice as many job openings as unemployed people.

Light vehicles rose from a 13.4 million seasonally adjusted annual pace to a 14.3 million pace in April. That pace was off 22% from a year ago as the vehicle sector has been plagued by persistent shortages of semiconductors and other critical materials.
The U.S. trade deficit in goods and services expanded by $20.0 billion to $109.8 billion in March. Growth in imports, at 10.3%, outpaced growth in exports (which rose 5.6%) in March. Exports of goods rose in March reflecting higher exports of industrial supplies and materials including crude oil, fuel oil, natural gas liquids and other petroleum products. Exports of passenger cars increased as well. Exports of services also rose, reflecting gains in transport, travel, financial and other business services. Goods imports rose with higher imports of industrial supplies and materials, consumer goods, capital goods, and autos and parts. Imports of services rose, as gains in transport and travel offset decline in charges for the use of intellectual property.
Construction spending was nearly stable in March, rising just 0.1% from February. Spending on private residential projects was up 1.0%, as a rise in single-family homes offset a decline in new multifamily home projects. Public construction spending was mixed across categories compared to the previous month. Spending towards educational and highway and street, the largest areas of public construction spending, were both down slightly in March. Compared to a year ago, the value of overall construction spending was up 11.7%.
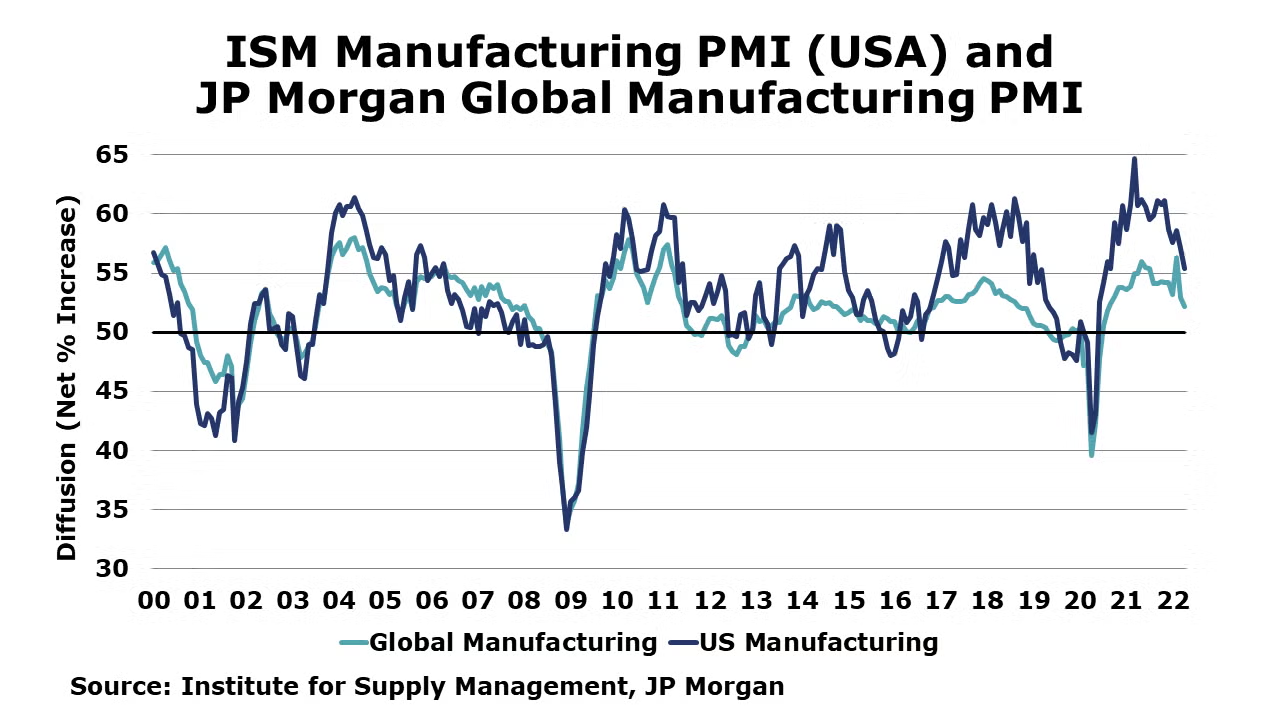
The ISM Manufacturing PMI declined by 1.7 points to 55.4, suggesting that manufacturing expanded at a slower pace in April. Seventeen of 18 industries reported growth, including chemical products. The only industry reporting a decrease in April compared to March is petroleum & coal products. New orders, production, inventories, and order backlogs rose at a slower pace. The closely watched supplier deliveries component which measures how much slack exists in the supply chain suggested that delivery times were increasingly delayed. Customers’ inventories were deemed to be “too low”. Prices continued to rise, but at a slower pace than in February. Globally, manufacturing continued to improve in April though it also expanded at a slower pace, according to the JP Morgan Global Manufacturing PMI which fell 0.7 points to 52.2. Output declined, the downturn reflecting a sharp downturn in China where tighter COVID restrictions have limited production. Input costs remain a considerable challenge and selling price inflation hit a record high. The report noted that numerous national manufacturing sectors outside of China continued to expand, demonstrating resilience in April. Output in U.S. manufacturing hit a 9-month high, the slowdown in production in Europe continued and Japan and Brazil saw modest expansions. With major supply chain constraints continuing, international trade flows deteriorated for the second month in a row.
The ISM Services PMI fell 1.2 points to 57.1 in April, signaling that the services sector expanded at a slower pace. Seventeen of 18 industries reported growth, with the only decline noted in information. Supplier deliveries edged up 1.7% compared to March. Prices continued to rise at a faster rate, with the index reaching an all-time high of 84.6% surpassing the previous record reached in December 2021. One respondent noted that business remains strong, only dampened by labor shortages, higher costs for materials, and longer lead times.
Boosted by inflation, factory orders surged in March, up by a better-than-expected 2.2%. This followed a revised gain of 0.1% in February. Core business equipment orders were up 1.3% following a 0.2% decline the previous month. There were large jumps in orders for consumer goods, motor vehicles and parts, and information technology goods. Compared to a year ago, orders were up 14.0% Y/Y. Manufacturing shipments rose 2.3% with the largest gains in consumer durable goods. Inventories also rose, up by 1.3%, the largest monthly gain (in nominal terms) since 2011. Compared to a year ago, inventories were up 10.7% Y/Y while shipments were up by 14.7% Y/Y. The inventories-to-shipments ratio edged lower from 1.45 in February to 1.43 in March. In March 2021, the ratio was 1.48.
Global semiconductor sales rose 1.1% in March with gains in Asia Pacific, China, Japan and Europe but fell slightly in the Americas. Compared to year ago, global semiconductor sales were up 23.0% Y/Y (>20% for the 11th consecutive month) with the largest gains in the Americas and Europe.
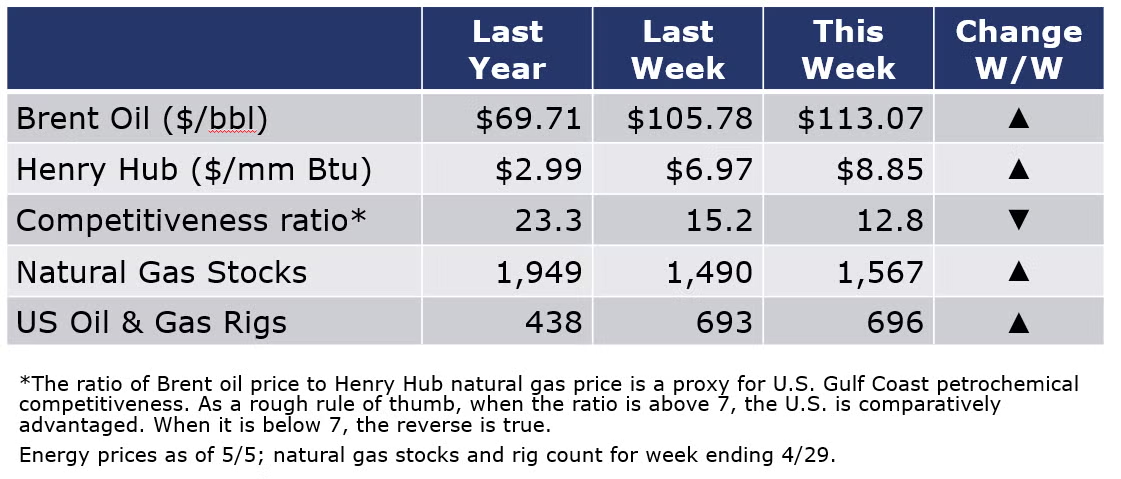
Despite concerns about Chinese oil demand as Covid restrictions were extended in Beijing, oil prices rose this week as the EU moved forward on a phaseout of Russian oil among member nations. Natural gas prices also rose this week with the realization that the U.S. storage rebuild may be lean due to high demand for LNG, a hot summer forecast, and smaller-than-expected production gains. The rig count continued to expand, up by three to 696 for the week ending April 29th.
For the business of chemistry, the indicators still bring to mind a green banner for basic and specialty chemicals.
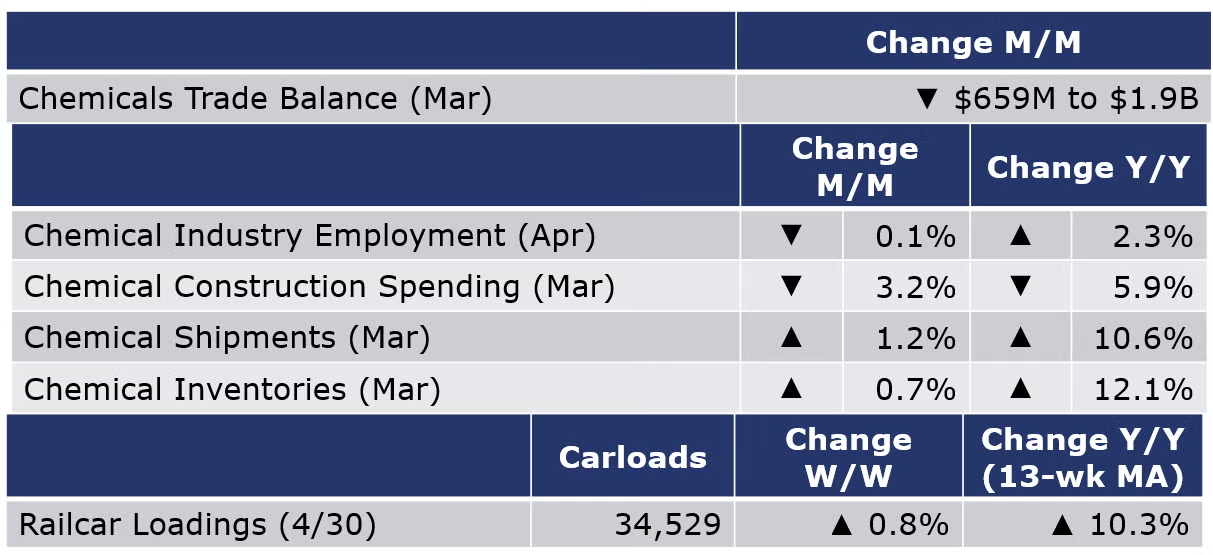
According to data released by the Association of American Railroads, chemical railcar loadings were down slightly (0.8%) for the week ending 30 April. Loadings were up 10.3% Y/Y (13-week MA), up 8.0% YTD/YTD and have been on the rise for 8 of the last 13 weeks.
Within the details of the ISM Manufacturing PMI report, chemical products was listed as one of the industries reporting moderate-to-strong growth in April. Chemical industry respondents reported growth in new orders, higher inventories, increased employment growth, new export orders, and imports and paying higher prices for raw materials in April. They reported lower order backlogs, that customer inventories were “too low” and slower supplier deliveries reflecting continued obstacles across the supply chain, with labor and through the transportation and distribution network. One chemical product respondent provided a comment: “Tier-2 supplier shutdowns in Shanghai are causing a ripple effect for our suppliers in other parts of China. Long delays at ports, including in the U.S., are still providing supply challenges. Inflation is out of control. Fuel costs, and therefore freight costs, are leading the upward cycle. At some point, the economy must give way; it will be tough to have real growth with such pressure on costs. Despite the issues and poor outlook, business remains brisk.”
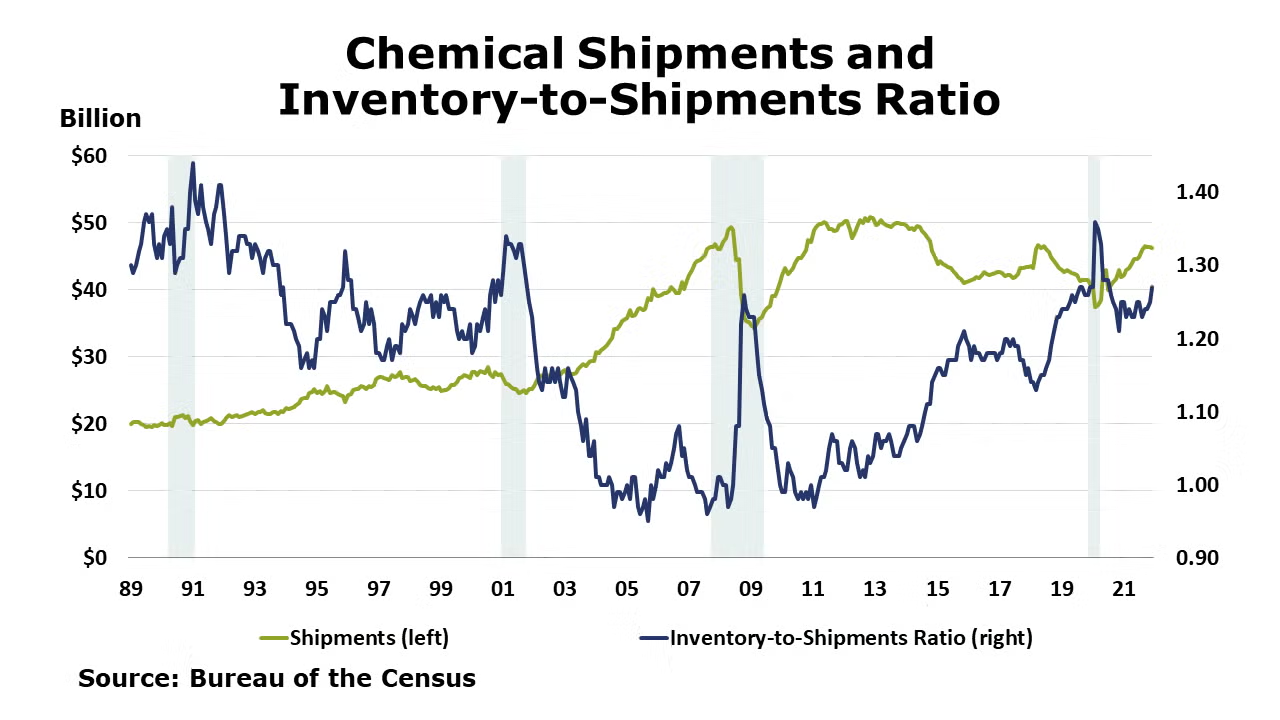
Following a 0.4% decline in February and flat growth in January, chemical shipments rebounded in March, up 1.2%. Gains in shipments of coatings, adhesives and other chemicals offset a small decline in agricultural chemical shipments. Chemical inventories continued to expand, up 0.7% with gains across all major categories. Compared to a year ago, shipments were up 10.6% Y/Y while inventories were up by 12.1% Y/Y. The inventories-to-shipments ratio ticked down to 1.26 in March. A year ago, the ratio was 1.25.
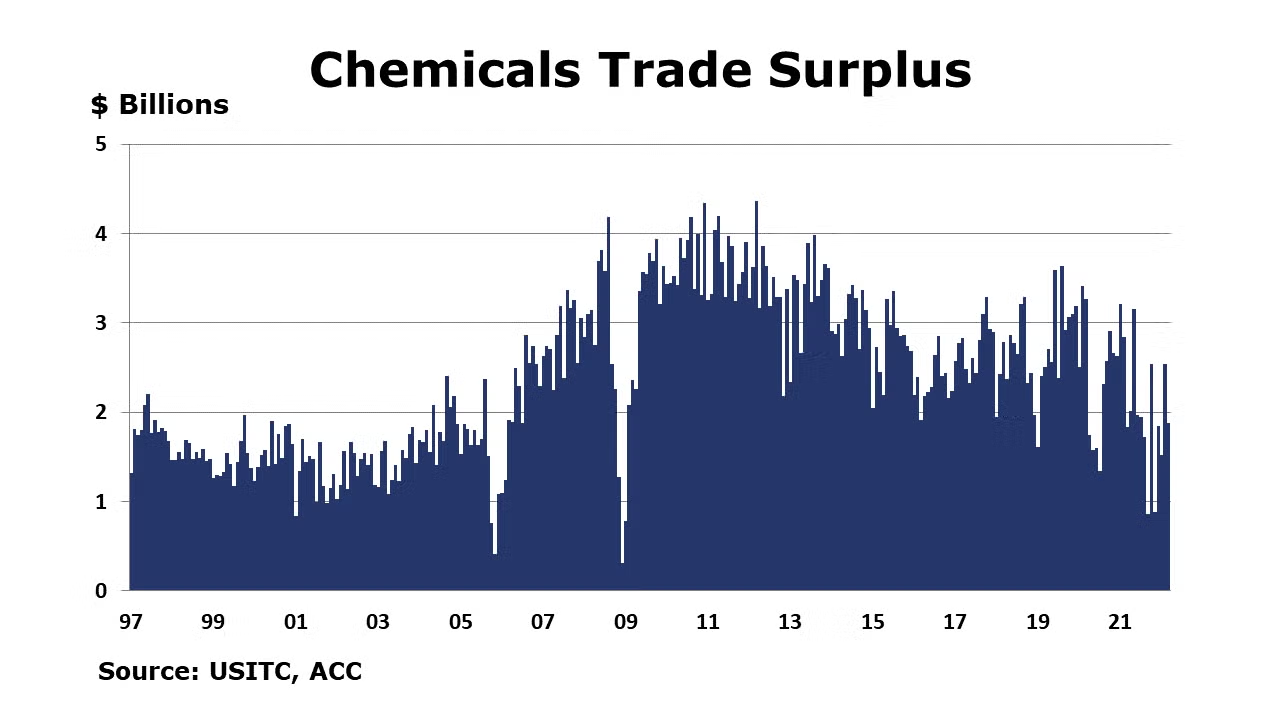
Net exports of chemicals declined $659 million to $1.9 billion in March as imports outpaced exports in the month. Total chemicals trade increased substantially in March, rising 24% to $30 billion. Chemical exports were up 19% to $15.9 billion with gains in every category. Exports were up 26% Y/Y. Imports rose 29% in month, also due to gains in all categories. At $14.1 billion in March, chemical imports were up 30% Y/Y.
Chemical employment (including pharmaceuticals) was lower by 1,000 (0.1%) in April. Production workers rose by 3,400, while the number of supervisory and non-production workers was lower by 2,400. Compared to a year ago, chemical employment was up by 20,000 (2.3%). Average wages for production workers eased slightly to $26.81. The average workweek declined by 18 minutes to 40.6 hours. The total labor input eased slightly during the month, which was inconsistent with the ISM report that suggested the chemical industry expanded in April, however labor shortages could account for some of the discrepancy.
Chemical industry construction spending fell by 3.2% in March to $28.6 billion. Compared to a year ago, spending was down 5.9%.
The benchmark S&P 500 index tumbled by 8.8% in April. Chemical equity prices, as measured by the S&P index for chemical companies also ended lower, off 2.1% for the month. Equity prices are often a good indicator of future activity and represent one component of the leading economic indicators. Compared to the beginning of the year, chemical equities were off 9.5% while the S&P 500 index was off by 8.8% year-to-date.
Note On the Color Codes
The banner colors represent observations about the current conditions in the overall economy and the business chemistry. For the overall economy we keep a running tab of 20 indicators. The banner color for the macroeconomic section is determined as follows:
Green – 13 or more positives
Yellow – between 8 and 12 positives
Red – 7 or fewer positives
For the chemical industry there are fewer indicators available. As a result we rely upon judgment whether production in the industry (defined as chemicals excluding pharmaceuticals) has increased or decreased three consecutive months.
For More Information
ACC members can access additional data, economic analyses, presentations, outlooks, and weekly economic updates through MemberExchange.
In addition to this weekly report, ACC offers numerous other economic data that cover worldwide production, trade, shipments, inventories, price indices, energy, employment, investment, R&D, EH&S, financial performance measures, macroeconomic data, plus much more. To order, visit https://store.americanchemistry.com/.
Every effort has been made in the preparation of this weekly report to provide the best available information and analysis. However, neither the American Chemistry Council, nor any of its employees, agents or other assigns makes any warranty, expressed or implied, or assumes any liability or responsibility for any use, or the results of such use, of any information or data disclosed in this material.
Contact us at ACC_EconomicsDepartment@americanchemistry.com


