Running tab of macro indicators: 10 out of 20
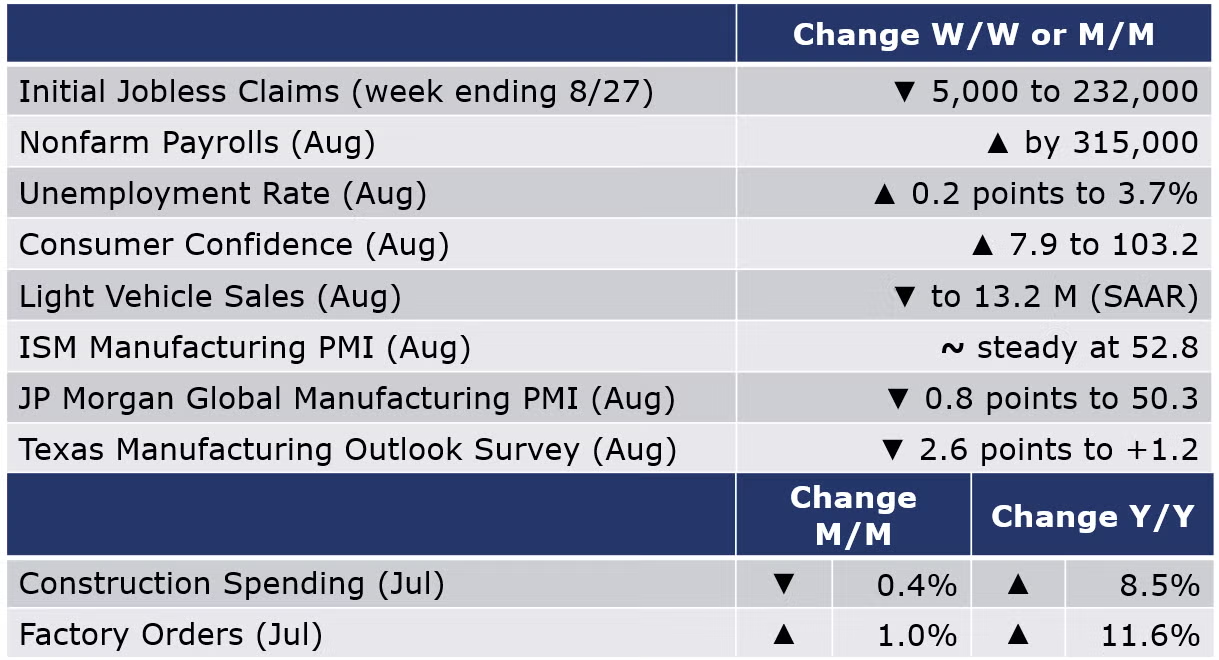
The number of new jobless claims fell by 5,000 during the week ending 27 August to 232,000. Continued claims increased by 26,000 to 1.44 million, and the insured unemployment rate for the week ending 20 August was unchanged at 1.0%.
Growth in nonfarm payroll employment slowed, with a gain of 315,000 in August (compared to 526,000 in July). Gains were broad-based with every major sector adding to payrolls. Manufacturing employment rose by 22,000, a smaller gain than the previous two months. Average hourly pay rose 5.2% Y/Y for all employees (6.1% Y/Y for production/non-supervisory workers), both slower gains than earlier in the year. The unemployment rate moved higher for the first time since January, up 0.2 percentage points to 3.7%. This reflected, in part, an increase in labor force participation which grew faster than employment. The labor force participation rate rose from 62.1% in July to 62.4% in August but remains below pre-pandemic levels (63.5% in February 2020).
The job openings data for July came in well above expectations showing a gain to 11.2 million. This was on top of upwardly-revised data for June. Comparing the demand for labor (job openings + employed people) in the U.S. economy to the available labor force, there remained 5.6 million jobs for which there were not enough workers. Said another way, there were nearly two job openings for every unemployed person in the labor force. The data suggests that the labor market remains quite tight, giving the Fed more latitude at its rate-setting meeting in a few weeks.
The Conference Board Consumer Confidence Index® rose—up 7.9 points to 103.2—in August following three months of decline. Consumers’ assessment of current business conditions improved but their assessment of the labor market was mixed with slightly less saying “jobs” were plentiful in August. The expectations component, which is based on consumers’ short-term outlook, improved though it remains at a low level indicating recession risk. Purchasing plans and vacation intentions increased. Concerns around inflation are moderating but still high.
Construction spending continued its downward streak with a 0.4% decrease in July. The trend reflects a 4.0% drop in single-family construction spending (which was impacted by higher mortgage rates and high home prices) and, to a lesser extent, a 0.6% decrease in multi-family spending due to persistent supply chain issues, which resulted in delay or cancelation of some multi-family projects. On a positive note, spending in highway and street increased by 4.4%, which was boosted funding from the “Build Back Better” bill. Spending in manufacturing construction also increased (up 0.6%) thanks to continued onshoring effort of U.S. manufacturers. Compared to a year ago, overall construction spending was up 8.5%.
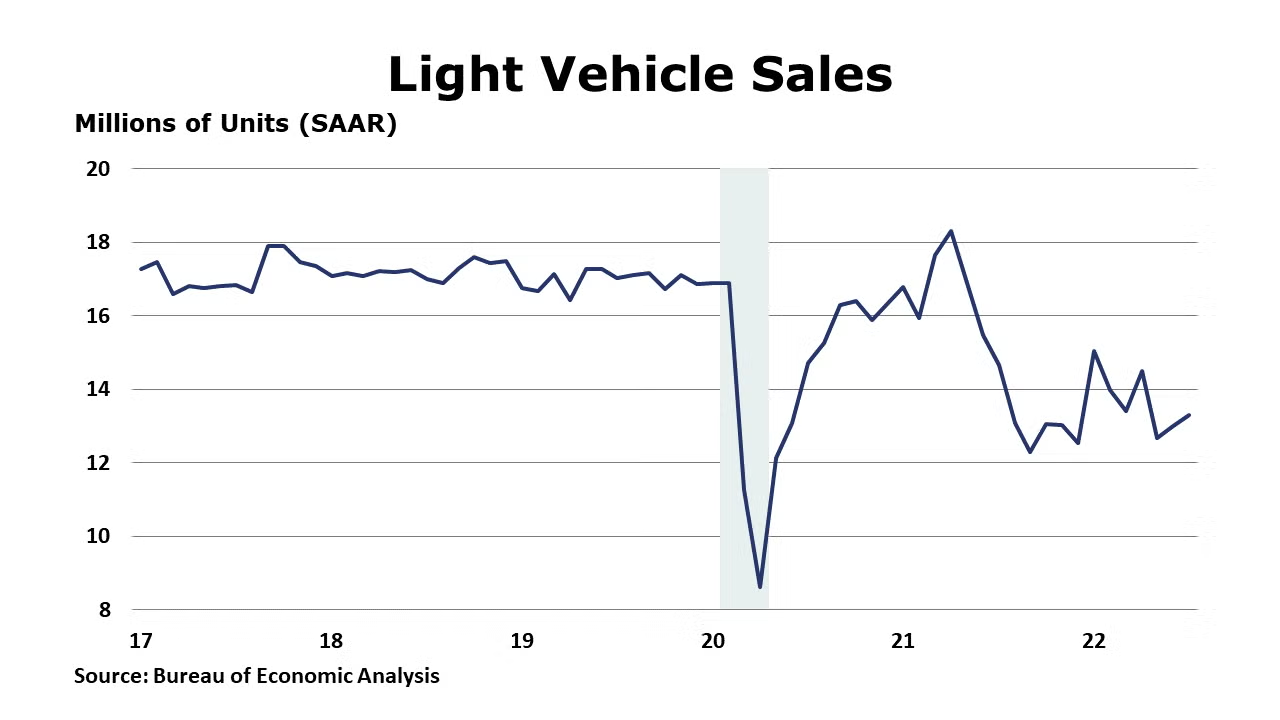
Light vehicle sales edged lower, falling from a 13.3 million seasonally adjusted annual pace to 13.2 million in August. There were declines in sales of both cars and light trucks. Vehicle sales were only slightly ahead of year-ago levels.
ISM’s Manufacturing PMI® held steady at 52.8 in August, the 27th month in a row for U.S. industrial sector expansion. Only ten of 18 industries reported growth, however. Demand increased with new orders returning to expansion. Production grew at a slower pace. Supply challenges continue for manufacturers but there are some signs that problems could be easing. The supplier deliveries component slowed. Inventories expanded but at a slower rate.
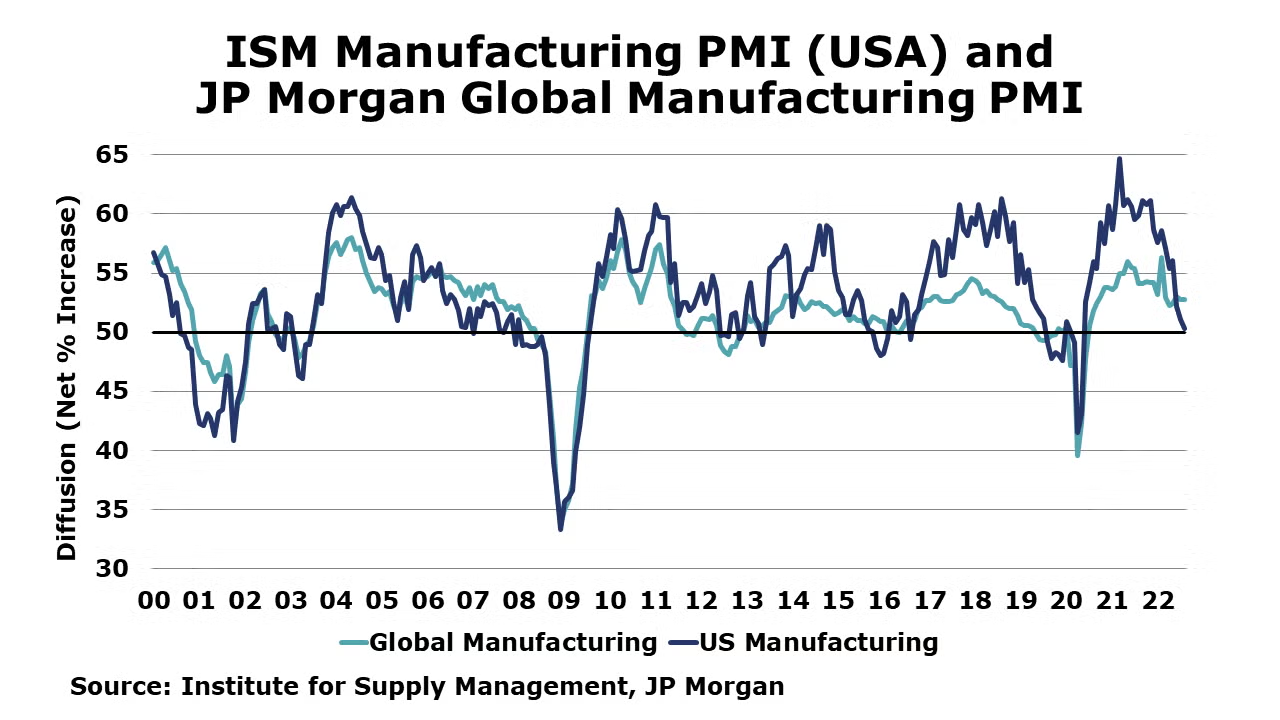
The JP Morgan Global Manufacturing PMI fell in August to its lowest since June 2020 as the headline index eased by 0.8 points to 50.3. Output rose in only 10 of 30 economies tracked and the gains were reported as “only marginal.” New orders continued to fall and inventories grew. Price inflation and supply chain pressures eased. Falling export orders point to declining global goods trade flows. Together, the signs from this release point to weakening demand and lower production.
Factory orders fell 1.0% in July, well below expectations for a small gain. In addition to a modest decline in durable orders (downwardly revised from last week’s reading of flat growth), nondurable orders were 1.9% lower. While Census does not provide details for nondurable orders, part of the decline could include lower prices for petroleum products. Reflecting concerns about consumer spending, much of the decline in new orders was in consumer goods (both durable and nondurable). Both core business orders and orders for construction materials were up 0.3%. Headline orders remained up compared to a year ago (up 11.6% Y/Y). Manufacturing shipments were down 0.9% and inventories edged higher by 0.1%, with expansion across capital goods categories nearly offsetting lower inventories of nondurable consumer goods and motor vehicles and parts. Shipments were up 10.8% Y/Y while inventories were up 10.0% Y/Y. The inventories-to-sales ratio ticked higher to 1.47 and was lower than a year ago when the ratio was 1.50.
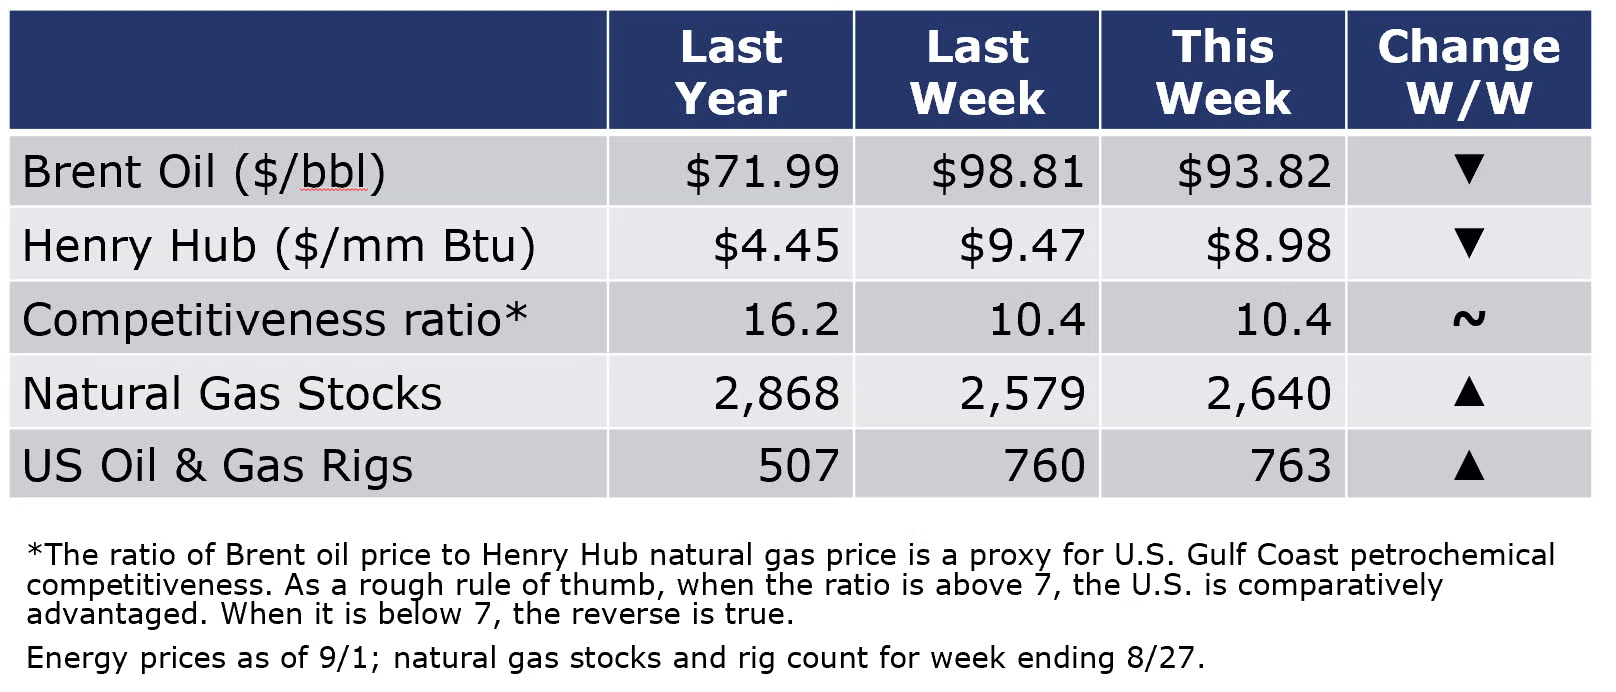
Energy prices ended lower on Thursday compared to a week ago. Comments by Fed Chair Powell at Jackson Hole reiterated the Fed’s objective to reduce inflation, even if such actions risk a recession. Oil inventories fell again while natural gas inventories continued to build. Inventories of both oil and natural gas are lower than their historic averages. The combined oil and rig count rose by three to 763 during the week ending 8/27.
For the business of chemistry, the indicators still bring to mind a yellow banner for basic and specialty chemicals
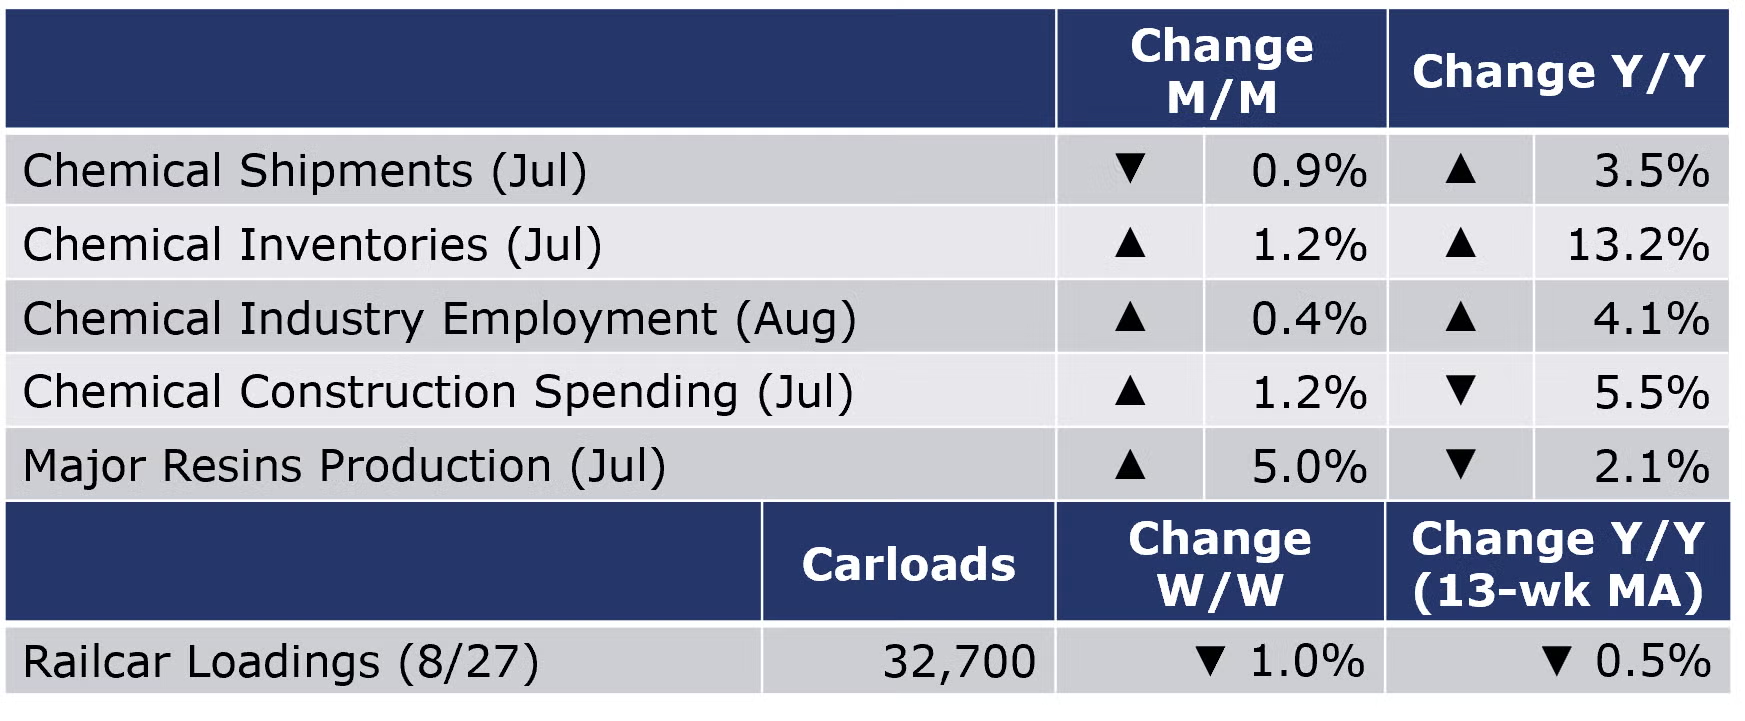
According to data released by the Association of American Railroads, chemical railcar loadings were down 1.0% to 32,700 during the week ending 27 August. Loadings were down 0.5% Y/Y (13-week MA), the 7th consecutive week of declining Y/Y comparisons. Loadings were up 3.6% YTD/YTD and have been on the rise for 7 of the last 13 weeks.
Within the details of the ISM report, the chemical industry was reported to have contracted in August. There were contractions in new orders, production, employment, and new export orders. The chemical industry was one of 11 industries that reported that customer inventories were “too low”, however. One chemical industry respondent noted: “Sales in target business softening month-over-month, down 12 percent by revenue. Inventory days are increasing.” This is consistent with July’s report showing inventories growing relative to shipments.
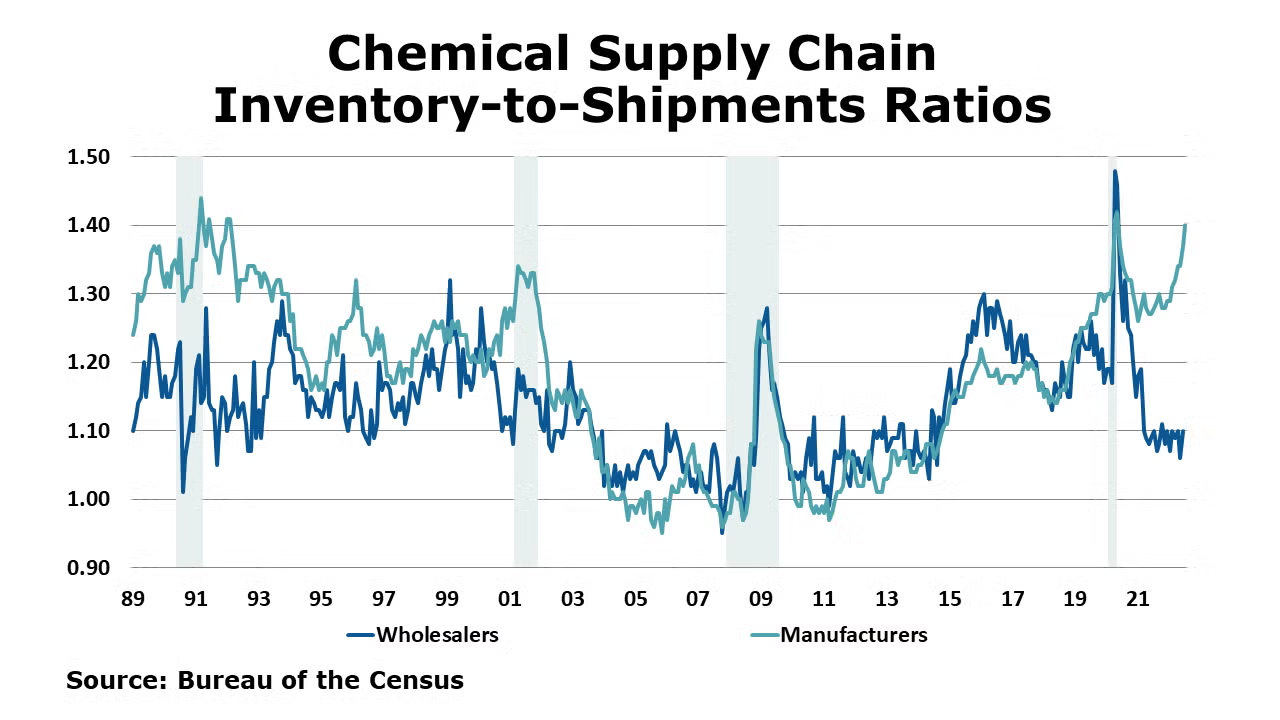
Chemical shipments fell for a second straight month in July, down 0.9%. Declines in coatings, adhesives, and other chemicals offset a gain in agricultural chemical shipments. Inventories of chemicals, however, continued to climb (up 1.2%), with gains across all categories. The inventories-to-shipments ratio moved higher to 1.40, up from 1.29 a year ago and the highest since May 2020. This suggests a growing imbalance in inventories. Chemical shipments were up 3.5% Y/Y while inventories were up by 13.5% Y/Y.
Despite being off by 5.5% compared to the same month last year, July chemical industry construction spending inched up by 1.2% relative to the month prior. While the sector has seen gradual decline since 2015, spending remains elevated relative to historical standard.
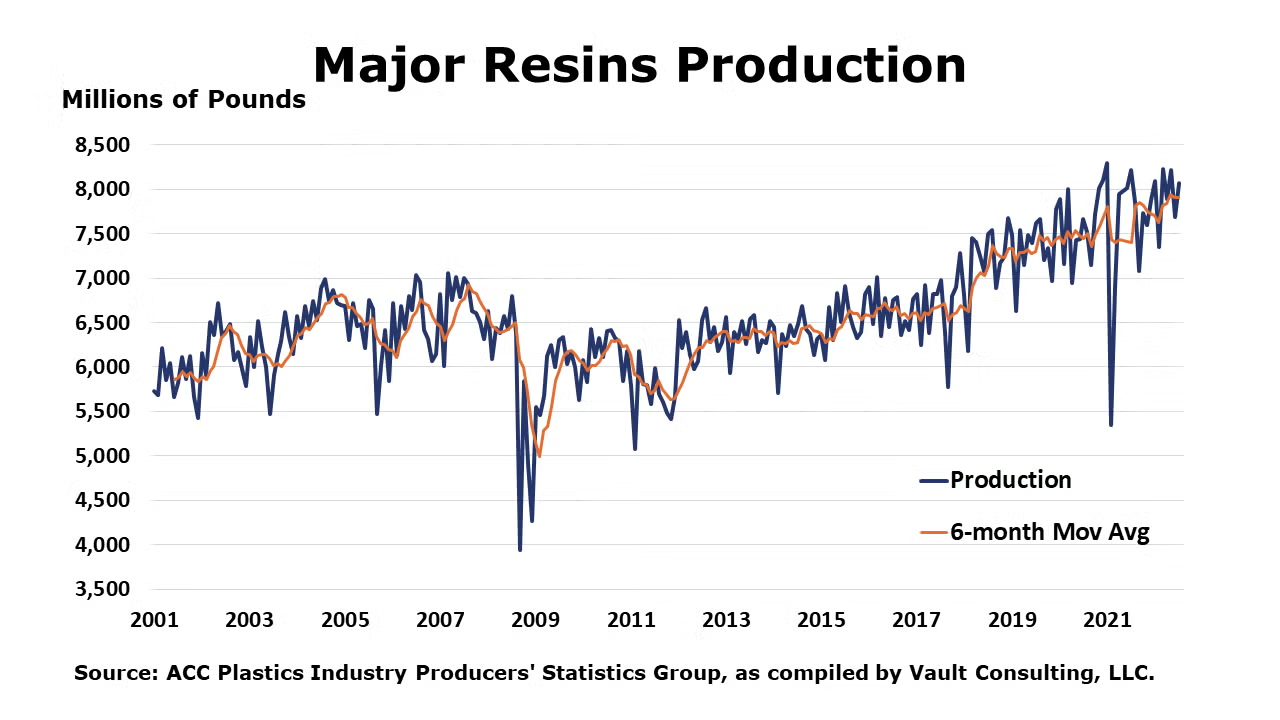
According to statistics from the ACC, U.S. production of major plastic resins totaled 8.1 billion pounds during July 2022, up 5.0% percent compared to the prior month, and down 1.9% Y/Y. Year-to-date production was 55.6 billion pounds, a 5.3% increase Y/Y. Sales and captive (internal) use of major plastic resins totaled 7.4 billion pounds, down 2.3% compared to the prior month, and decrease of 3.3% Y/Y. Year-to-date sales and captive use were 54.5 billion pounds, a 5.1% increase Y/Y.
Chemical industry employment (including pharmaceuticals) continued to expand for a 15th consecutive month, up by 3,500 (0.4%) in August. A gain in supervisory/non-production workers more than offset a slight decline in production workers. Employment was up by 35,800 (4.1%) from a year ago. Wages for production workers rose 2.3% Y/Y to $27.41. The average workweek remained declined slightly to 40.6 hours. The total labor input into chemical manufacturing eased 0.3% in August, consistent with the ISM report which suggested a contraction in chemical manufacturing.
Note On the Color Codes
The banner colors represent observations about the current conditions in the overall economy and the business chemistry. For the overall economy we keep a running tab of 20 indicators. The banner color for the macroeconomic section is determined as follows:
Green – 13 or more positives
Yellow – between 8 and 12 positives
Red – 7 or fewer positives
For the chemical industry there are fewer indicators available. As a result we rely upon judgment whether production in the industry (defined as chemicals excluding pharmaceuticals) has increased or decreased three consecutive months.
For More Information
ACC members can access additional data, economic analyses, presentations, outlooks, and weekly economic updates through MemberExchange.
In addition to this weekly report, ACC offers numerous other economic data that cover worldwide production, trade, shipments, inventories, price indices, energy, employment, investment, R&D, EH&S, financial performance measures, macroeconomic data, plus much more. To order, visit https://store.americanchemistry.com/.
Every effort has been made in the preparation of this weekly report to provide the best available information and analysis. However, neither the American Chemistry Council, nor any of its employees, agents or other assigns makes any warranty, expressed or implied, or assumes any liability or responsibility for any use, or the results of such use, of any information or data disclosed in this material.
Contact us at ACC_EconomicsDepartment@americanchemistry.com