Running tab of macro indicators: 9 out of 20
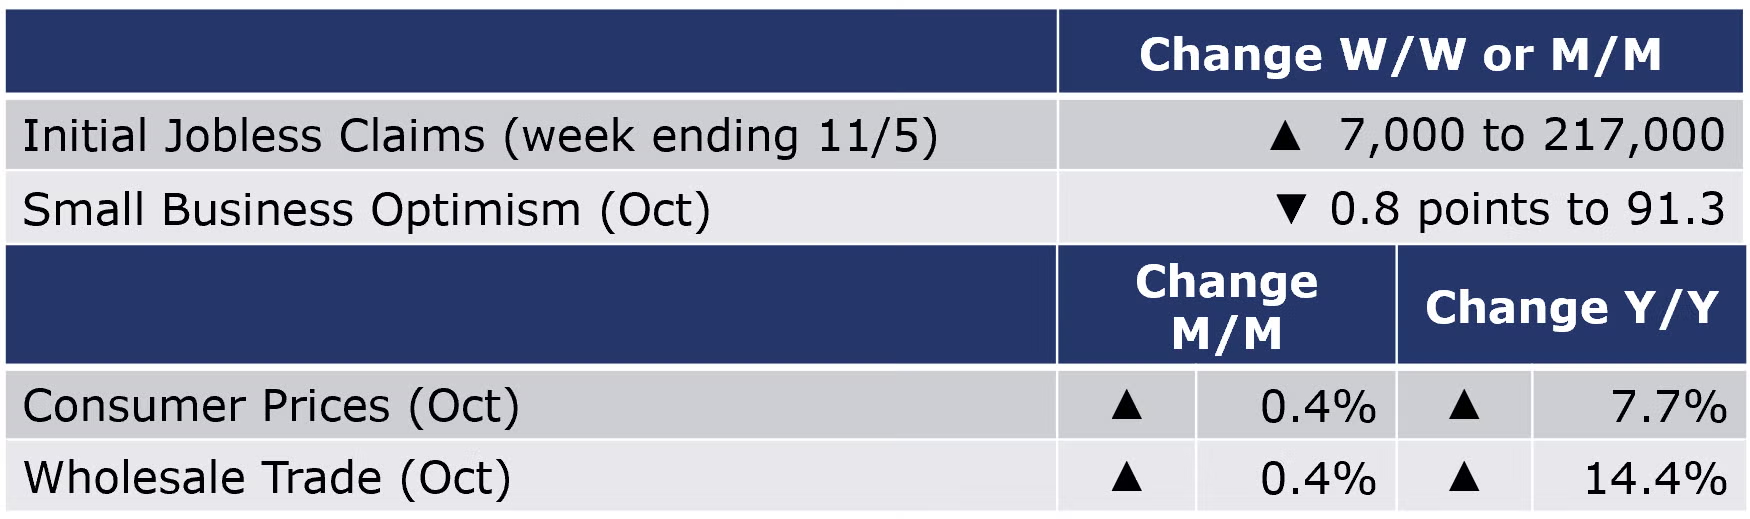
The number of new jobless claims was up by 7,000 to 217,000 during the week ending November 5th. Continued claims were up 6,000 to 1.49 million for the week of October 29nd and the insured unemployment rate was 1.0%, unchanged from the previous week's rate.
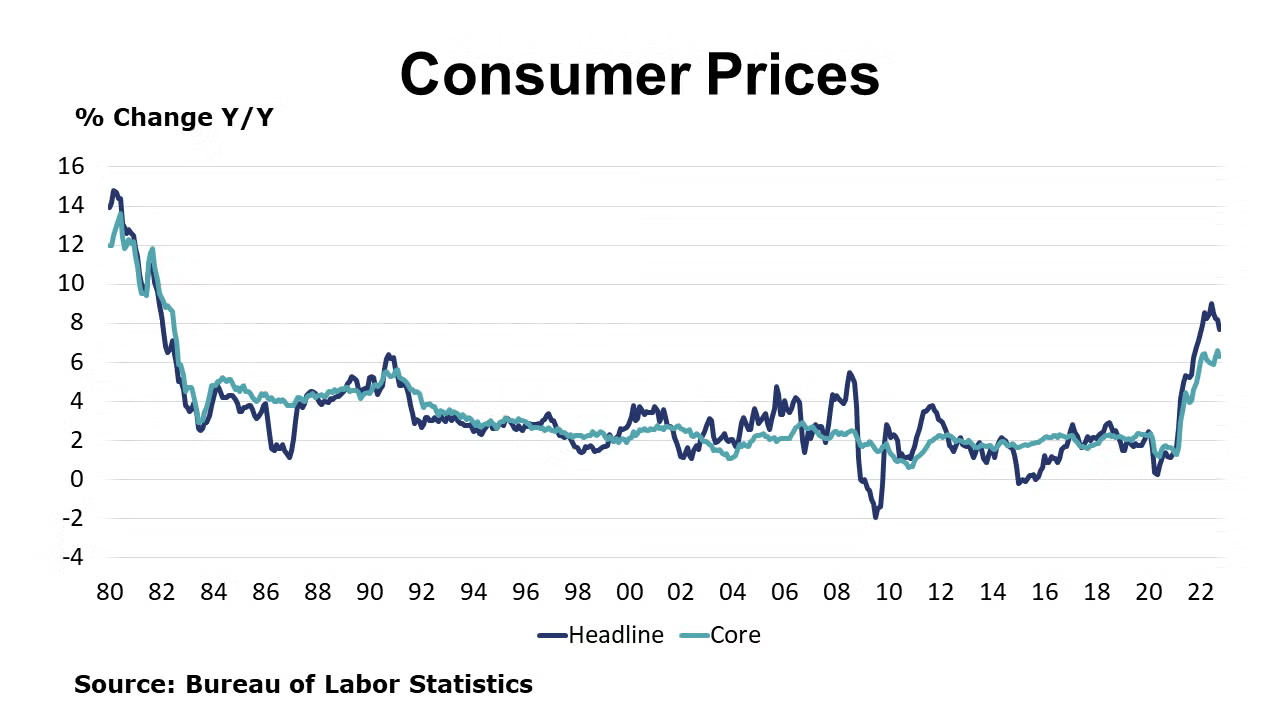
U.S. consumer prices rose 0.4% in October and have risen an unadjusted 7.7% over the past 12 months (the smallest 12-month increase since January 2022). The core CPI which excludes volatile food and energy prices also rose in October - by 0.3% - and have grown by 6.3% over the past 12 months. The price of gasoline fell over the July-to-August period but it has still risen 17.5% overall since October 2021. Prices for shelter, food, electricity, new cars, rent, and transportation all increased in October. Prices for natural gas, medical care, apparel, and airline fares declined 4.6% in October.
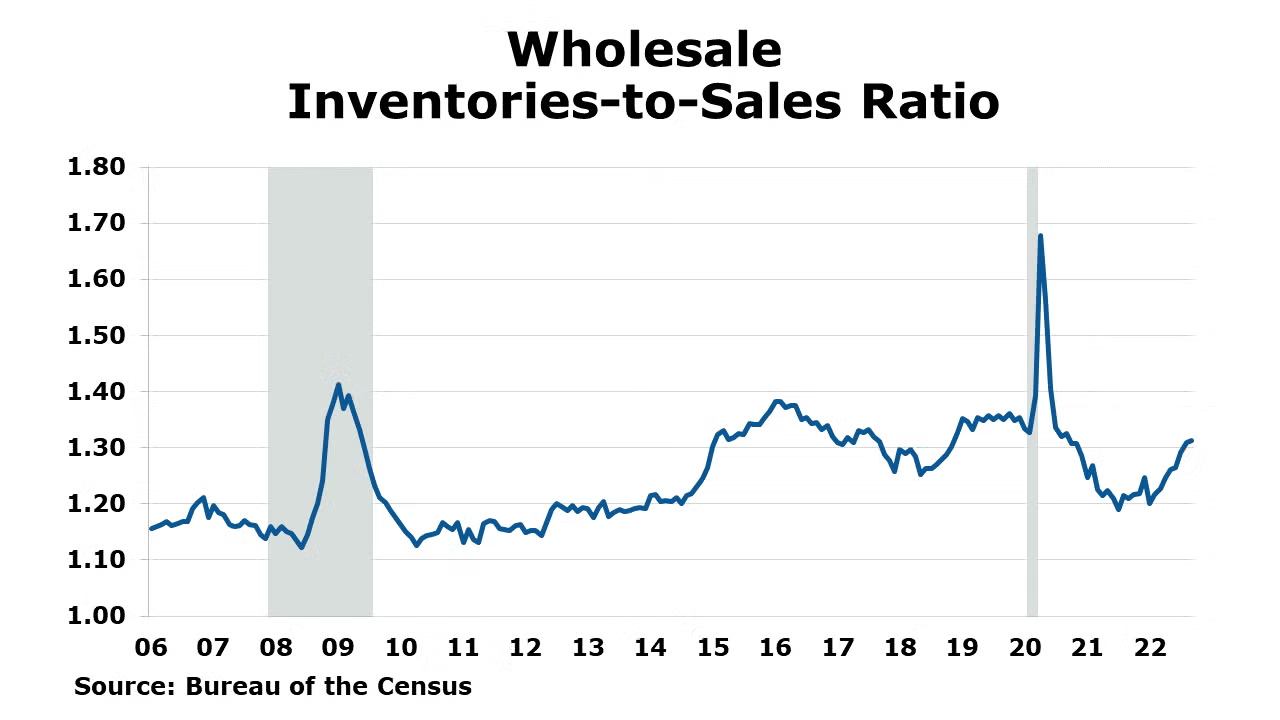
(Note that Census adjusts wholesale trade data for seasonal variation but not price changes)
The Census released wholesale trade data this week. Note the data is not adjusted for general price changes. Wholesale sales were higher by 0.4% in September (and up 14.4% Y/Y). September sales gains were driven by the automotive and electrical sectors. Over September, inventories continued to build up and were 0.6% higher than the month before and 24.1% higher Y/Y. The largest builds were in the auto, machinery, apparel, and groceries segments. The inventories-to-sales ratio remained at 1.31 in September. This was up from 1.21 a year ago and a sign that inventories are accumulating at this node of the supply chain.
The Small Business Optimism Index (produced by the National Federation of Independent Business) continued to move lower in October, down 0.8 points to 91.3. It was the 10th consecutive month below its long-term average. One third of small business owners reported that inflation was their single most important problem in operating their business. Business owners’ assessment of future conditions continued to deteriorate and remain negative.
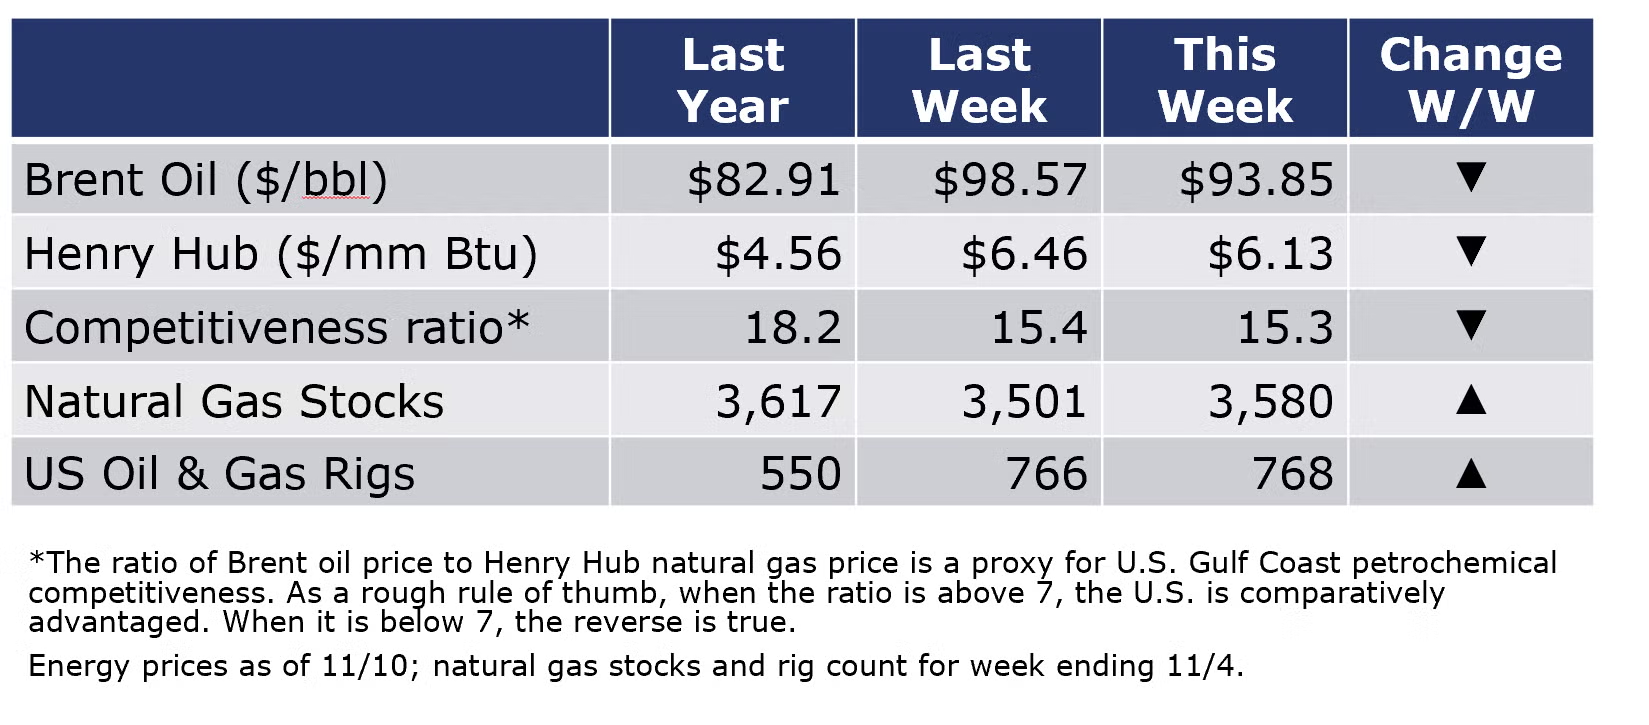
Oil prices were lower this week on an inventory build in U.S. commercial stocks and renewed COVID concerns in China. Natural gas prices were also lower on a mild near-term weather forecast, and higher-than-expected storage injections. With last week’s inventory build, U.S. gas inventories are now only 2.1% below average. The combined oil and rig count rose by two to 768 during the week ending 11/4.
For the business of chemistry, the indicators still bring to mind a yellow banner for basic and specialty chemicals.
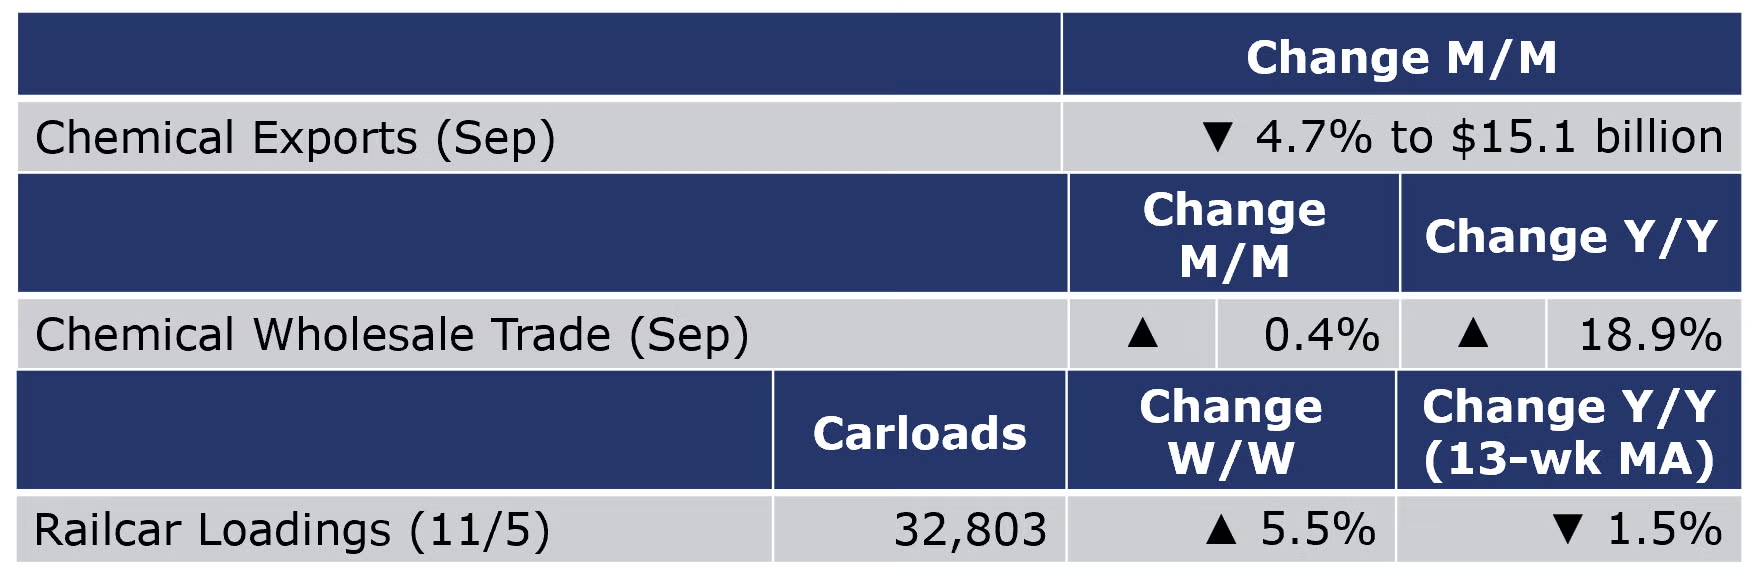
According to data released by the Association of American Railroads, chemical railcar loadings were up 5.5% to 32,803 during the week ending 5 November. Loadings were down 1.5% Y/Y (13-week MA), up 2.3% YTD/YTD and have been on the rise for 7 of the last 13 weeks.
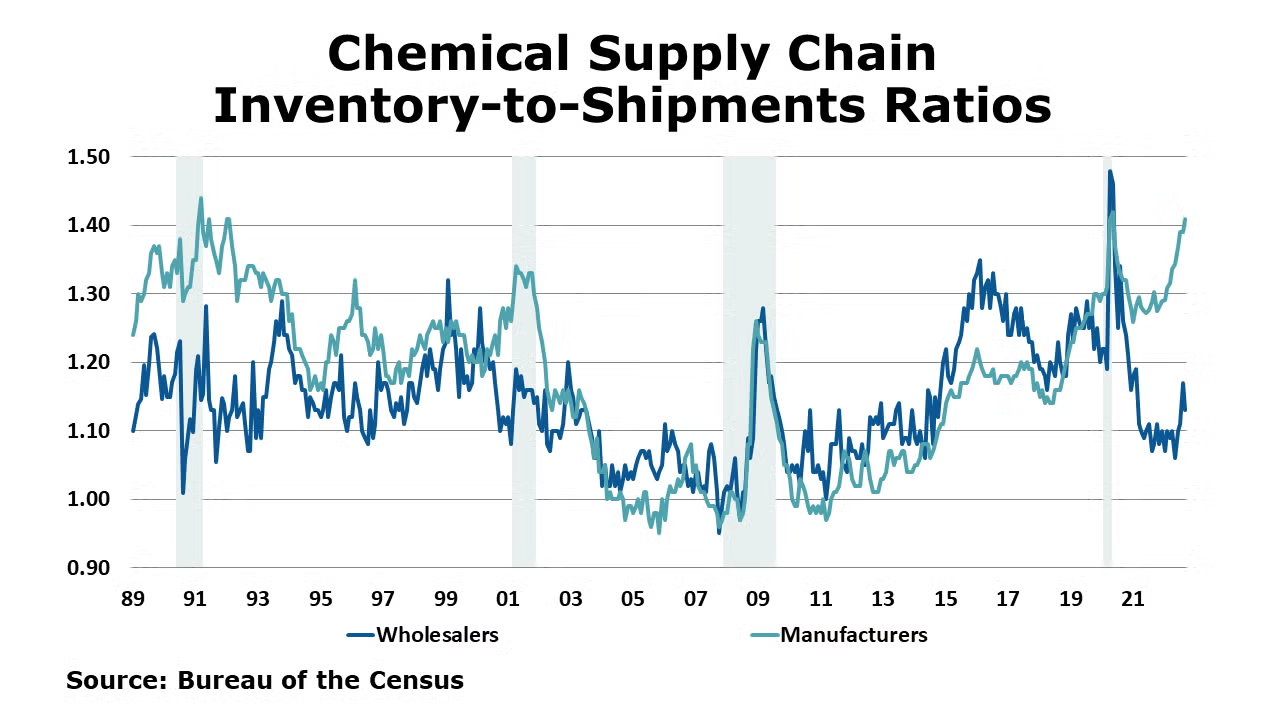
Sales of chemicals at the wholesale level increased 0.4% in September and were up 18.9% Y/Y. Inventories were drawn down to a level 2.6% lower at the end of the month. Compared to the same time last year, they were still 24.9% higher. As a result, the inventories-to-shipments ratio for chemicals at the wholesale level declined to 1.13 from 1.7 the month before.
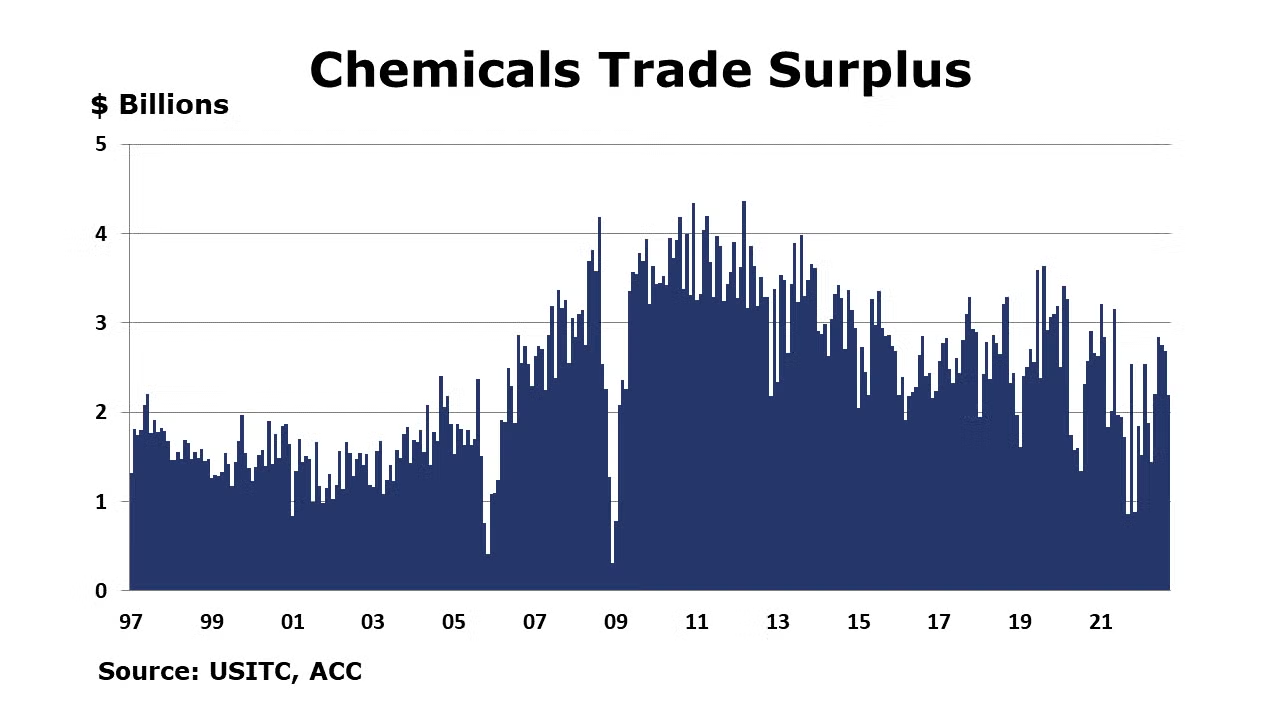
U.S. chemicals exports fell by 4.7% in September to $15.1 billion – a level up 19% Y/Y. Chemical exports were up to $137 billion YTD, a level up 21% YTD/YTD. Petrochemical exports (which were up 21% YTD/YTD) are about 58% of total chemicals exports. In September, exports fell in most sectors. By exception, exports of consumer products, agricultural chemicals, synthetic rubber, and synthetic fiber rose. Chemical imports fell by 2.0% in September to $12.9 billion – a level up 9% Y/Y. Imports were up to $117 billion YTD, a level up 25% YTD/YTD. Monthly-over-month, imports were down in inorganics, petrochemicals, resins, synthetic fibers, other basic chemicals and coatings. Year-to-date through September, the chemicals trade surplus was $20 billion, up 3% YTD/YTD.
Note On the Color Codes
The banner colors represent observations about the current conditions in the overall economy and the business chemistry. For the overall economy we keep a running tab of 20 indicators. The banner color for the macroeconomic section is determined as follows:
Green – 13 or more positives
Yellow – between 8 and 12 positives
Red – 7 or fewer positives
For the chemical industry there are fewer indicators available. As a result we rely upon judgment whether production in the industry (defined as chemicals excluding pharmaceuticals) has increased or decreased three consecutive months.
For More Information
ACC members can access additional data, economic analyses, presentations, outlooks, and weekly economic updates through MemberExchange.
In addition to this weekly report, ACC offers numerous other economic data that cover worldwide production, trade, shipments, inventories, price indices, energy, employment, investment, R&D, EH&S, financial performance measures, macroeconomic data, plus much more. To order, visit http://store.americanchemistry.com/.
Every effort has been made in the preparation of this weekly report to provide the best available information and analysis. However, neither the American Chemistry Council, nor any of its employees, agents or other assigns makes any warranty, expressed or implied, or assumes any liability or responsibility for any use, or the results of such use, of any information or data disclosed in this material.
Contact us at ACC_EconomicsDepartment@americanchemistry.com


